Stocks were mixed on Wednesday with QQQ taking a big hit and IWM getting a small bounce. The S&P 500 SPDR (SPY) finished modestly lower and the S&P MidCap SPDR (MDY) managed a small gain. It is pretty amazing that small and mid caps were lagging and then decided to bounce when large-caps weakened. Even though the technology sector got whacked, the finance, consumer discretionary and healthcare sectors gained ground. Note that the Finance SPDR (XLF), EW Finance ETF (RYF), Consumer Staples SPDR (XLP) and EW Consumer Staples ETF (RHS) hit new highs. The HealthCare SPDR (XLV), EW Healthcare ETF (RYH) and Consumer Discretionary SPDR (XLY) are close to new highs and also holding up well. There may be pockets of weakness in the market, but there are also some big pockets of strength to counter this weakness. Also note that the Home Construction iShares (ITB) surged over 2% with good volume.
**This chart analysis is for educational purposes only, and should not
be construed as a recommendation to buy, sell or sell-short said securities**
Short-term Overview (Thursday, 23-July-2015):
- Short-term Breadth is bullish.
- Four of the five Equal-weight Sector ETFs are in uptrends.
- SPY broke out with a gap-surge on July 13th.
- QQQ broke out with a gap-surge on July 13th and is leading.
- IWM broke out, but is lagging and testing the breakout already.
- TLT is trading within a rather choppy range.
- UUP is in a short-term uptrend.
- USO is in a short-term downtrend.
- GLD is in a short-term downtrend.
The Equal-Weight S&P 500 ETF (RSP) broke out with a gap-surge above 80.5 and then pulled back over the last four days. A pullback is normal after the bounce from 79 to 81.5, and the ETF is now at its moment-of-truth. The resistance zone and gap turn into support in the 81.5 area. Further weakness would start filling the gap and negating the breakout.
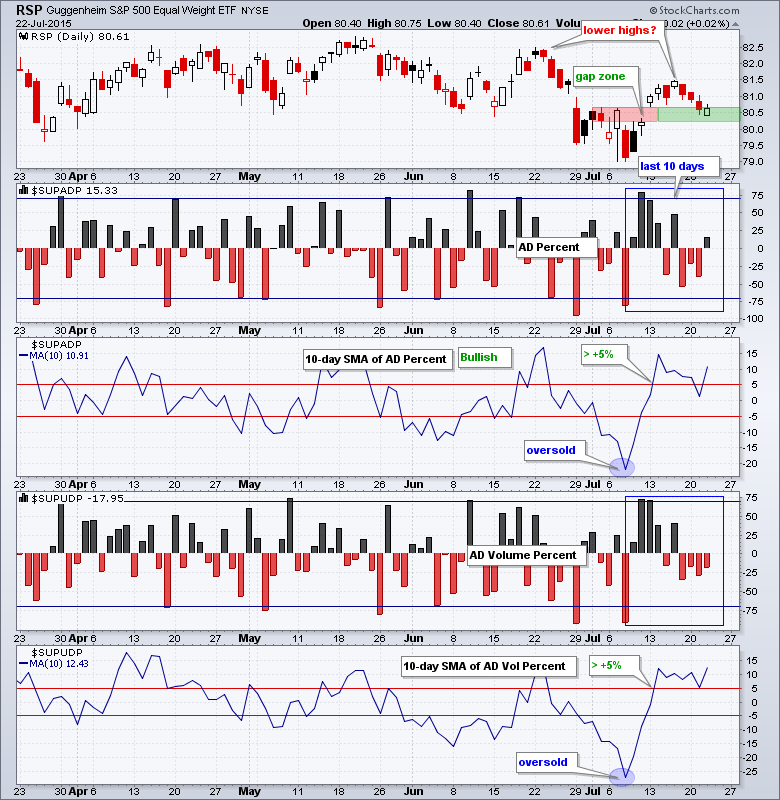
Breadth was actually split on Wednesday as AD Percent finished slightly positive and AD Volume Percent finished slightly negative. AD Volume Percent has been negative four of the last five days, but the negative readings were modest and did not show strong selling pressure. This still looks like a pullback with modest selling pressure. Overall, the 10-day SMAs for AD Percent and AD Volume Percent remain positive and net bullish.
Four of the five equal-weight sector ETFs are in short-term uptrends. The Equal-weight Finance ETF (RYF) and Equal-weight Healthcare ETF (RYH) are the strongest as both hit new highs on Wednesday. These two represent around 30% of the Equal-Weight S&P 500 ETF (RSP) and new highs are bullish. The Equal-Weight Consumer Discretionary ETF (RCD) is also strong overall. The Equal-weight Technology ETF (RYT) remains in a short-term uptrend, but shows relative weakness and is already testing the mid July breakout. The Equal-weight Industrials ETF (RGI) is in a downtrend and the weakest of the five.

**************************************************************

**************************************************************

**************************************************************

**************************************************************

**************************************************************

**************************************************************

**************************************************************

***************************************************************
Key Reports and Events (all times Eastern):
Thu - Jul 23 - 08:30 - Initial Jobless Claims
Thu - Jul 23 - 10:00 - Leading Economic Indicators
Thu - Jul 23 - 10:30 - Natural Gas Inventories
Fri - Jul 24 - 10:00 - New Home Sales
Mon - Jul 27 - 08:30 - Durable Goods Orders
Tue - Jul 28 - 09:00 - Case-Shiller Housing Index
Tue - Jul 28 - 10:00 - Consumer Confidence
Wed - Jul 29 - 07:00 - MBA Mortgage Index
Wed - Jul 29 - 10:00 - Pending Home Sales
Wed - Jul 29 - 10:30 - Crude Inventories
Wed - Jul 29 - 14:00 - FOMC Rate Decision
Thu - Jul 30 - 08:30 - Initial Jobless Claims
Thu - Jul 30 - 08:30 - GDP
Thu - Jul 30 - 10:30 - Natural Gas Inventories
Fri - Jul 31 - 09:45 - Chicago PMI
This commentary is designed to stimulate thinking. This analysis is not a recommendation to buy, sell, hold or sell short any security (stock ETF or otherwise). We all need to think for ourselves when it comes to trading our own accounts. First, it is the only way to really learn. Second, we are the only ones responsible for our decisions. Think of these charts as food for further analysis. Before making a trade, it is important to have a plan. Plan the trade and trade the plan. Among other things, this includes setting a trigger level, a target area and a stop-loss level. It is also important to plan for three possible price movements: advance, decline or sideways. Have a plan for all three scenarios BEFORE making the trade. Consider possible holding times. And finally, look at overall market conditions and sector/industry performance.


