Stocks were weak across the board with the Dow Industrials leading the way lower. Big declines in IBM and UTX weighed on the senior Average. Both stocks are above $100 and the Dow is a price weighted average. This means the stocks with the highest price carry the most weight. Tech stocks are set for a rough open with Apple and Microsoft trading lower after hours. A few ETFs bucked the selling pressure on Tuesday. The Home Construction iShares (ITB), Cyber Security ETF (HACK), Leisure and Entertainment ETF (PEJ), Insurance SPDR (KIE) and Airline ETF (JETS) managed to gain. JETS is interesting because it has a potential double bottom working and is challenging its June high.
**This chart analysis is for educational purposes only, and should not
be construed as a recommendation to buy, sell or sell-short said securities**
Short-term Overview (Wednesday, 22-July-2015):
- Short-term Breadth is bullish.
- Four of the five Equal-weight Sector ETFs are in uptrends.
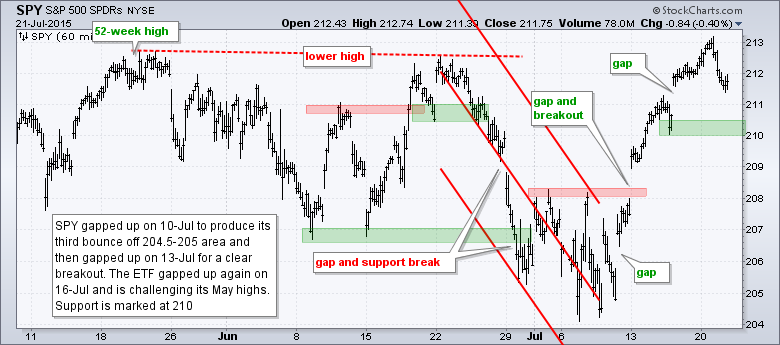
- SPY broke out with a gap-surge on July 13th.
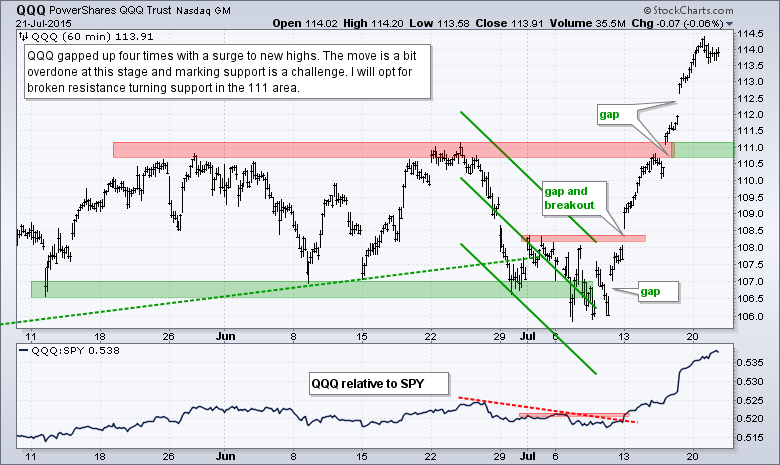
- QQQ broke out with a gap-surge on July 13th and is leading.
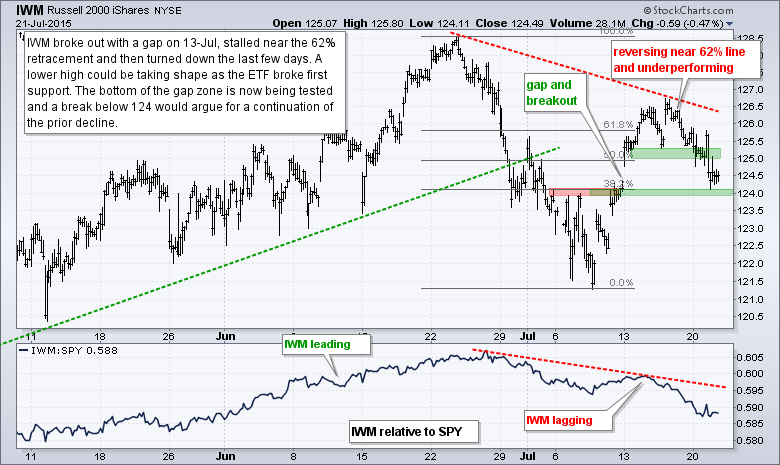
- IWM broke out, but is lagging and testing the breakout already.
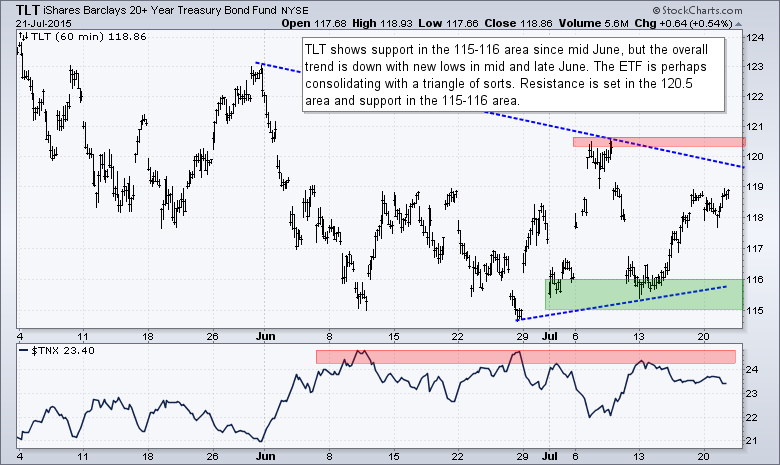
- TLT is trading within a rather choppy range.
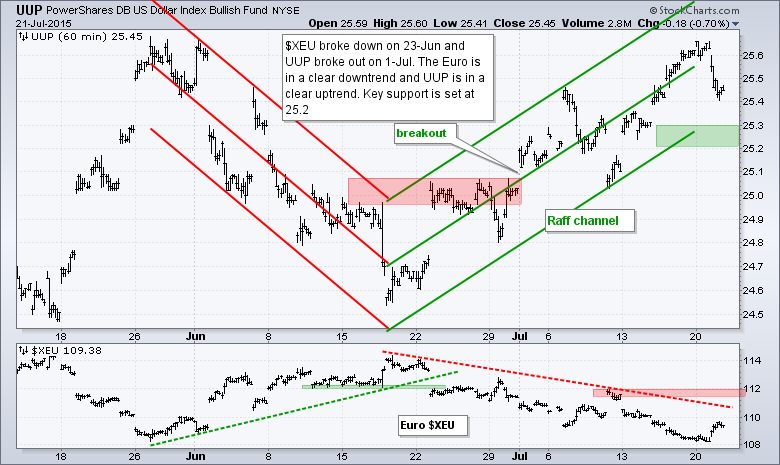
- UUP is in a short-term uptrend.
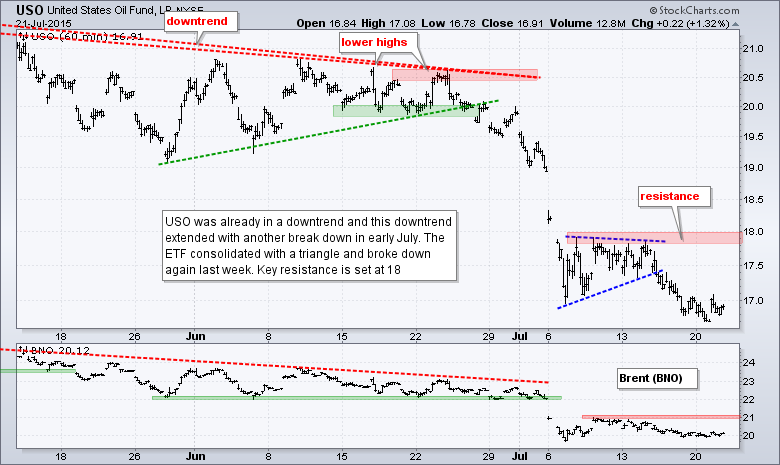
- USO is in a short-term downtrend.
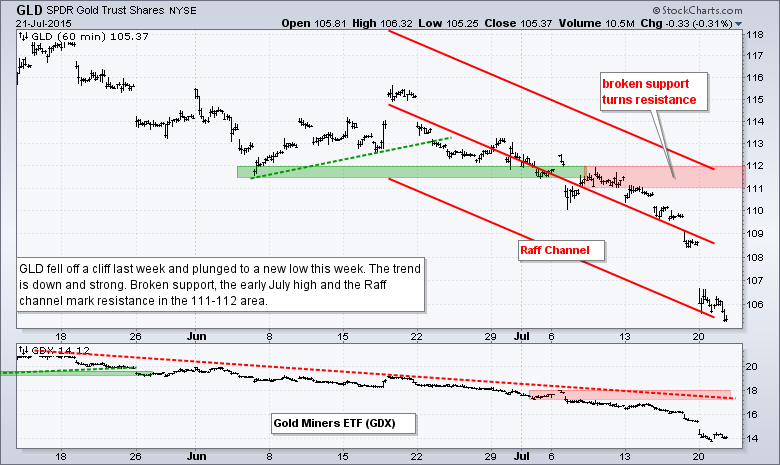
- GLD is in a short-term downtrend.
No change. The Equal-Weight S&P 500 ETF (RSP) broke resistance with a gap and surge on July 13th and this breakout is holding. Broken resistance and the gap turn first support in the 80.50 area. There is some concern because RSP is lagging SPY quite bad and a lower high formed in mid June. A support break here would forge another lower high and reverse the short-term uptrend. This would also be a bearish signal for small-caps (IWM) and mid-caps (MDY).
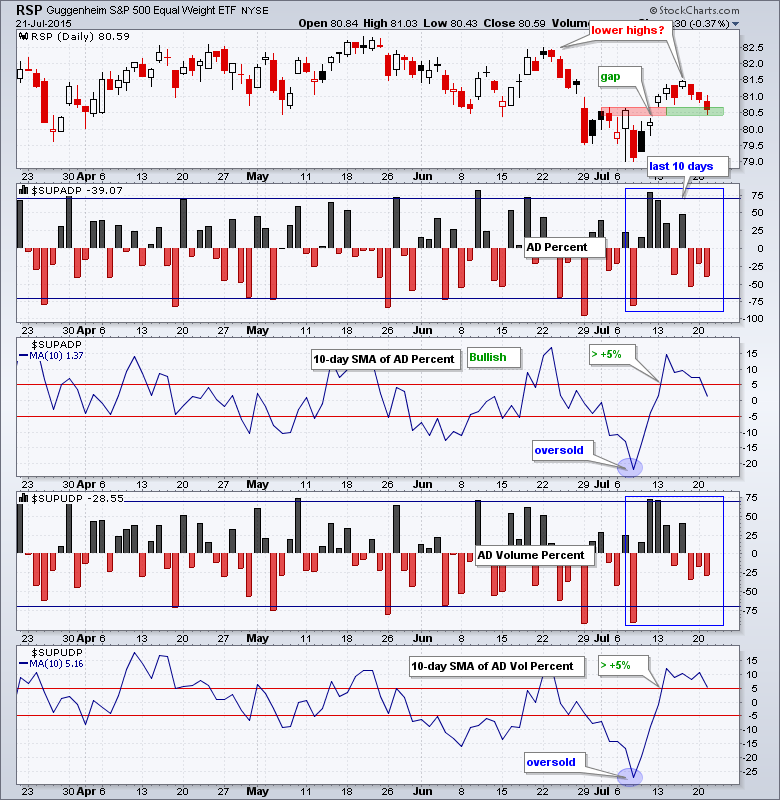
The 10-day SMAs for AD Percent and AD Volume Percent moved above +5% to turn bullish on July 14th. Breadth has weakened over the last five days with four down days and only one up day. The down days have been contained so far and this could be just a correction after the big surge. Overall, breadth remains bullish until we get a downward thrust or the 10-day SMAs move below -5%.
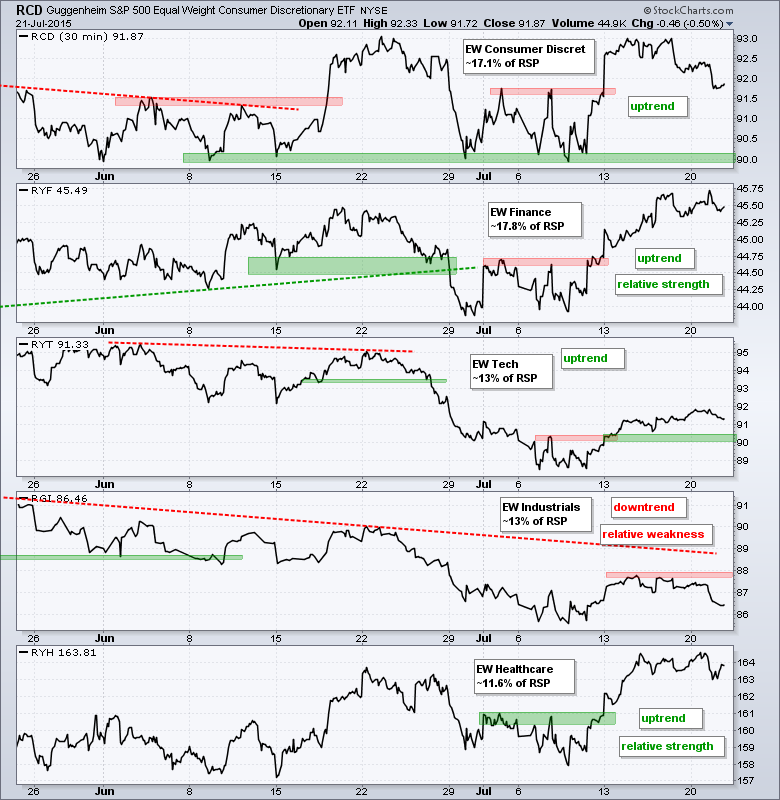
Four of the five equal-weight sector ETFs are in short-term uptrends. The Equal-weight Industrials ETF (RGI) has been reclassified as a downtrend because it did not hold the breakout and has a series of lower highs. The Equal-Weight Consumer Discretionary ETF (RCD) is still in an uptrend, but the ETF fell over the last few days and should be watched closely. The Equal-weight Finance ETF (RYF) and Equal-weight Healthcare ETF (RYH) remain the strongest sectors right now.
**************************************************************
**************************************************************
**************************************************************
**************************************************************
**************************************************************
**************************************************************
**************************************************************
***************************************************************
Key Reports and Events (all times Eastern):
Wed - Jul 22 - 07:00 - MBA Mortgage Index
Wed - Jul 22 - 09:00 - FHFA Housing Price Index
Wed - Jul 22 - 10:00 - Existing Home Sales
Wed - Jul 22 - 10:30 - Crude Oil Inventories
Thu - Jul 23 - 08:30 - Initial Jobless Claims
Thu - Jul 23 - 10:00 - Leading Economic Indicators
Thu - Jul 23 - 10:30 - Natural Gas Inventories
Fri - Jul 24 - 10:00 - New Home Sales
Mon - Jul 27 - 08:30 - Durable Goods Orders
Tue - Jul 28 - 09:00 - Case-Shiller Housing Index
Tue - Jul 28 - 10:00 - Consumer Confidence
Wed - Jul 29 - 07:00 - MBA Mortgage Index
Wed - Jul 29 - 10:00 - Pending Home Sales
Wed - Jul 29 - 10:30 - Crude Inventories
Wed - Jul 29 - 14:00 - FOMC Rate Decision
Thu - Jul 30 - 08:30 - Initial Jobless Claims
Thu - Jul 30 - 08:30 - GDP
Thu - Jul 30 - 10:30 - Natural Gas Inventories
Fri - Jul 31 - 09:45 - Chicago PMI
This commentary is designed to stimulate thinking. This analysis is not a recommendation to buy, sell, hold or sell short any security (stock ETF or otherwise). We all need to think for ourselves when it comes to trading our own accounts. First, it is the only way to really learn. Second, we are the only ones responsible for our decisions. Think of these charts as food for further analysis. Before making a trade, it is important to have a plan. Plan the trade and trade the plan. Among other things, this includes setting a trigger level, a target area and a stop-loss level. It is also important to plan for three possible price movements: advance, decline or sideways. Have a plan for all three scenarios BEFORE making the trade. Consider possible holding times. And finally, look at overall market conditions and sector/industry performance.


