Stocks were hit with selling pressure last week as the Russell 2000 iShares (IWM) fell 3.32% and the S&P 500 SPDR (SPY) declined 2.11%. IWM is in a short-term downtrend because it is already testing the early July low. QQQ is holding up the best and has retraced 38% of the mid July surge. SPY is in the middle because it has retraced 62% of the mid July surge and filled the 13-July gap. Despite bearish breadth and relative weakness in small-caps, note that five of the nine sector SPDRs and four of the five equal-weight sector ETFs hit new highs at some point last week. Selling pressure was concentrated in the materials, energy and industrials sectors. Elsewhere, the Insurance SPDR (KIE) and Medical Devices ETF (IHI) moved higher and hit 52-week highs. Bonds were also up as money moved to relative safety.
**This chart analysis is for educational purposes only, and should not
be construed as a recommendation to buy, sell or sell-short said securities**
Short-term Overview (Monday, 27-July-2015):
- Short-term Breadth is bearish.
- Three of the five Equal-weight Sector ETFs are in downtrends.
- SPY filled the mid July breakout gap and is in a downtrend.
- QQQ fell to broken resistance and is in a downtrend.
- IWM is in a short-term downtrend.
- TLT exceeded its early July high to start an uptrend.
- UUP is in a short-term uptrend.
- USO is in a short-term downtrend.
- GLD is in a short-term downtrend.
The Equal-Weight S&P 500 ETF (RSP) failed to hold the mid July gap-breakout and plunged back to its early July lows. The ETF now has a lower high in late June and in mid July to denote a two month downtrend. The swing within this downtrend is down with resistance marked at 81.
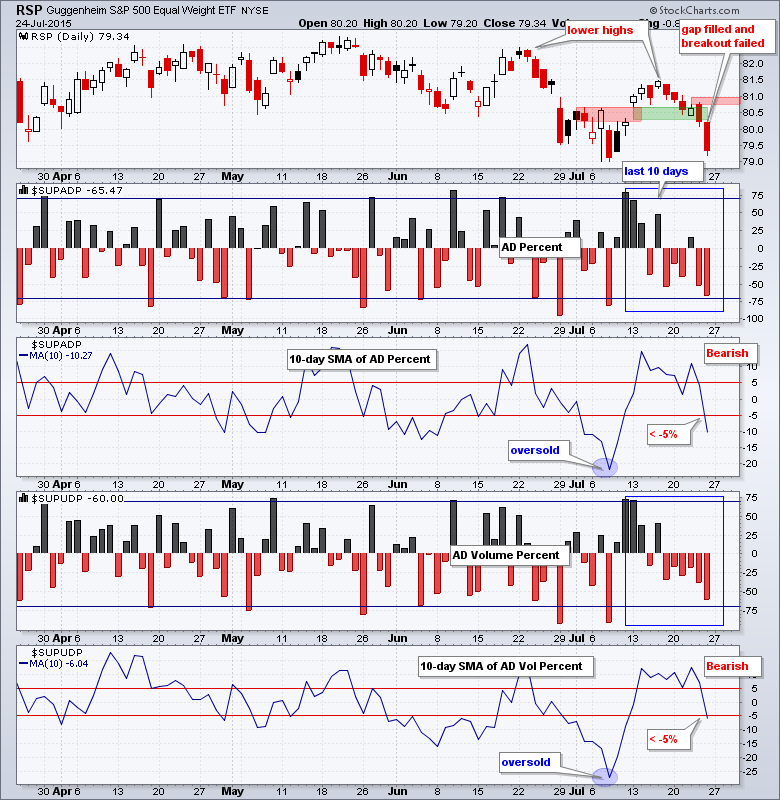
AD Percent hit -65% and AD Volume Percent finished at -60%. Frankly, I would have expected some sort of downward breadth thrust and numbers below -70% and am a bit surprised. Nevertheless, the 10-day SMAs for AD Percent and AD Volume Percent moved below -5% to turn breadth bearish.
Three of the five equal-weight sector ETFs are in downtrends. The Equal-Weight Consumer Discretionary ETF (RCD) formed a lower high and broke support. The Equal-weight Industrials ETF (RGI) has been in a downtrend and is the weakest. The Equal-weight Healthcare ETF (RYH) broke down with a sharp decline below support. The Equal-weight Finance ETF (RYF) is holding up the best overall. The Equal-weight Technology ETF (RYT) actually held up well and traded flat the last two weeks.

**************************************************************

**************************************************************

**************************************************************

**************************************************************

**************************************************************

**************************************************************

**************************************************************

***************************************************************
Key Reports and Events (all times Eastern):
Mon - Jul 27 - 08:30 - Durable Goods Orders
Tue - Jul 28 - 09:00 - Case-Shiller Housing Index
Tue - Jul 28 - 10:00 - Consumer Confidence
Wed - Jul 29 - 07:00 - MBA Mortgage Index
Wed - Jul 29 - 10:00 - Pending Home Sales
Wed - Jul 29 - 10:30 - Crude Inventories
Wed - Jul 29 - 14:00 - FOMC Rate Decision
Thu - Jul 30 - 08:30 - Initial Jobless Claims
Thu - Jul 30 - 08:30 - GDP
Thu - Jul 30 - 10:30 - Natural Gas Inventories
Fri - Jul 31 - 09:45 - Chicago PMI
This commentary is designed to stimulate thinking. This analysis is not a recommendation to buy, sell, hold or sell short any security (stock ETF or otherwise). We all need to think for ourselves when it comes to trading our own accounts. First, it is the only way to really learn. Second, we are the only ones responsible for our decisions. Think of these charts as food for further analysis. Before making a trade, it is important to have a plan. Plan the trade and trade the plan. Among other things, this includes setting a trigger level, a target area and a stop-loss level. It is also important to plan for three possible price movements: advance, decline or sideways. Have a plan for all three scenarios BEFORE making the trade. Consider possible holding times. And finally, look at overall market conditions and sector/industry performance.


