Stocks were hit with further selling pressure on Monday, but selling pressure was rather contained. IWM, QQQ and SPY declined between .50% and 1%. Eight of the nine sectors were down with utilities bucking the selling pressure. Healthcare and consumer staples also held up relatively well with fractional declines. The REIT iShares (IYR) and Alerian MLP ETF (AMJ), which are rate sensitive, attracted some buying pressure along with utilities. Commodity-related stocks were hit again with the Copper Miners ETF (COPX), Gold Miners ETF (GDX) and Global X Uranium ETF (URA) falling over 3%. This is perhaps related to the selling pressure in Chinese stocks.
**This chart analysis is for educational purposes only, and should not
be construed as a recommendation to buy, sell or sell-short said securities**
Short-term Overview (Tuesday, 28-July-2015):
- Short-term Breadth is bearish, but oversold.
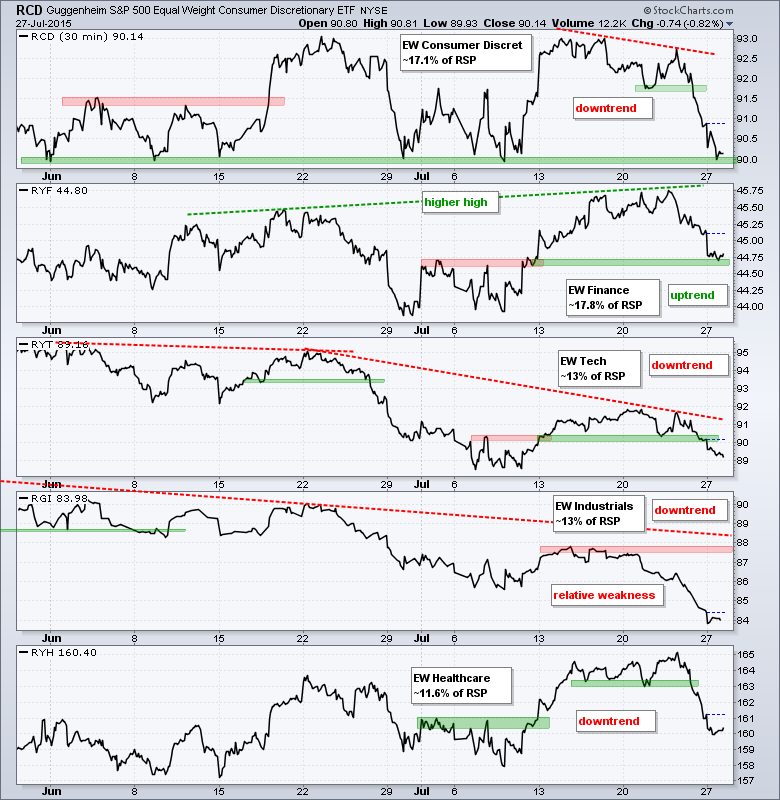
- Four of the five EW sector ETFs are in downtrends.
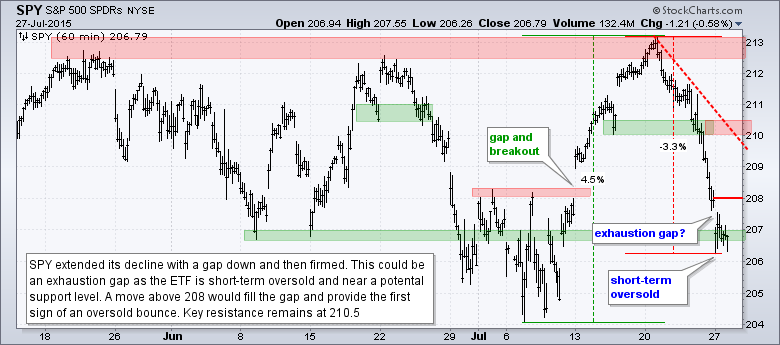
- SPY is in a downtrend, but oversold and at potential support.
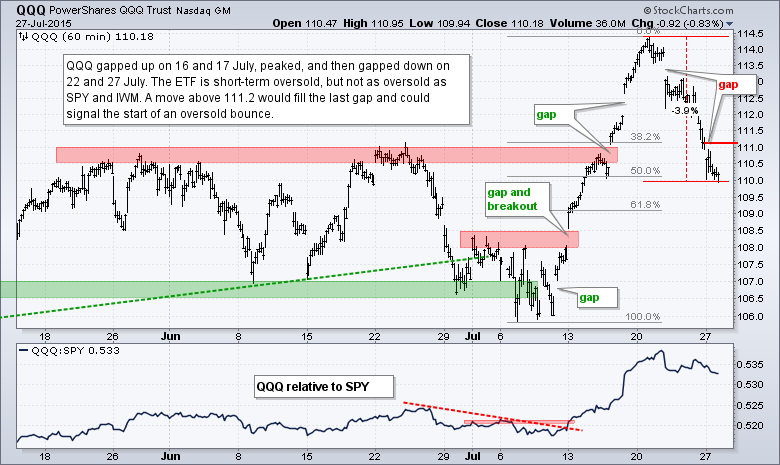
- QQQ retraced 50% of the prior advance and filled the mid July gaps.
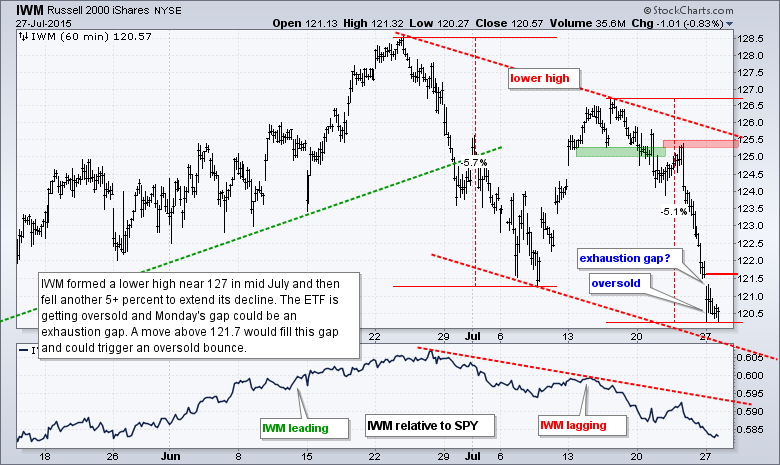
- IWM is in a short-term downtrend, but oversold.
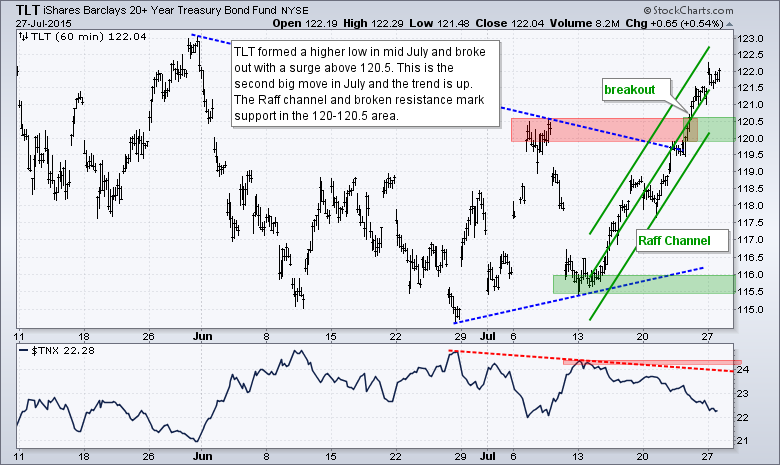
- TLT exceeded its early July high to start an uptrend.
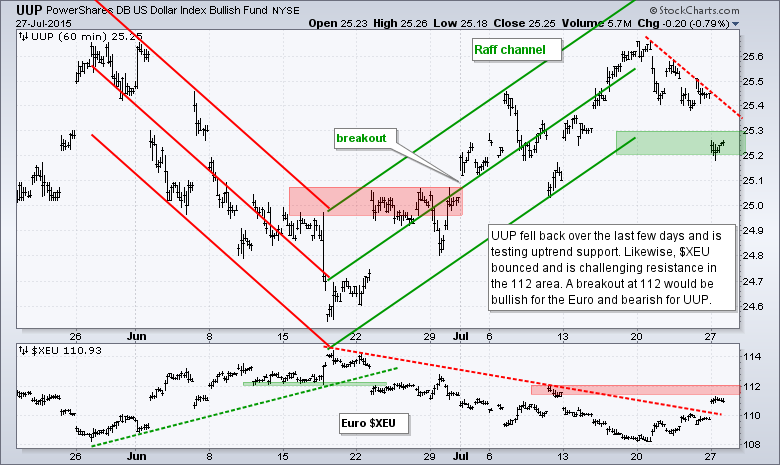
- UUP fell sharply and is testing uptrend support.
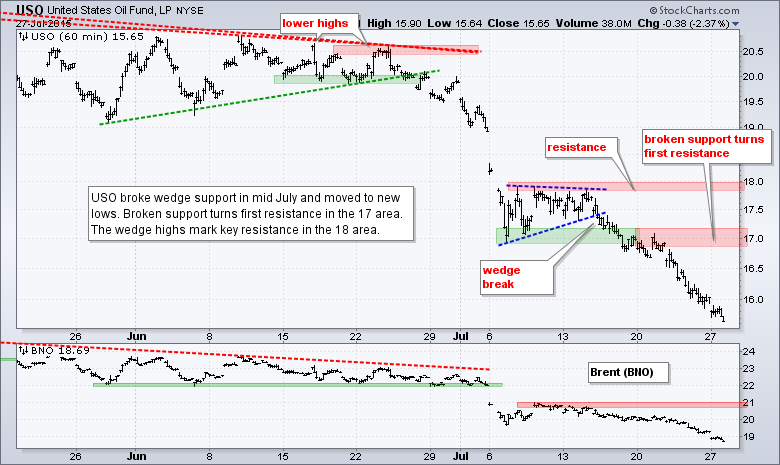
- USO is in a short-term downtrend.
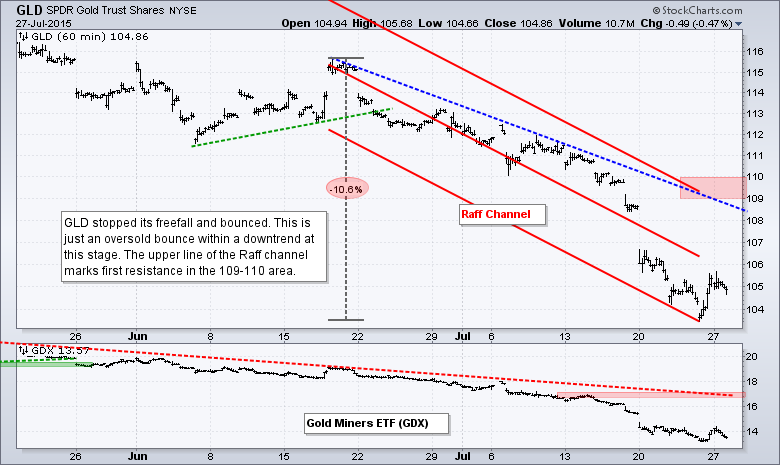
- GLD is in a short-term downtrend.
The Equal-Weight S&P 500 ETF (RSP) is down around 3% in seven days and short-term oversold. The ETF opened with a gap down and then firmed with an indecisive candlestick. A gap up would be the first sign for an oversold bounce. It is, however, important that this gap holds. A move back below 79 after a gap up would suggest a failure.
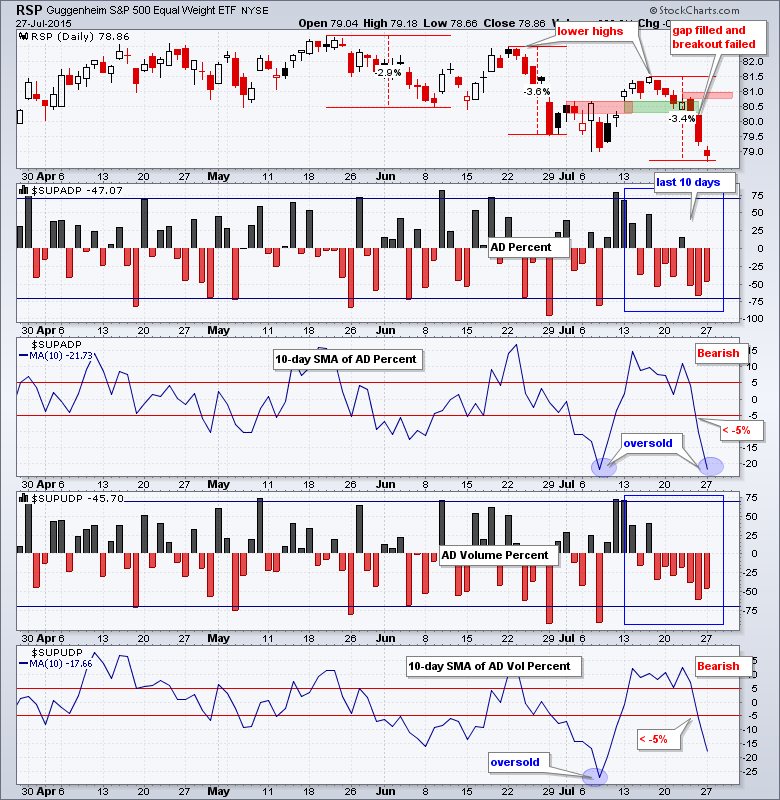
Breadth overall is bearish, but oversold and suggesting that the market is ripe for a short-term bounce. AD Percent has been negative for seven of the last ten days and the 10-day SMA is below -20%, which is very oversold. AD Volume Percent has been negative for eight of the last ten days and the last seven days in a row. The 10-day SMA is below -15%, which is modestly oversold.
Four of the five equal-weight sector ETFs are in downtrends. The Equal-weight Finance ETF (RYF) is the only sector still in an uptrend because it has yet to negate the mid July breakout. The Equal-Weight Consumer Discretionary ETF (RCD) formed a lower high and broke support. The ETF is, however, at support from the June-July lows. The Equal-weight Technology ETF (RYT) and Equal-weight Industrials ETF (RGI) formed lower highs in mid July and broke down again. The Equal-weight Healthcare ETF (RYH) hit a new high last week, but broke support with a sharp decline last week.
**************************************************************
**************************************************************
**************************************************************
**************************************************************
**************************************************************
**************************************************************
**************************************************************
***************************************************************
Key Reports and Events (all times Eastern):
Tue - Jul 28 - 09:00 - Case-Shiller Housing Index
Tue - Jul 28 - 10:00 - Consumer Confidence
Wed - Jul 29 - 07:00 - MBA Mortgage Index
Wed - Jul 29 - 10:00 - Pending Home Sales
Wed - Jul 29 - 10:30 - Crude Inventories
Wed - Jul 29 - 14:00 - FOMC Rate Decision
Thu - Jul 30 - 08:30 - Initial Jobless Claims
Thu - Jul 30 - 08:30 - GDP
Thu - Jul 30 - 10:30 - Natural Gas Inventories
Fri - Jul 31 - 09:45 - Chicago PMI
This commentary is designed to stimulate thinking. This analysis is not a recommendation to buy, sell, hold or sell short any security (stock ETF or otherwise). We all need to think for ourselves when it comes to trading our own accounts. First, it is the only way to really learn. Second, we are the only ones responsible for our decisions. Think of these charts as food for further analysis. Before making a trade, it is important to have a plan. Plan the trade and trade the plan. Among other things, this includes setting a trigger level, a target area and a stop-loss level. It is also important to plan for three possible price movements: advance, decline or sideways. Have a plan for all three scenarios BEFORE making the trade. Consider possible holding times. And finally, look at overall market conditions and sector/industry performance.


