Stocks surged last week with a rather lopsided advance. QQQ surged over 5% and SPY was up around 2.45%. IWM lagged with a 1.31% gain and MDY gained just .35%. Small-caps and mid-caps lagged as large-caps led. Among the sectors, technology and healthcare led as energy and materials lagged. Biotechs led the healthcare sector as the Biotech SPDR (XBI) hit a new high. The Oil & Gas Equip & Services SPDR (XES) fell to a new low and led the energy sector lower. Steel stocks led the Metals & Mining SPDR (XME) to new lows. Gold fell to new lows and this weighed on the Gold Miners ETF (GDX), which hit a new low as well.
**This chart analysis is for educational purposes only, and should not
be construed as a recommendation to buy, sell or sell-short said securities**
Short-term Overview (Monday, 20-July-2015):
- Short-term Breadth is bullish.
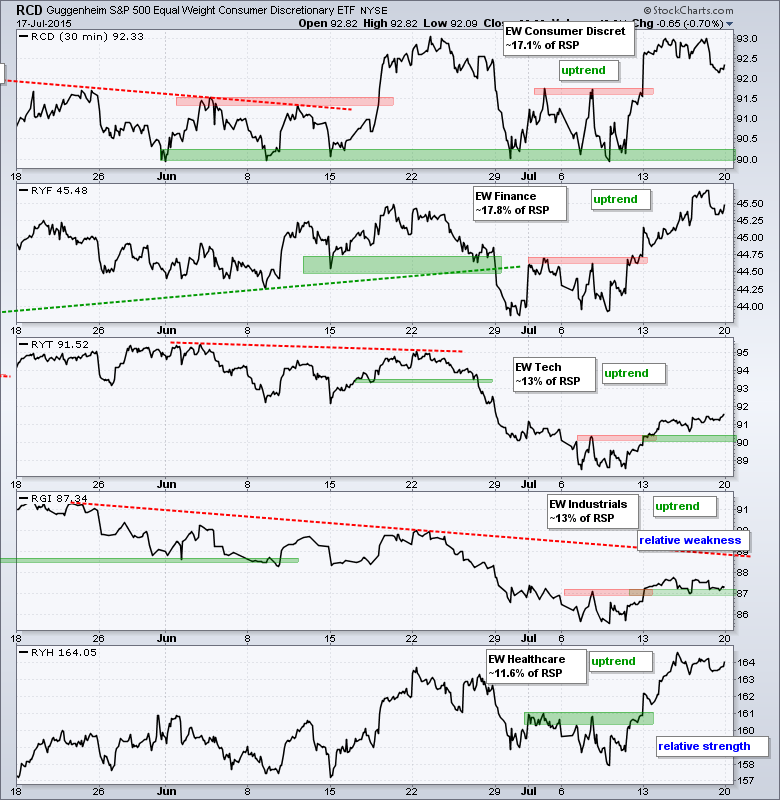
- All Five Equal-weight Sector ETFs are in uptrends.
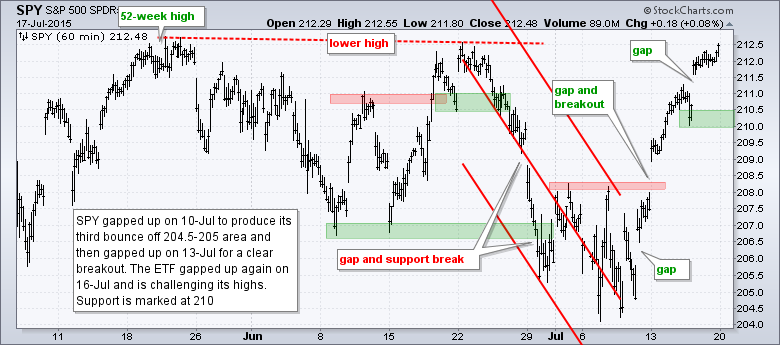
- SPY broke out with a gap-surge on July 13th.
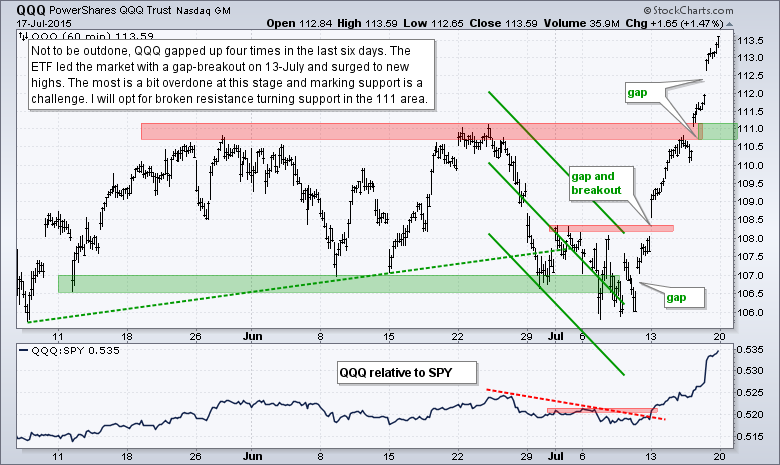
- QQQ broke out with a gap-surge on July 13th and is leading.
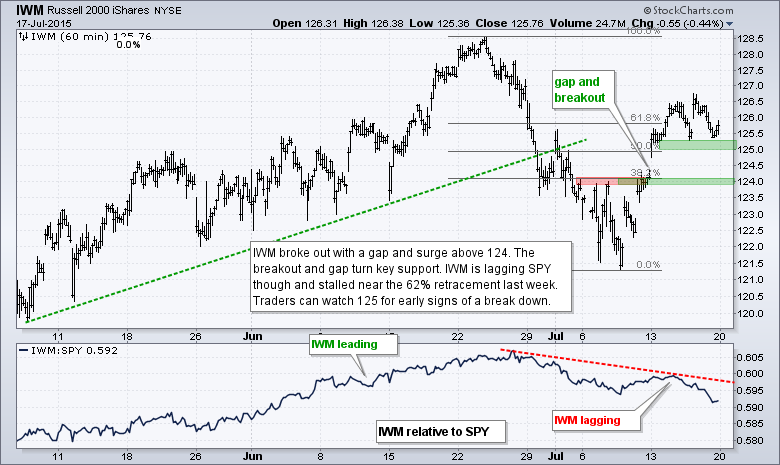
- IWM broke out with a gap-surge on July 13th, but is lagging.
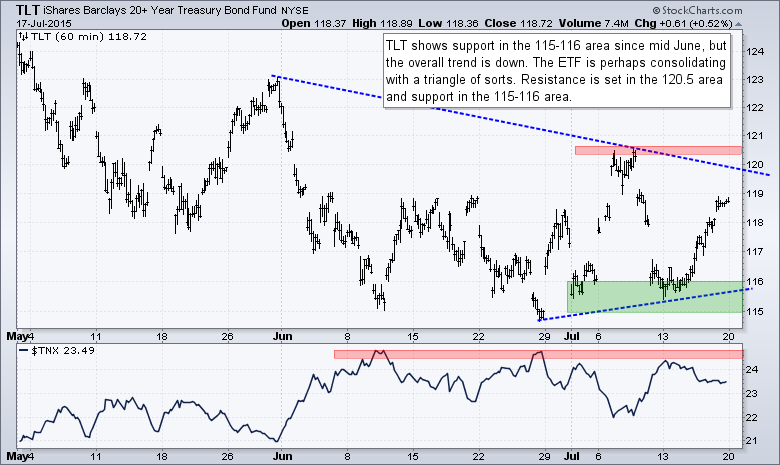
- TLT is trading within a rather choppy range.
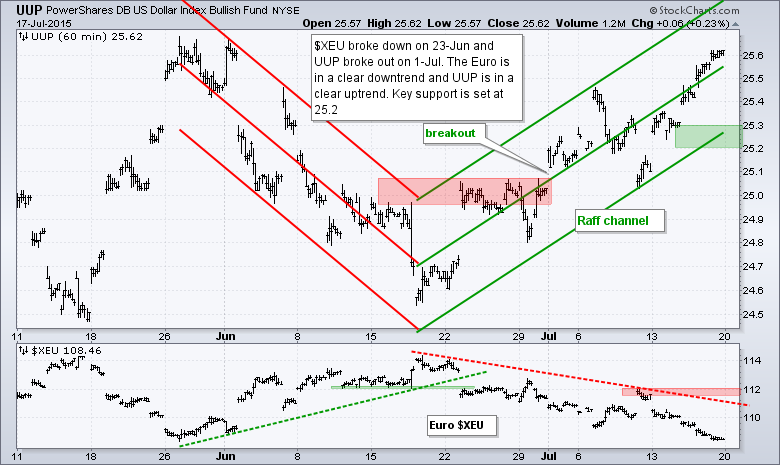
- UUP is in a short-term uptrend.
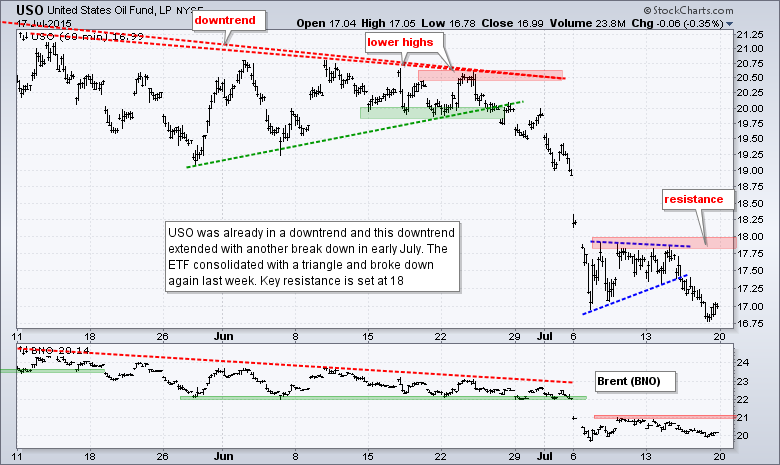
- USO is in a short-term downtrend.
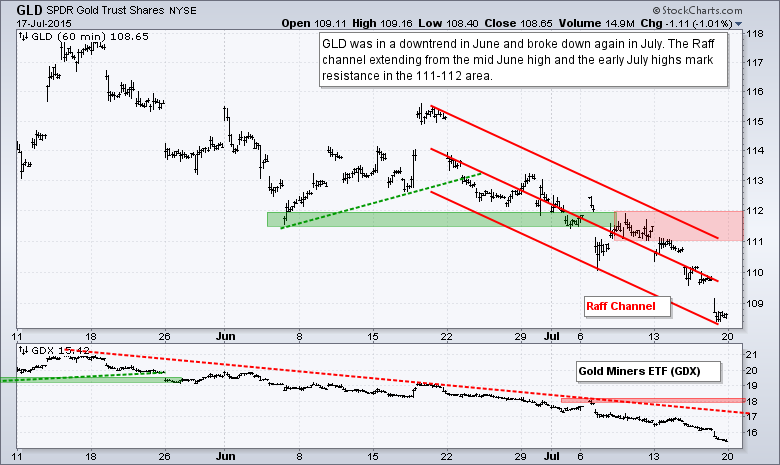
- GLD is in a short-term downtrend.
The Equal-Weight S&P 500 ETF (RSP) broke resistance with a gap-surge on July 13th and this breakout is holding. RSP is, however, underperforming SPY because it remains well below its May-June highs. The breakout and gap zone turn first support in the 80.50 area.
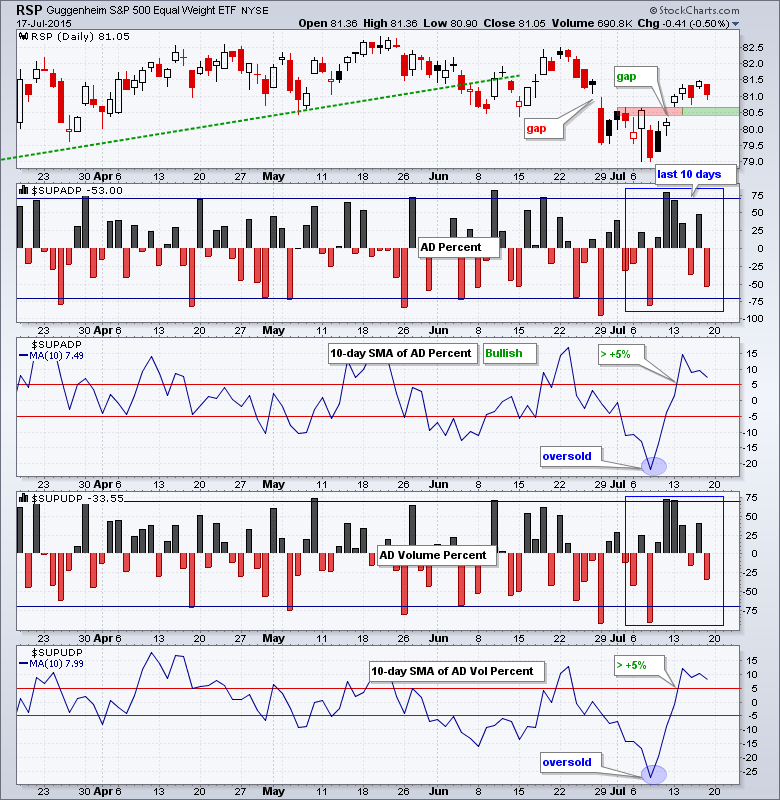
AD Percent and AD Volume Percent surged on July 10th and 13th, but short-term breadth did not turn bullish until the 10-day SMAs crossed above +5% on July 14th. The two-day breadth thrust was bullish because it was confirmed by gaps and breakouts in the major index ETFs. The 10-day SMAs were delayed because both were extremely oversold on July 8th (below -20%).
Three of the five equal-weight sector ETFs broke out on July 10th to tilt the balance to the bulls. The Equal-Weight Consumer Discretionary ETF (RCD), Equal-weight Healthcare ETF (RYH) and Equal-weight Finance ETF (RYF) are the leaders right now. The Equal-weight Technology ETF (RYT) and Equal-weight Industrials ETF (RGI) also broke out, but both remain well below their June highs and show relative weakness.
**************************************************************
**************************************************************
**************************************************************
**************************************************************
**************************************************************
**************************************************************
**************************************************************
***************************************************************
Key Reports and Events (all times Eastern):
Wed - Jul 22 - 07:00 - MBA Mortgage Index
Wed - Jul 22 - 09:00 - FHFA Housing Price Index
Wed - Jul 22 - 10:00 - Existing Home Sales
Wed - Jul 22 - 10:30 - Crude Oil Inventories
Thu - Jul 23 - 08:30 - Initial Jobless Claims
Thu - Jul 23 - 10:00 - Leading Economic Indicators
Thu - Jul 23 - 10:30 - Natural Gas Inventories
Fri - Jul 24 - 10:00 - New Home Sales
Mon - Jul 27 - 08:30 - Durable Goods Orders
Tue - Jul 28 - 09:00 - Case-Shiller Housing Index
Tue - Jul 28 - 10:00 - Consumer Confidence
Wed - Jul 29 - 07:00 - MBA Mortgage Index
Wed - Jul 29 - 10:00 - Pending Home Sales
Wed - Jul 29 - 10:30 - Crude Inventories
Wed - Jul 29 - 14:00 - FOMC Rate Decision
Thu - Jul 30 - 08:30 - Initial Jobless Claims
Thu - Jul 30 - 08:30 - GDP
Thu - Jul 30 - 10:30 - Natural Gas Inventories
Fri - Jul 31 - 09:45 - Chicago PMI
This commentary is designed to stimulate thinking. This analysis is not a recommendation to buy, sell, hold or sell short any security (stock ETF or otherwise). We all need to think for ourselves when it comes to trading our own accounts. First, it is the only way to really learn. Second, we are the only ones responsible for our decisions. Think of these charts as food for further analysis. Before making a trade, it is important to have a plan. Plan the trade and trade the plan. Among other things, this includes setting a trigger level, a target area and a stop-loss level. It is also important to plan for three possible price movements: advance, decline or sideways. Have a plan for all three scenarios BEFORE making the trade. Consider possible holding times. And finally, look at overall market conditions and sector/industry performance.


