Stocks managed to firm after Monday's rout and several ETFs formed inside days, which signal indecision. The Russell 2000 Growth iShares (IWO) and Russell MicroCap iShares (IWC) led the rebound and gained around .90% each. The sectors were mixed with energy, consumer discretionary and finance finishing with modest gains. Utilities and consumer staples ended with fractional losses. The Cyber Security ETF (HACK) got an oversold bounce and the Internet ETF (FDN) bounced off support to keep the technology sector buoyant. New lows in the Metals & Mining SPDR (XME) and Steel ETF (SLX) weighed on the materials sector. Note that the employment report will be a day early and we will get non-farm payrolls on Thursday, instead of Friday. The US markets are closed on Friday to observe the July 4th holiday. Also note that I will be taking a two week vacation from July 6th to July 17th, and will return on July 20th (a Monday). Art's charts will not be updated tomorrow. Instead, I will write a Market Message for Friday and look at some weekly chart (long-term trends). Have a happy 4th of July weekend!
**This chart analysis is for educational purposes only, and should not
be construed as a recommendation to buy, sell or sell-short said securities**
Note that I will be taking a two week vacation from July 6th to July 17th, and will return on July 20th (a Monday). Art's charts will not be updated tomorrow. Instead, I will write a Market Message for Friday and look at some weekly chart (long-term trends). Have a happy 4th of July weekend!
Short-term Overview (Wednesday, 1-July-2015):
- Short-term Breadth is split, but the 90+ percent down days tilt bearish.
- Three of the five equal-weight sector ETFs are in downtrends.
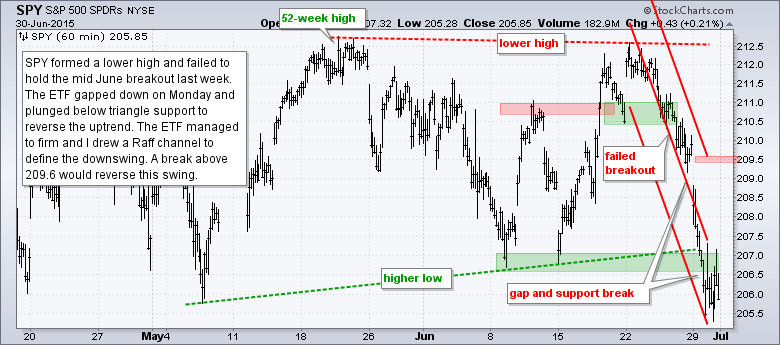
- SPY broke triangle support to fully reverse its short-term uptrend.
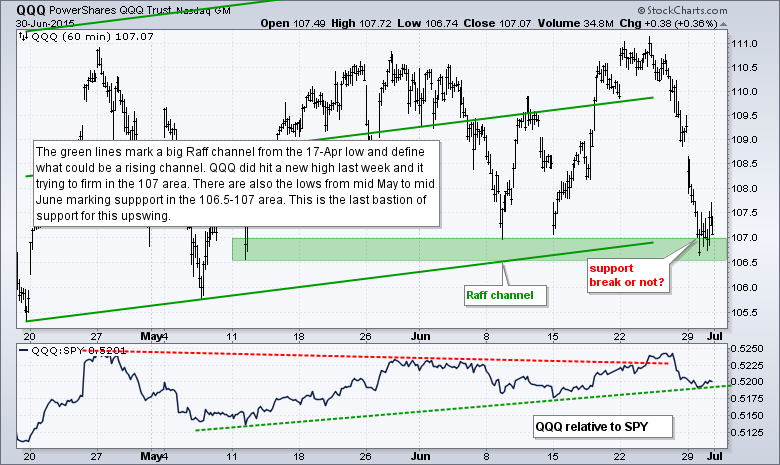
- QQQ is in a downswing, but firming near a Raff Regression Channel line.
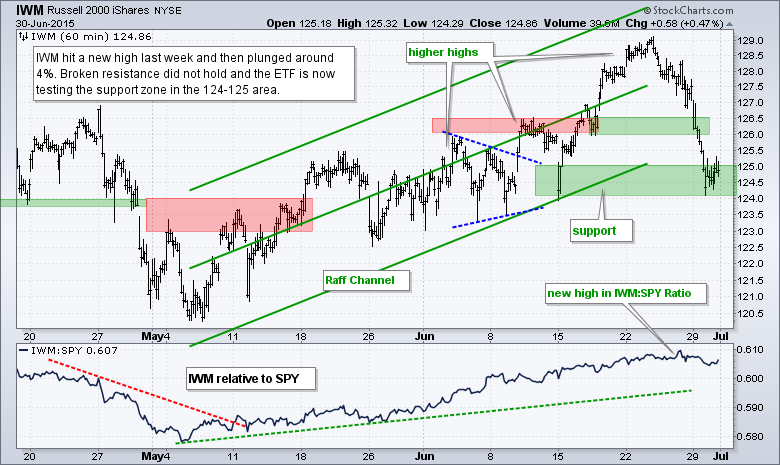
- IWM remains in an uptrend overall and is testing key support.
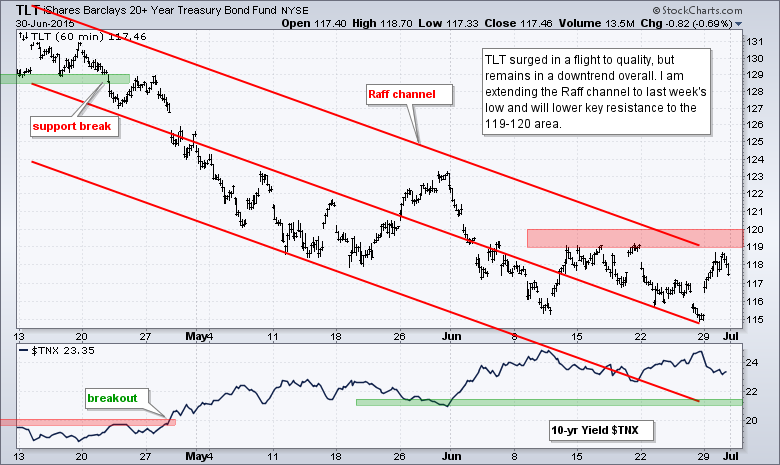
- TLT bounced with a flight to safety, but remains in a downtrend and I lowered resistance.
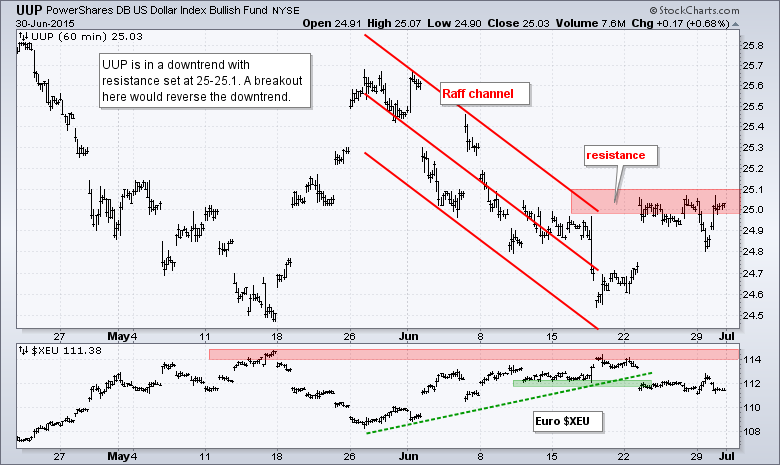
- UUP remains in a short-term downtrend, but is challenging resistance.
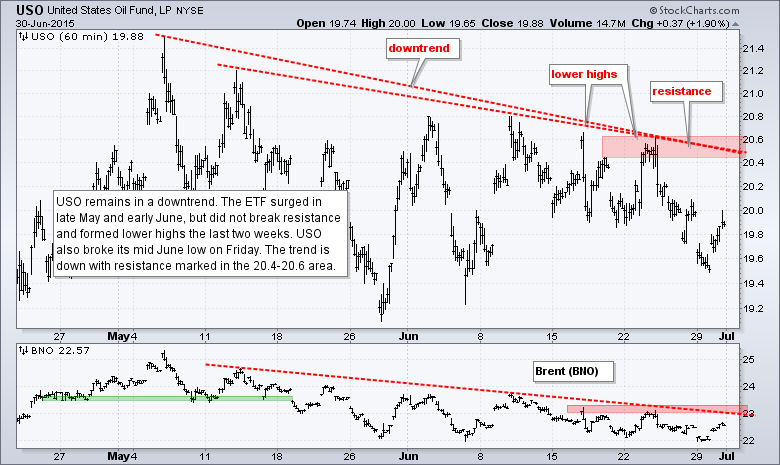
- USO remains in a short-term downtrend.
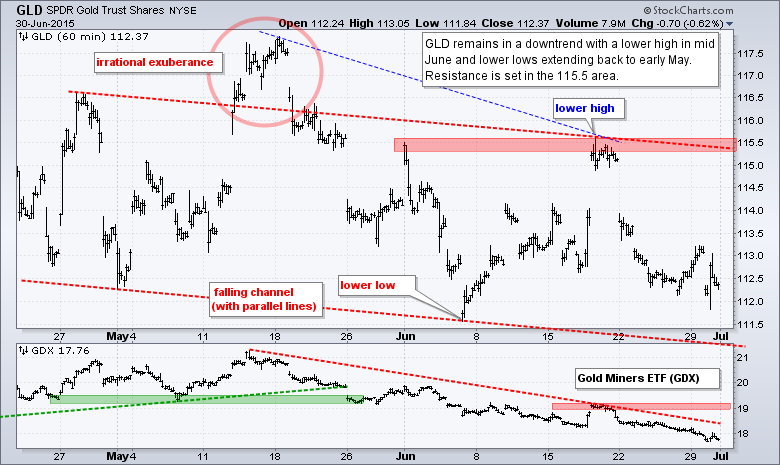
- GLD is in a short-term downtrend.
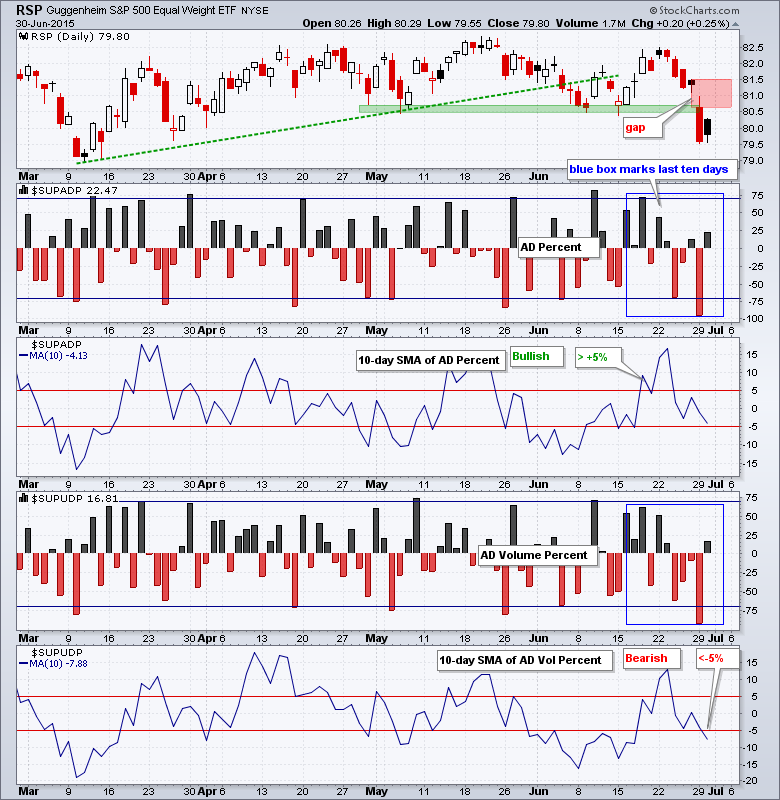
The Equal-Weight S&P 500 ETF (RSP) broke support from the May-June lows with a gap down and sharp decline on Monday. The ETF firmed on Tuesday with an inside day, which is also a harami in candlestick terms. This signals indecision that can foreshadow a short-term reversal. And low and behold, there is a "new" offer on the table and the S&P 500 futures were up 1% around 7AM ET. The gap zone marks first resistance and a break above 81.5 is needed for a breakout in RSP.
AD Percent and AD Volume Percent finished slightly positive. The 90+ percent down days on Monday dominate right now. The 10-day SMA for AD Volume Percent moved below -5% to turn bearish. The 10-day SMA for AD Percent has yet to break and could stay bullish if the market rebounds today.
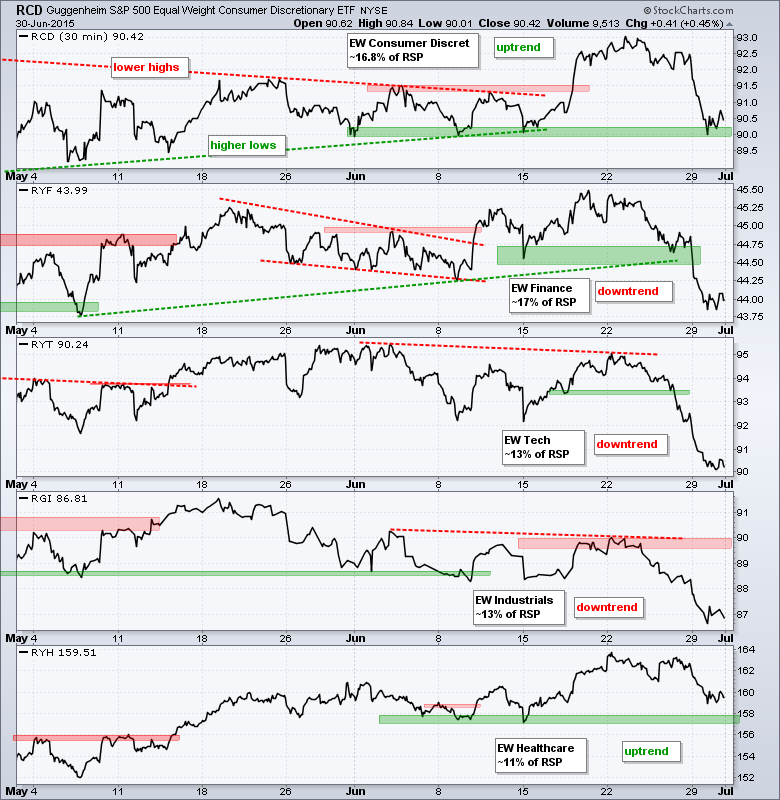
No change. Three of the four equal-weight sector ETFs are in downtrends. The Equal-weight Finance ETF (RYF) broke down with a move below support. The Equal-weight Technology ETF (RYT) broke below its May low and the Equal-weight Industrials ETF (RGI) exceeded its March lows for a complete break down. The Equal-Weight Consumer Discretionary ETF (RCD) is in an uptrend still and testing support. The Equal-weight Healthcare ETF (RYH) remains in an uptrend and above support.
**************************************************************
**************************************************************
**************************************************************
**************************************************************
**************************************************************
**************************************************************
**************************************************************
***************************************************************
Key Reports and Events (all times Eastern):
Tue - Jun 30 - 09:00 - Case-Shiller 20-city Index
Tue - Jun 30 - 09:45 - Chicago PMI
Tue - Jun 30 - 10:00 - Consumer Confidence
Wed - Jul 01 - 07:00 - MBA Mortgage Index
Wed - Jul 01 - 07:30 - Challenger Job Report
Wed - Jul 01 - 08:15 - ADP Employment Report
Wed - Jul 01 - 10:00 - ISM Manufacturing Index
Wed - Jul 01 - 10:00 - Construction Spending
Wed - Jul 01 - 10:30 - Crude Oil Inventories
Wed - Jul 01 - 17:00 - Auto-Truck Sales
Thu - Jul 02 - 08:30 - Initial Jobless Claims
Thu - Jul 02 - 08:30 - Employment Report
Thu - Jul 02 - 10:00 - Factory Orders
Thu - Jul 02 - 10:30 - Natural Gas Inventories
This commentary is designed to stimulate thinking. This analysis is not a recommendation to buy, sell, hold or sell short any security (stock ETF or otherwise). We all need to think for ourselves when it comes to trading our own accounts. First, it is the only way to really learn. Second, we are the only ones responsible for our decisions. Think of these charts as food for further analysis. Before making a trade, it is important to have a plan. Plan the trade and trade the plan. Among other things, this includes setting a trigger level, a target area and a stop-loss level. It is also important to plan for three possible price movements: advance, decline or sideways. Have a plan for all three scenarios BEFORE making the trade. Consider possible holding times. And finally, look at overall market conditions and sector/industry performance.

