Stocks bounced with gains across the board. Most of the major index ETFs gained over 1%, but the Russell 2000 iShares (IWM) lagged with a .85% gain. All sectors were up with the oversold sectors getting the biggest bounces (energy, materials and industrials). The finance, consumer discretionary and technology sectors lagged considerably and this is a concern. The Home Construction iShares (ITB) got a nice bounce with a 1.51% gain and showed some upside leadership. The Retail SPDR (XRT), however, lagged with a feeble .34% bounce. The Fed will make its policy statement this afternoon and this could make for some added volatility in the bond, currency and stock markets today.
**This chart analysis is for educational purposes only, and should not
be construed as a recommendation to buy, sell or sell-short said securities**
Short-term Overview (Wednesday, 29-July-2015):
Short-term Breadth is bearish.
The five sector ETFs are split: two up, two down and one flat.
SPY got an oversold bounce and filled Monday's gap.
QQQ bounced off the 50% retracement line.
IWM got a weak oversold bounce.
TLT exceeded its early July high to start an uptrend.
UUP fell sharply and is testing uptrend support.
USO is in a short-term downtrend.
GLD is in a short-term downtrend.
The Equal-Weight S&P 500 ETF (RSP) fell around 3% in seven days and then got an oversold bounce. The bounce was actually pretty impressive, but the short-term trend remains down and follow through is needed to reverse the downswing. The Raff channel, 24-Jul high and a buffer mark resistance at 80.5.
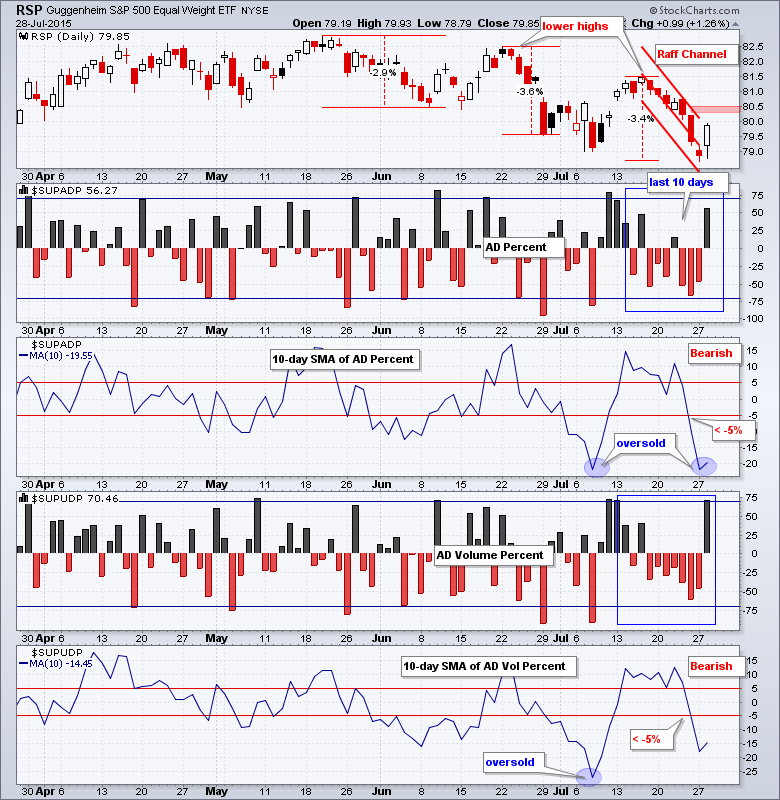
Breadth is bearish overall, but became way oversold on Monday and we got an oversold bounce on Tuesday. AD Percent exceeded +50% and AD Volume Percent exceeded +70%. This suggests that small-caps lagged and large-caps led because large-caps trade the most volume and dominate AD Volume Percent.
The equal-weight sector ETFs are split: two in uptrends, two in downtrends and one flat. This is fitting for a broader market that is essentially flat (RSP and SPY). The consumer discretionary sector has been flat since June and is the one to watch. A support break at 90 would be quite negative for this sector and the market overall. The finance and healthcare sectors formed higher highs in late July and are in uptrends overall. The technology and industrials sectors formed lower highs in late July and are in downtrends overall.

**************************************************************

**************************************************************

**************************************************************

**************************************************************

**************************************************************

**************************************************************

**************************************************************

***************************************************************
Key Reports and Events (all times Eastern):
Wed - Jul 29 - 07:00 - MBA Mortgage Index
Wed - Jul 29 - 10:00 - Pending Home Sales
Wed - Jul 29 - 10:30 - Crude Inventories
Wed - Jul 29 - 14:00 - FOMC Rate Decision
Thu - Jul 30 - 08:30 - Initial Jobless Claims
Thu - Jul 30 - 08:30 - GDP
Thu - Jul 30 - 10:30 - Natural Gas Inventories
Fri - Jul 31 - 09:45 - Chicago PMI
This commentary is designed to stimulate thinking. This analysis is not a recommendation to buy, sell, hold or sell short any security (stock ETF or otherwise). We all need to think for ourselves when it comes to trading our own accounts. First, it is the only way to really learn. Second, we are the only ones responsible for our decisions. Think of these charts as food for further analysis. Before making a trade, it is important to have a plan. Plan the trade and trade the plan. Among other things, this includes setting a trigger level, a target area and a stop-loss level. It is also important to plan for three possible price movements: advance, decline or sideways. Have a plan for all three scenarios BEFORE making the trade. Consider possible holding times. And finally, look at overall market conditions and sector/industry performance.
