Stocks caught an early bid and even held their gains to close positive. There was no follow through to the morning pop so traders can read into this as they please. The bears will point to no follow through, while the bulls will point to the ability to hold gains. The S&P 500 remains in a range since March (2040-2140) and a smaller range has developed over the last five days (2085-2115). The resolution of this smaller range could provide us with the next directional clue. Elsewhere, the technology sector led the market on Wednesday with strength in the Networking iShares (IGN), Software iShares (IGV), Semiconductor SPDR (XSD) and Cyber Security ETF (HACK). Note that IGV hit a new high and software is leading the sector.
**This chart analysis is for educational purposes only, and should not
be construed as a recommendation to buy, sell orsell-short said securities**
Short-term Overview (Thursday, 6-August-2015):
- Short-term breadth is bearish overall.
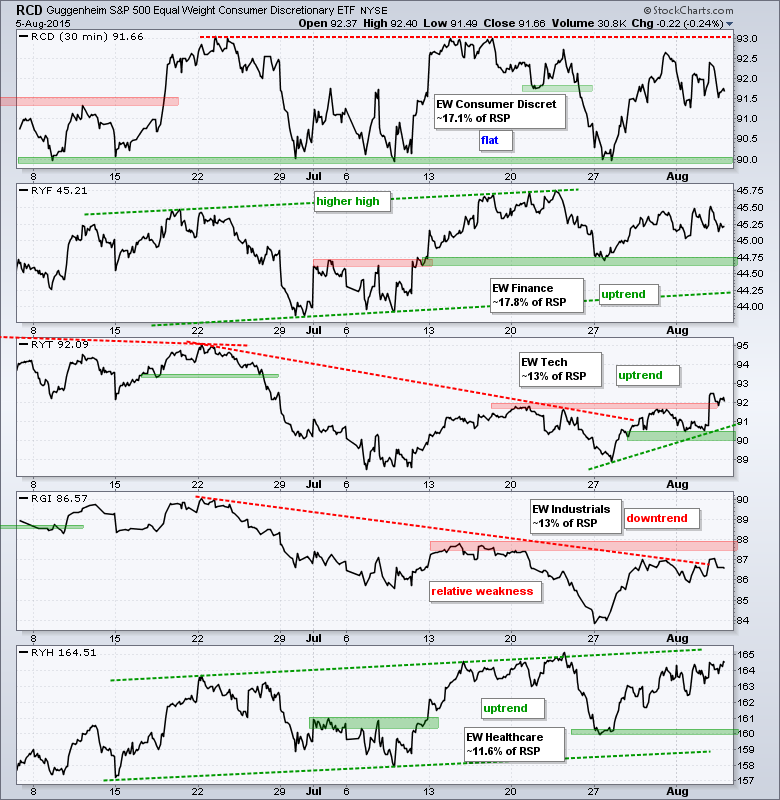
- Three of the five EW sector ETFs are in uptrends (RYT, RYH, RYF).
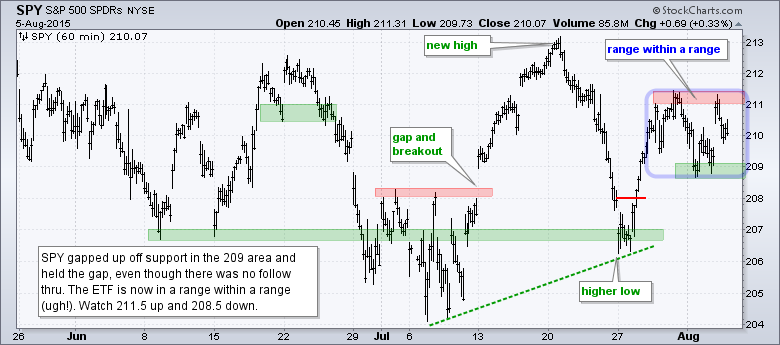
- SPY gapped off range support, but remains within a range.
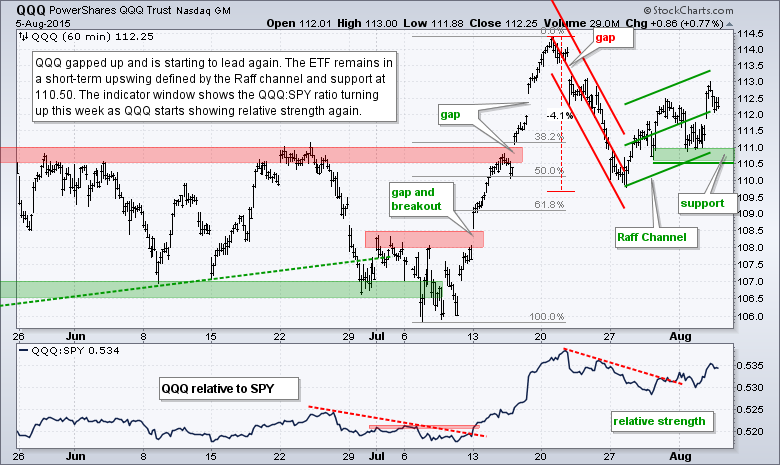
- QQQ is showing relative strength with a gap off support.
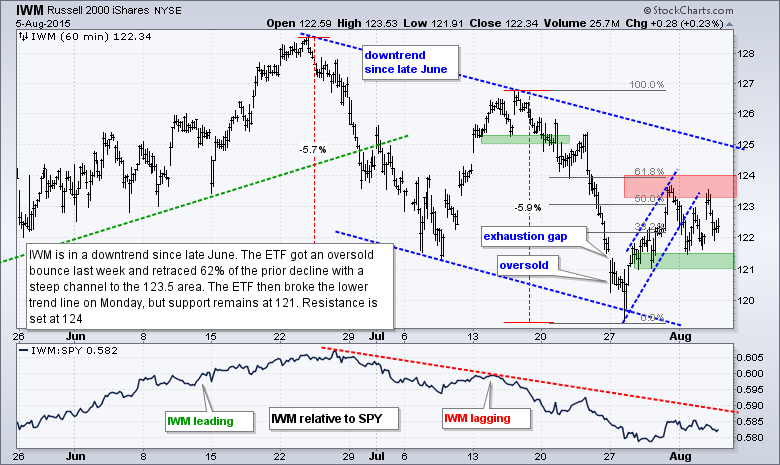
- IWM stalled after the channel break and remains range bound.
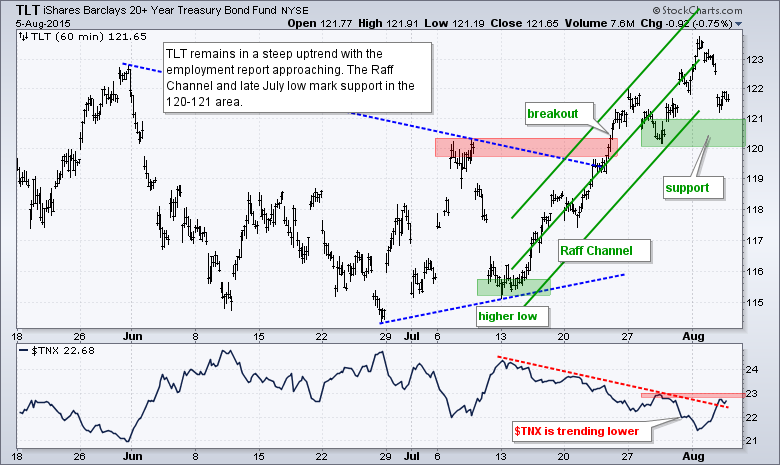
- TLT is testing uptrend support ahead of Friday's employment report.
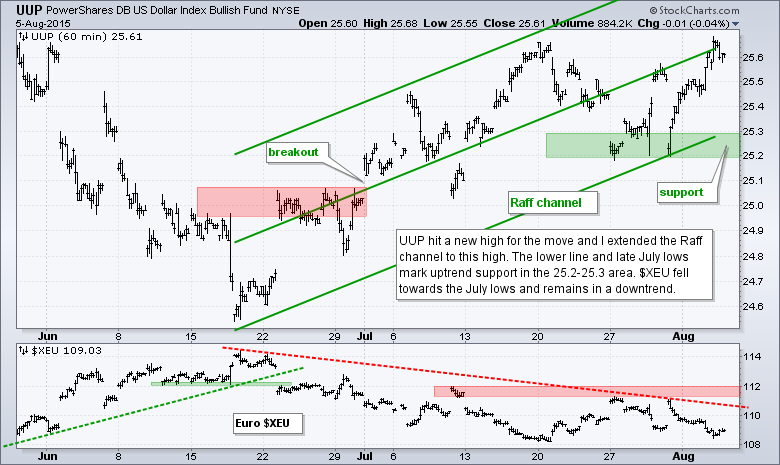
- UUP hit a new high for the move and remains in an uptrend.
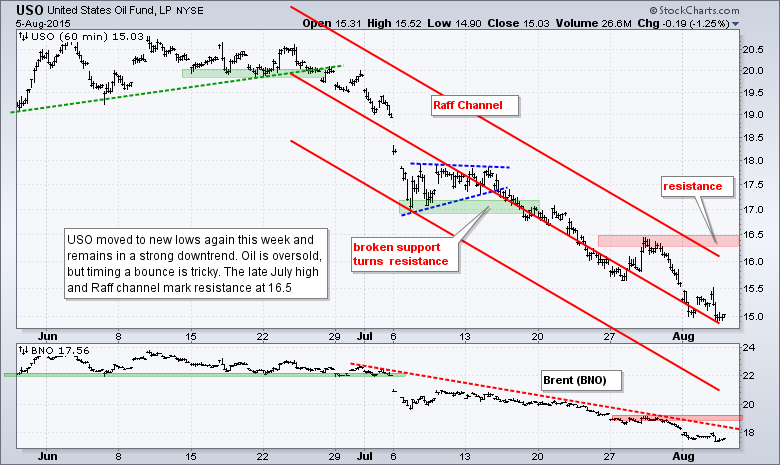
- USO is in a short-term downtrend.
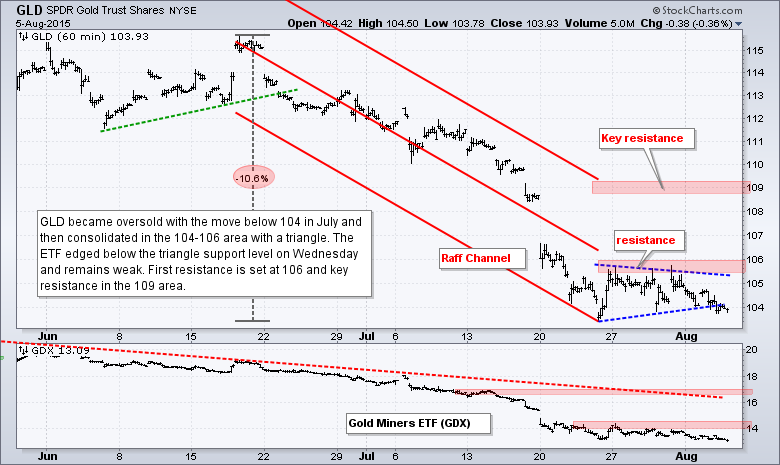
- GLD is in a short-term downtrend.
RSP stalled again, and again there is no change in the basic analysis as I remain focused on the eight-day upswing. Overall, RSP formed lower highs and lower lows in June and July. The current bounce was from a lower low and the ETF is in the middle of its four-month range. This means RSP is in a four-month trading range at best and a two-month downtrend at worst. The Raff Regression Channel and Wednesday's low define the current upswing with support marked at 79.8. A close below this level would reverse the upswing.
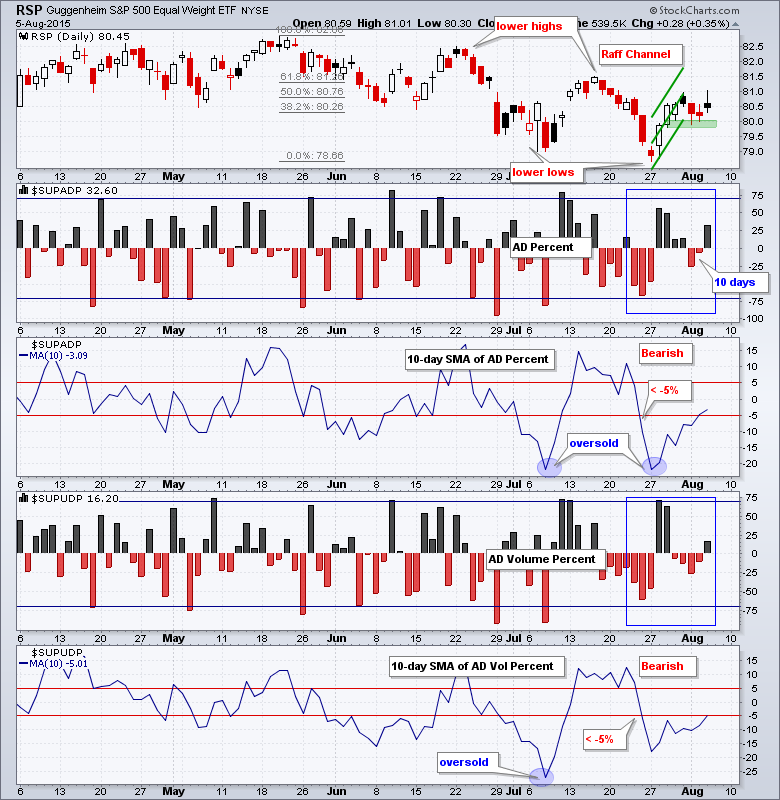
Breadth is bearish overall because both 10-day SMAs remain in negative territory. This could change quite quickly because three big down days will drop out of the 10-day SMA over the last three days. The 10-day SMA for AD Percent is at -3% and the 10-day SMA for AD Volume Percent is at -5% right now.
The sector balance has tilted to the bulls as the Equal-weight Technology ETF (RYT) broke out to turn short-term bullish. Note that RYT is the only one of the five trading above its July high. The Equal-weight Healthcare ETF (RYH) is close to the July high and in an uptrend too. The Equal-weight Finance ETF (RYF) is also in an uptrend. The Equal-Weight Consumer Discretionary ETF (RCD) remains range bound. The Equal-weight Industrials ETF (RGI) is in a downtrend and remains below the July high.
**************************************************************
**************************************************************
**************************************************************
**************************************************************
**************************************************************
**************************************************************
**************************************************************
***************************************************************
Key Reports and Events (all times Eastern):
Thu - Aug 06 - 07:30 - Challenger Job Report
Thu - Aug 06 - 08:30 - Initial Jobless Claims
Thu - Aug 06 - 10:30 - Natural Gas Inventories
Fri - Aug 07 - 08:30 - Employment Report
Wed - Aug 12 - 07:00 - MBA Mortgage Index
Wed - Aug 12 - 10:00 - JOLTS Jobs Report
Wed - Aug 12 - 10:30 - Crude Oil Inventories
Wed - Aug 12 - 14:00 - Treasury Budget
Thu - Aug 13 - 08:30 - Initial Jobless Claims
Thu - Aug 13 - 08:30 - Retail Sales
Thu - Aug 13 - 10:00 - Business Inventories
Thu - Aug 13 - 10:30 - Natural Gas Inventories
Fri - Aug 14 - 08:30 - Producer Price Index (PPI)
Fri - Aug 14 - 09:15 - Industrial Production
Fri - Aug 14 - 10:00 - Michigan Sentiment
Mon - Aug 17 - 08:30 - Empire Manufacturing
Mon - Aug 17 - 10:00 - NAHB Housing Market Index
Tue - Aug 18 - 08:30 - Housing Starts/Building Permits
Wed - Aug 19 - 07:00 - MBA Mortgage Index
Wed - Aug 19 - 08:30 - Consumer Price Index (CPI)
Wed - Aug 19 - 10:30 - Crude Oil Inventories
Wed - Aug 19 - 14:00 - FOMC Minutes
Thu - Aug 20 - 08:30 - Initial Jobless Claims
Thu - Aug 20 - 10:00 - Existing Home Sales
Thu - Aug 20 - 10:00 - Philadelphia Fed
Thu - Aug 20 - 10:00 - Leading Indicators
Thu - Aug 20 - 10:30 - Natural Gas Inventories
Tue - Aug 25 - 09:00 - Case-Shiller Housing Index
Tue - Aug 25 - 09:00 - FHFA Housing Price Index
Tue - Aug 25 - 10:00 - New Home Sales
Tue - Aug 25 - 10:00 - Consumer Confidence
Wed - Aug 26 - 07:00 - MBA Mortgage Index
Wed - Aug 26 - 08:30 - Durable Goods Orders
Wed - Aug 26 - 10:30 - Crude Oil Inventories
Thu - Aug 27 - 08:30 - Initial Jobless Claims
Thu - Aug 27 - 08:30 - GDP
Thu - Aug 27 - 10:00 - Pending Home Sales
Thu - Aug 27 - 10:30 - Natural Gas Inventories
Fri - Aug 28 - 08:30 - Personal Income & Spending
Fri - Aug 28 - 08:30 - PCE Prices
Fri - Aug 28 - 10:00 - Michigan Sentiment
Mon - Aug 31 - 09:45 - Chicago PMI
Tue - Sep 01 - 10:00 - Construction Spending
Tue - Sep 01 - 10:00 - ISM Manufacturing Index
Tue - Sep 01 - 17:00 - Auto/Truck Sales
Wed - Sep 02 - 07:00 - MBA Mortgage Purchase Index
Wed - Sep 02 - 08:15 - ADP Employment Report
Wed - Sep 02 - 10:00 - Factory Orders
Wed - Sep 02 - 10:30 - Crude Oil Inventories
Wed - Sep 02 - 14:00 - Fed's Beige Book
Thu - Sep 03 - 07:30 - Challenger Job Report
Thu - Sep 03 - 08:30 - Initial Jobless Claims
Thu - Sep 03 - 10:00 - ISM Services
Thu - Sep 03 - 10:30 - Natural Gas Inventories
Fri - Sep 04 - 08:30 - Employment Report
This commentary is designed to stimulate thinking. This analysis is not a recommendation to buy, sell, hold or sell short any security (stock ETF or otherwise). We all need to think for ourselves when it comes to trading our own accounts. First, it is the only way to really learn. Second, we are the only ones responsible for our decisions. Think of these charts as food for further analysis. Before making a trade, it is important to have a plan. Plan the trade and trade the plan. Among other things, this includes setting a trigger level, a target area and a stop-loss level. It is also important to plan for three possible price movements: advance, decline or sideways. Have a plan for all three scenarios BEFORE making the trade. Consider possible holding times. And finally, look at overall market conditions and sector/industry performance.


