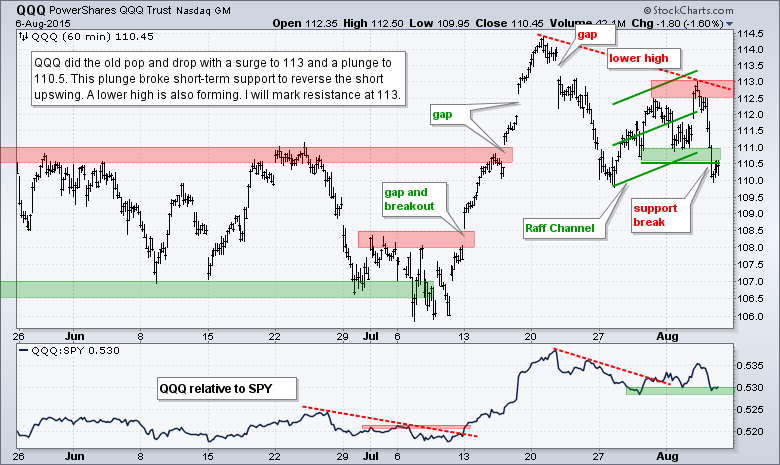
Stocks were hit with selling pressure on Thursday with QQQ leading the way lower. Actually, the Nasdaq 100 Equal-Weight ETF (QQEW) led with a 2% decline because selling pressure in the technology sector was quite broad. Healthcare and consumer discretionary, which have been leaders, also came under selling pressure. The energy and utilities sectors bucked the selling pressure. Elsewhere, Biotechs were slammed with the Biotech SPDR (XBI) falling around 5% and the Solar Energy ETF (TAN) fell 4.72%. Today is the much anticipated employment report. Heck, almost all employment reports are greatly anticipated if you follow CNBC, Bloomberg and the other media outlets that pound the drums. In the words of Mickey Blue Eyes: I say "fughetaboutit" and watch the charts.
**This chart analysis is for educational purposes only, and should not
be construed as a recommendation to buy, sell or sell-short said securities**
Short-term Overview (Friday, 7-August-2015):
- Short-term breadth is bearish overall.
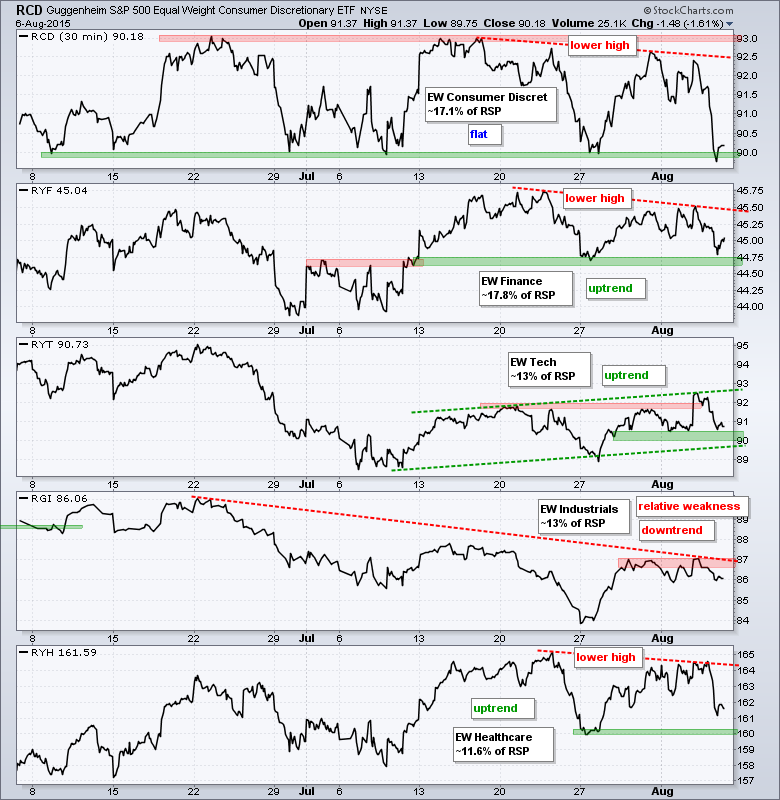
- Three of the five EW sector ETFs are in uptrends (RYT, RYH, RYF).
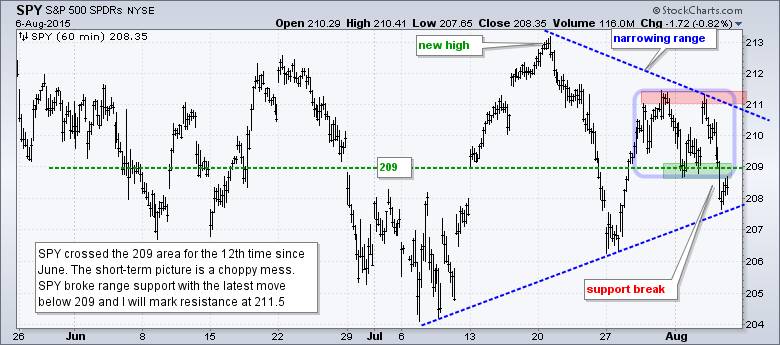
- SPY formed a lower high and broke range support.
- QQQ erased its prior surge and broke channel support.
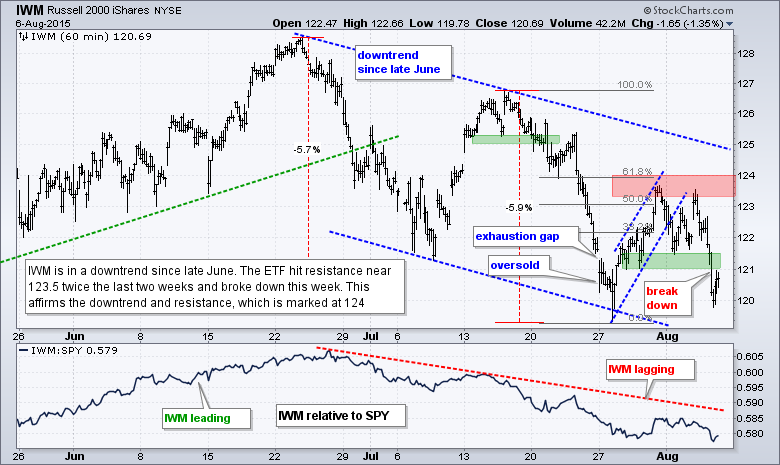
- IWM shows relative weakness with a lower high and support break.
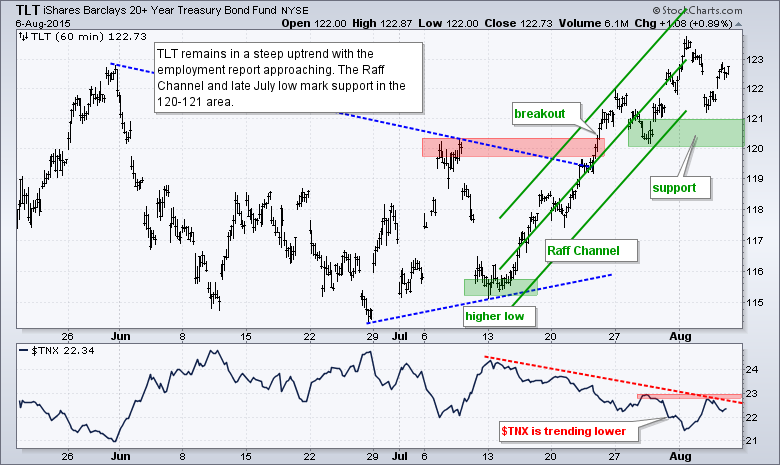
- TLT remains in an uptrend ahead of Friday's employment report.
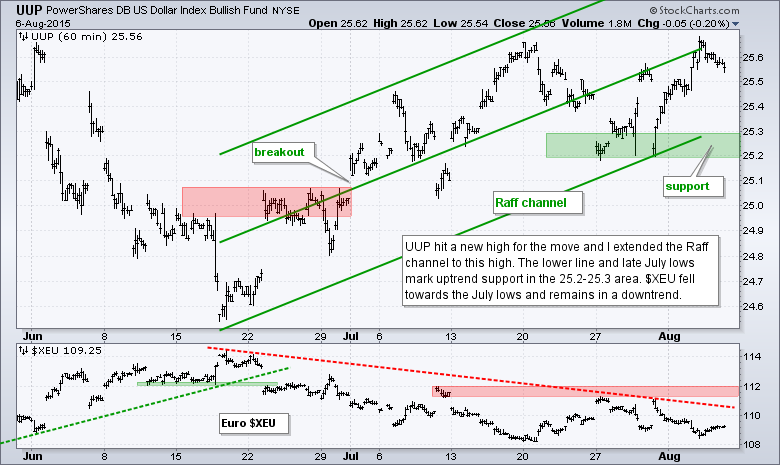
- UUP hit a new high for the move and remains in an uptrend.
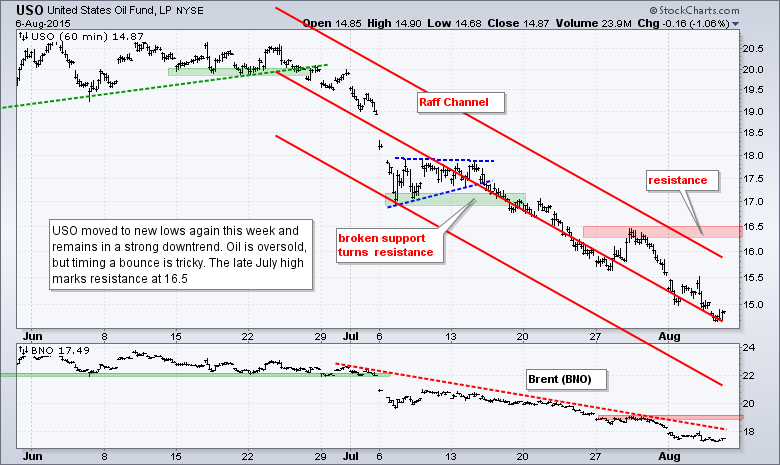
- USO is in a short-term downtrend.
- GLD is in a short-term downtrend.
RSP dipped below 80 during the day, but closed off the low to keep support alive. There is no change as I remain focused on the eight-day upswing. Overall, RSP formed lower highs and lower lows in June and July. The current bounce was from a lower low and the ETF is in the middle of its four-month range. This means RSP is in a four-month trading range at best and a two-month downtrend at worst. The Raff Regression Channel and Wednesday's low define the current upswing with support marked at 79.8. A close below this level would reverse the upswing.
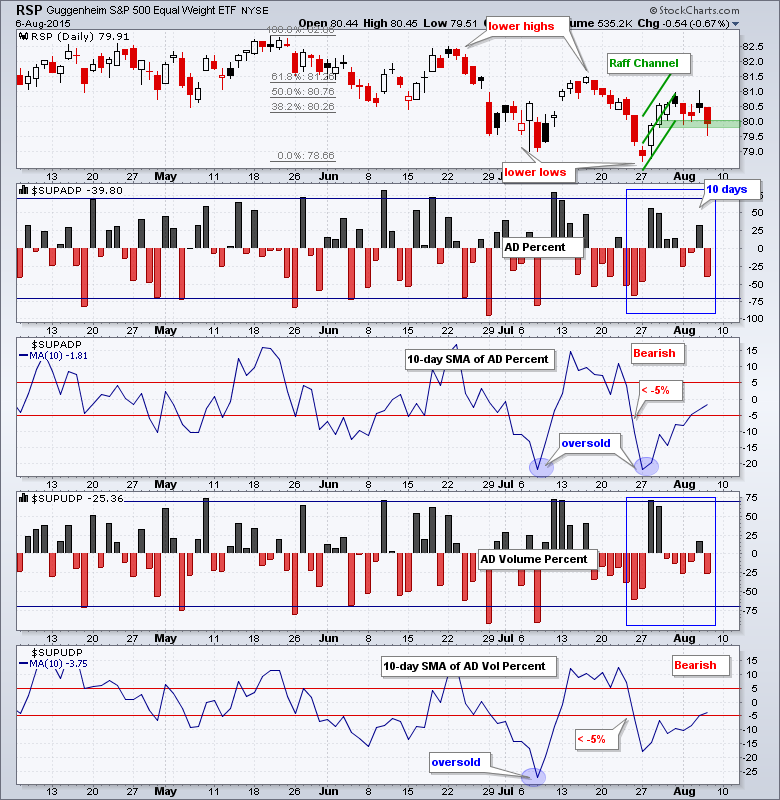
AD Percent and AD Volume Percent finished modestly negative (-40% and -25%). Selling pressure was not that intense, but breadth remains bearish overall because both 10-day SMAs are still in negative territory.
The sector balance is still net bullish, but could easily tilt towards the bears. Consumer discretionary formed a lower high and is testing support. Finance also formed a lower high and is near support from the late July low. Healthcare formed a lower high and fell sharply on Thursday. These three are in uptrends, but further weakness would reverse these uptrends and tilt the balance to the bears. Technology is the strongest sector over the last few weeks, but it also is near support. Industrials is stalling near resistance and a break above 87 would be bullish.
**************************************************************
**************************************************************
**************************************************************
**************************************************************
**************************************************************
**************************************************************
**************************************************************

***************************************************************
Key Reports and Events (all times Eastern):
Fri - Aug 07 - 08:30 - Employment Report
Wed - Aug 12 - 07:00 - MBA Mortgage Index
Wed - Aug 12 - 10:00 - JOLTS Jobs Report
Wed - Aug 12 - 10:30 - Crude Oil Inventories
Wed - Aug 12 - 14:00 - Treasury Budget
Thu - Aug 13 - 08:30 - Initial Jobless Claims
Thu - Aug 13 - 08:30 - Retail Sales
Thu - Aug 13 - 10:00 - Business Inventories
Thu - Aug 13 - 10:30 - Natural Gas Inventories
Fri - Aug 14 - 08:30 - Producer Price Index (PPI)
Fri - Aug 14 - 09:15 - Industrial Production
Fri - Aug 14 - 10:00 - Michigan Sentiment
Mon - Aug 17 - 08:30 - Empire Manufacturing
Mon - Aug 17 - 10:00 - NAHB Housing Market Index
Tue - Aug 18 - 08:30 - Housing Starts/Building Permits
Wed - Aug 19 - 07:00 - MBA Mortgage Index
Wed - Aug 19 - 08:30 - Consumer Price Index (CPI)
Wed - Aug 19 - 10:30 - Crude Oil Inventories
Wed - Aug 19 - 14:00 - FOMC Minutes
Thu - Aug 20 - 08:30 - Initial Jobless Claims
Thu - Aug 20 - 10:00 - Existing Home Sales
Thu - Aug 20 - 10:00 - Philadelphia Fed
Thu - Aug 20 - 10:00 - Leading Indicators
Thu - Aug 20 - 10:30 - Natural Gas Inventories
Tue - Aug 25 - 09:00 - Case-Shiller Housing Index
Tue - Aug 25 - 09:00 - FHFA Housing Price Index
Tue - Aug 25 - 10:00 - New Home Sales
Tue - Aug 25 - 10:00 - Consumer Confidence
Wed - Aug 26 - 07:00 - MBA Mortgage Index
Wed - Aug 26 - 08:30 - Durable Goods Orders
Wed - Aug 26 - 10:30 - Crude Oil Inventories
Thu - Aug 27 - 08:30 - Initial Jobless Claims
Thu - Aug 27 - 08:30 - GDP
Thu - Aug 27 - 10:00 - Pending Home Sales
Thu - Aug 27 - 10:30 - Natural Gas Inventories
Fri - Aug 28 - 08:30 - Personal Income & Spending
Fri - Aug 28 - 08:30 - PCE Prices
Fri - Aug 28 - 10:00 - Michigan Sentiment
Mon - Aug 31 - 09:45 - Chicago PMI
Tue - Sep 01 - 10:00 - Construction Spending
Tue - Sep 01 - 10:00 - ISM Manufacturing Index
Tue - Sep 01 - 17:00 - Auto/Truck Sales
Wed - Sep 02 - 07:00 - MBA Mortgage Purchase Index
Wed - Sep 02 - 08:15 - ADP Employment Report
Wed - Sep 02 - 10:00 - Factory Orders
Wed - Sep 02 - 10:30 - Crude Oil Inventories
Wed - Sep 02 - 14:00 - Fed's Beige Book
Thu - Sep 03 - 07:30 - Challenger Job Report
Thu - Sep 03 - 08:30 - Initial Jobless Claims
Thu - Sep 03 - 10:00 - ISM Services
Thu - Sep 03 - 10:30 - Natural Gas Inventories
Fri - Sep 04 - 08:30 - Employment Report
This commentary is designed to stimulate thinking. This analysis is not a recommendation to buy, sell, hold or sell short any security (stock ETF or otherwise). We all need to think for ourselves when it comes to trading our own accounts. First, it is the only way to really learn. Second, we are the only ones responsible for our decisions. Think of these charts as food for further analysis. Before making a trade, it is important to have a plan. Plan the trade and trade the plan. Among other things, this includes setting a trigger level, a target area and a stop-loss level. It is also important to plan for three possible price movements: advance, decline or sideways. Have a plan for all three scenarios BEFORE making the trade. Consider possible holding times. And finally, look at overall market conditions and sector/industry performance.


