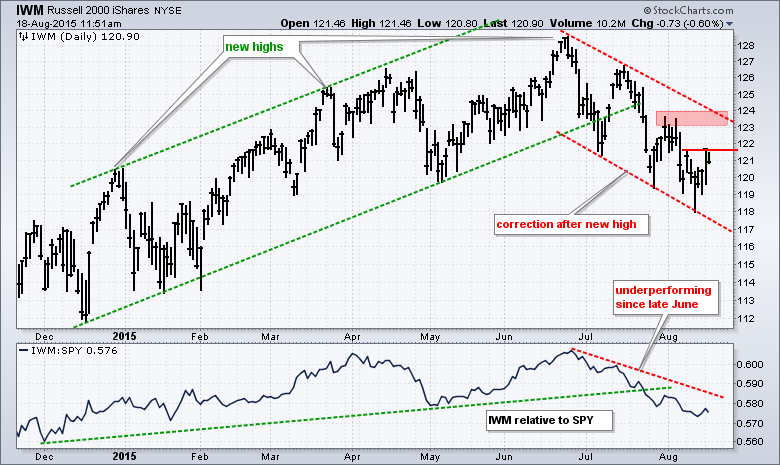
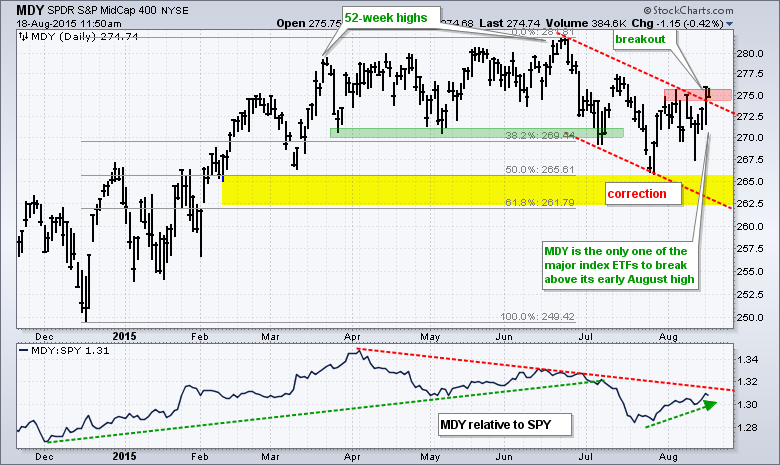
Today's webinar and commentary will take a top down look at the stock market. First, the index table with the breadth indicators shows a split market with half bullish and half bearish. The sector table, however, still tilts towards the bulls with five of the nine sectors in bull mode. This means upward drift is the expectation and this fits with the uptrends in QQQ and SPY. IWM is still in a downtrend as small-caps lag, but MDY is perking up with a breakout. After this broad market overview, I will then look at some individual sector ETFs, industry group ETFs and over a dozen individual stocks. Click here for the webinar recording.

Click here for the webinar recording.
Index Table Remains Split
The indicator table for the major indices is split, literally. There are 12 red boxes (bearish) and 12 green boxes (bullish). This, of course, accurately reflects the trading range in the overall market. SPY and QQQ show more strength overall and both remain net bullish on the table. Notice that the 60-day EMA for S&P 500 AD Percent ($SPXADP) moved above +3% on Tuesday to turn bullish (blue oval). This means we are seeing some strength in the AD Line. MDY and IJR are net bearish because more boxes are red than green.
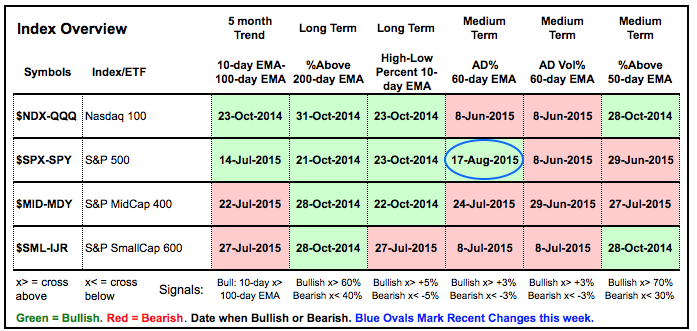
Mid-cap Breadth Improves
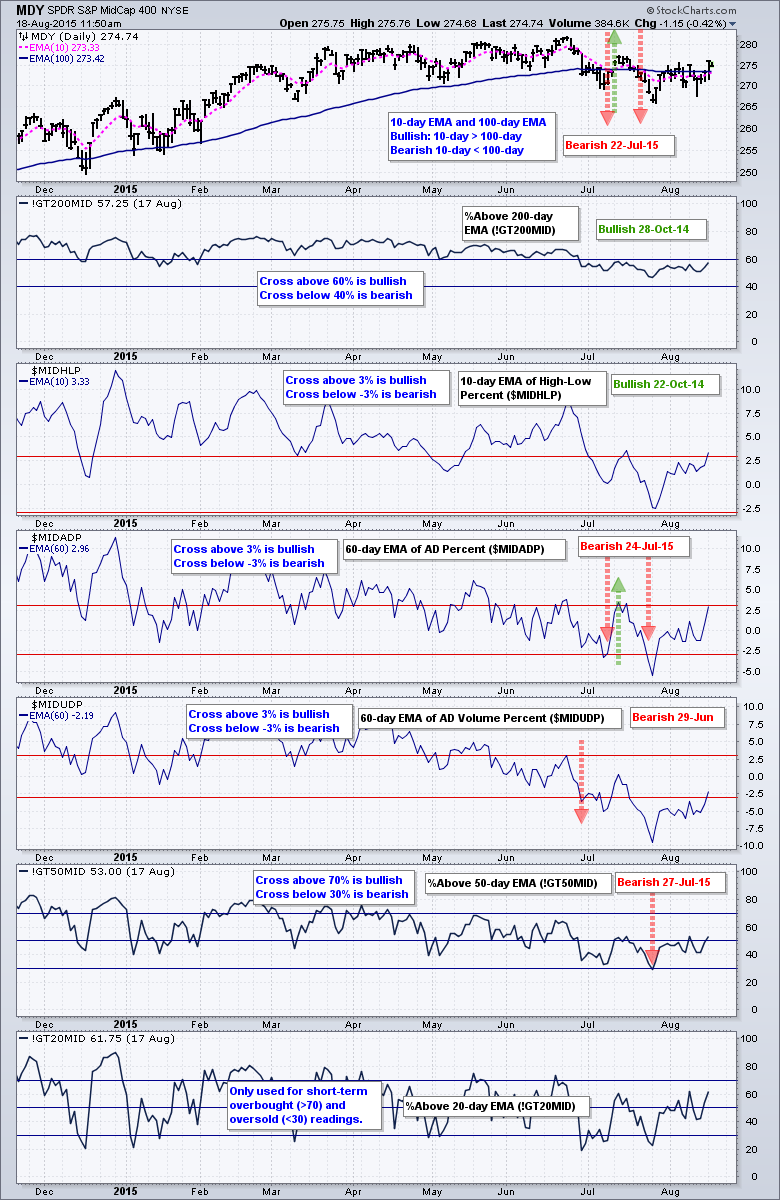
Mid-cap breadth is improving though. The 60-day EMA of S&P 400 AD Percent ($MIDADP) is at +2.96% and it would not take much to turn it positive. Also note that the 10-day EMA for S&P 400 HiLo% ($MIDHLP) is the highest of the four (+3.33%). I am seeing relative strength in MDY over the last few weeks as the ETF formed a higher low from late July to mid August and closed above its early August high on Monday. Also note that the S&P MidCap Growth iShares (IJK) hit a new high on Monday.
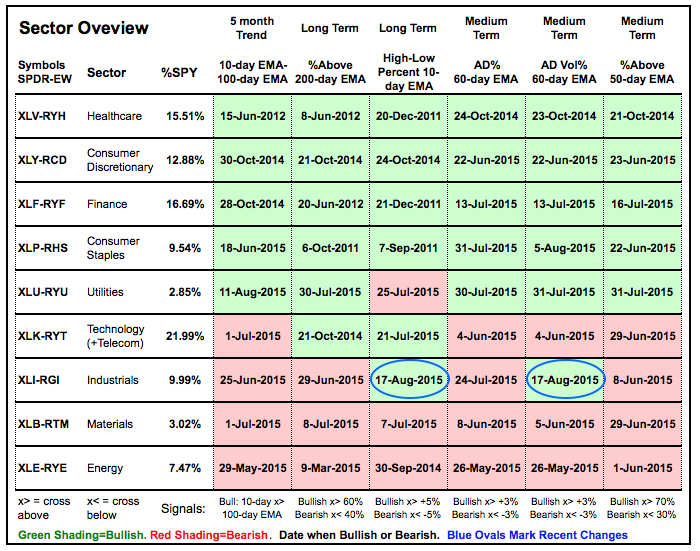
Sector Table Favors the Bulls
The sector table is also split, but there is more green (bullishness) than red (bearishness). First, note that healthcare, consumer discretionary, finance and consumer staples are completely bullish and show no signs of bearishness. These four sectors account for around 54% of the S&P 500. Throw in utilities and clearly more than half of the "stock market" is still bullish. There are, of course, some pockets of serious weakness and the technology sector is net bearish. Materials and energy are by far the weakest sectors and have been for months. The industrials sector improved this week as the 10-day EMA for High-Low Percent moved above +3% and the 60-day EMA for AD Percent also moved above +3%. Even with two green boxes, the industrials sector is still net bearish with four red boxes.
MDY Goes for a Break Out
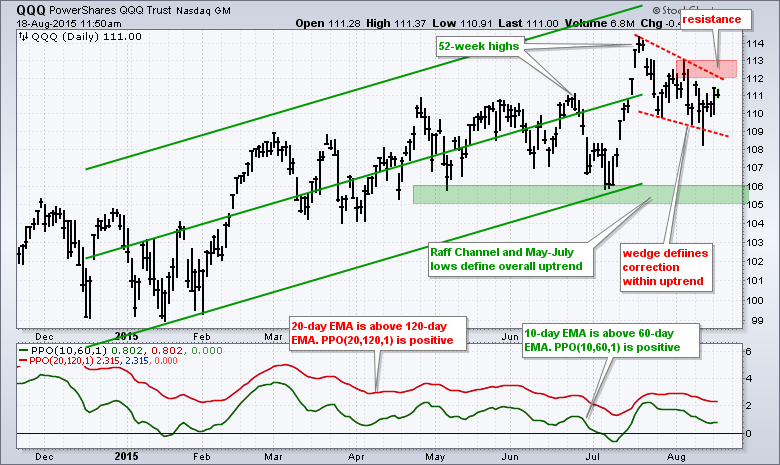
The Russell 2000 iShares (IWM) and S&P MidCap SPDR (MDY) peaked with new highs in late June and corrected over the last two months. QQQ and SPY peaked with new highs in mid July and corrected over the last four weeks. IWM and MDY are weaker because they peaked before SPY and QQQ. Three of the four are in downtrends the last 1-2 months and chartists need to watch resistance for breakouts that would signal an end to these corrections. Note that MDY broke out on Tuesday and is starting to lead.
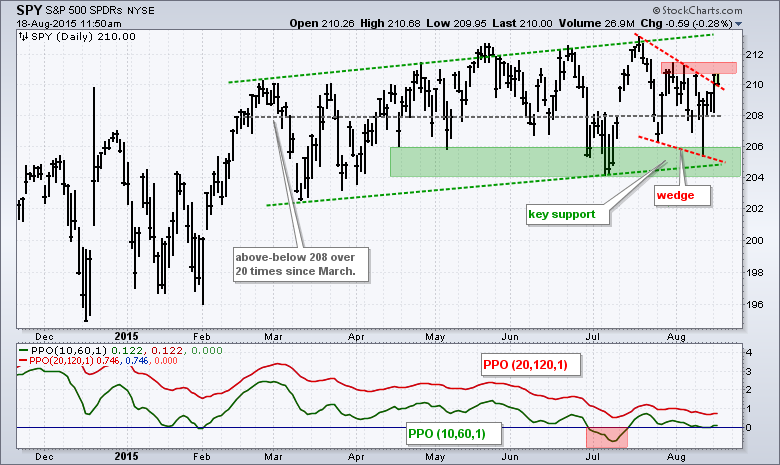
So the broad market table is mixed, but the sector table is net bullish (but also mixed). The market as a whole has become more selective over the last six months, but the selectivity is not such that the majority of the market is bearish. This selectivity, however, makes it important to be in the right sector, industry group or stock.
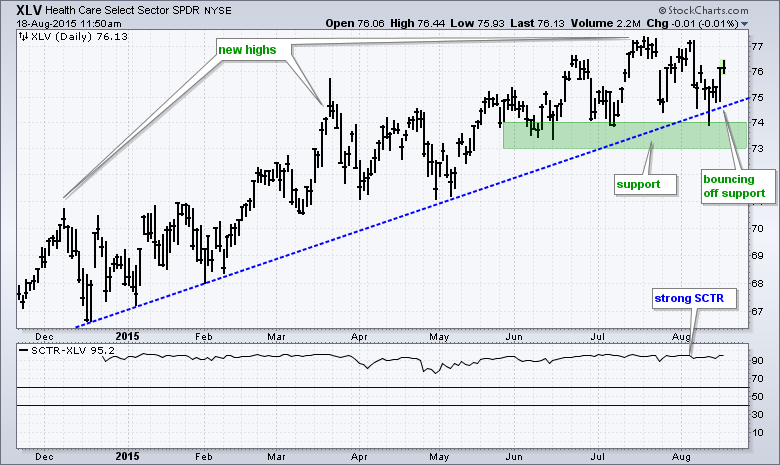
Managed Healthcare Leads XLV Bounce
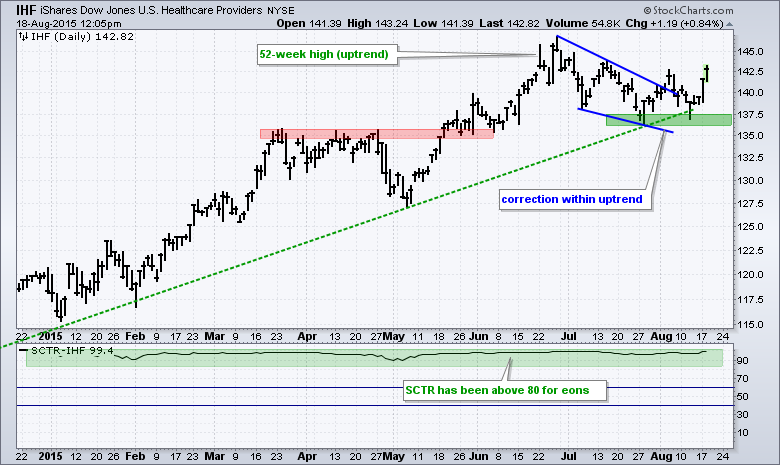
When the trend is up, I am generally looking for corrections and trying to find an ETF or stock that has a good chance of hitting a new high. The HealthCare SPDR (XLV) has been one of the strongest SPDRs this year and remains in an uptrend. The chart below shows XLV getting a bounce off support from the June-July lows. It would not take much to push this one to new highs again. The second chart shows the HealthCare Providers ETF (IHF) hitting a 52-week high in late June and then correcting into late July. The ETF broke above the wedge trend line in early August, fell back to test the last July low and surged back above 140 this week. The breakout remains valid and bullish.
Consumer Discretionary Holds Support
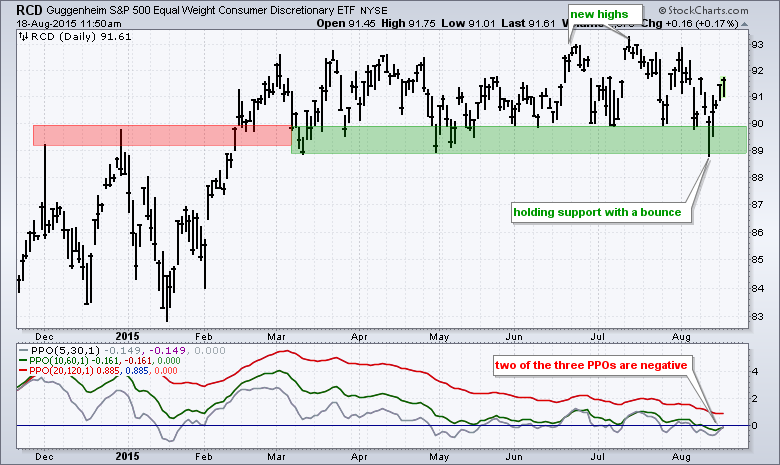
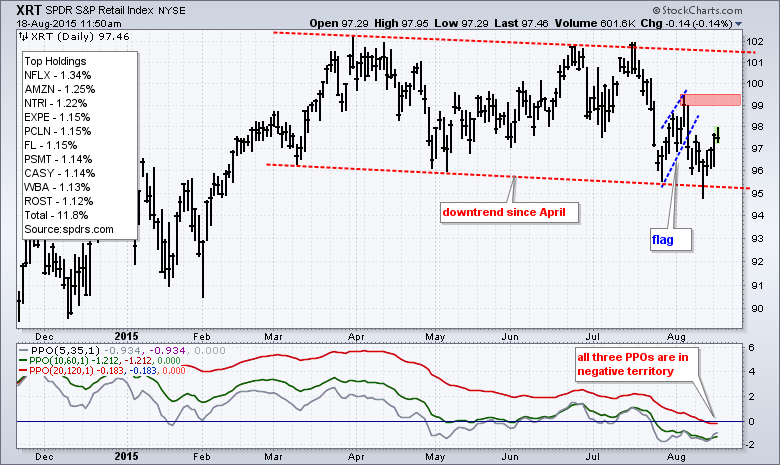
Admittedly, the consumer discretionary sector is a bit of a conundrum. The Consumer Discretionary SPDR (XLY) is in a clear uptrend with new highs in early August, but the Equal-Weight Consumer Discretionary ETF (RCD) is range bound. This sector is perhaps my biggest potential concern right now. I say "potential" because it has yet to actually break down. RCD did hit a new high in mid July and did hold support with a bounce over the last few days. Even though the ETF has gone nowhere since March, it has yet to go down and has yet to break support. Retail is weighing on the consumer discretionary sector because the Retail SPDR (XRT) remains in a downtrend since early April and all three PPOs are in negative territory.
Thanks for tuning in and have a great day!
--Arthur Hill CMT (twitter: @ArthurHill)


