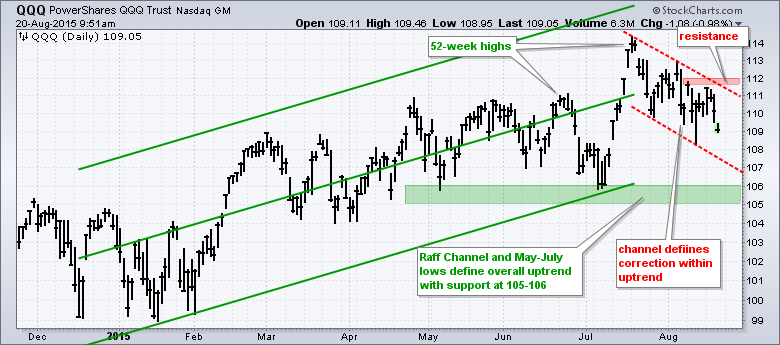
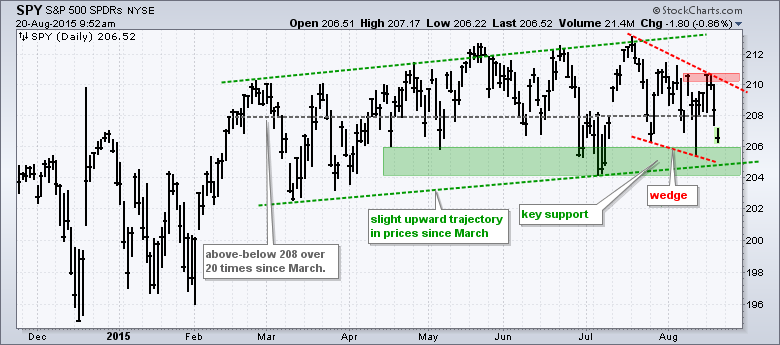
The major index ETFs remain in corrective mode, but two of the four are close to breaking long-term support levels. The challenge with corrections is we never know which corrections will evolve into bigger downtrends. As the charts now stand, QQQ and SPY hit new highs in mid July and then fell the last four weeks. This means we have multi-month uptrends and four week downtrends. From high to correction low, QQQ has fallen less than 6% and SPY has fallen less than 4%. Such declines hardly qualify as bear markets. With the decline over the last two days, I lowered resistance to 112 for QQQ and 211 for SPY.
A Head-and-Shoulders Reversal for RSP?
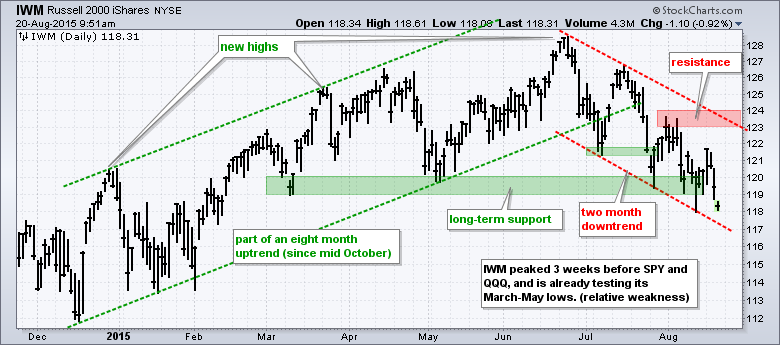
The real trouble is visible in the Russell 2000 iShares (IWM) and the Equal-Weight S&P 500 ETF (RSP). Both peaked before SPY and QQQ, and both show relative weakness (IWM since late June and RSP since April). IWM is in a downtrend since late June with lower lows and lower highs. The ETF is now testing support in the 119-120 area, a break of which would be long-term bearish. I am marking downtrend resistance in the 123-124 area.
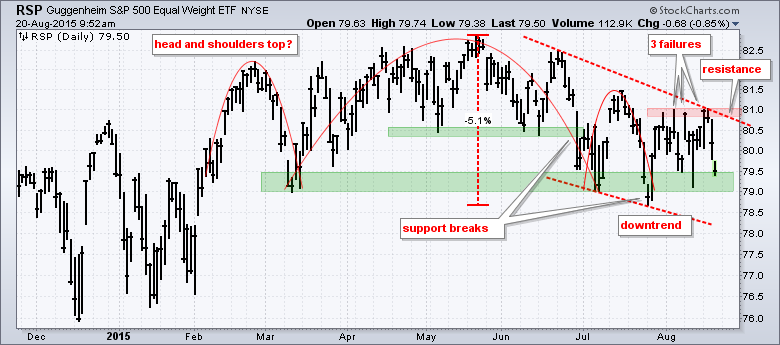
A head-and-shoulders top is brewing in the EW S&P 500 ETF (RSP). Notice that the ETF has a large consolidation pattern from February to August (seven months). This is long enough to suggest a distribution or topping pattern at work. Neckline support of this head-and-shoulders pattern is set in the 79-79.5 area. RSP already broke this level in late July, but rebounded with a surge to 81. Resistance at 81 is proving tough as the ETF failed at this level three times. By the way, note that this head-and-shoulders is not very big because it extends just 5% from high to low.
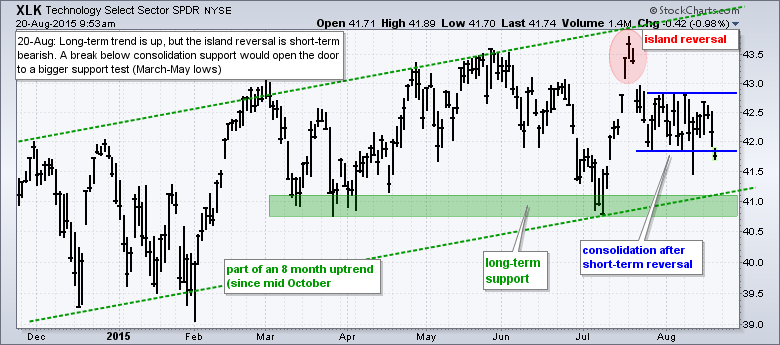
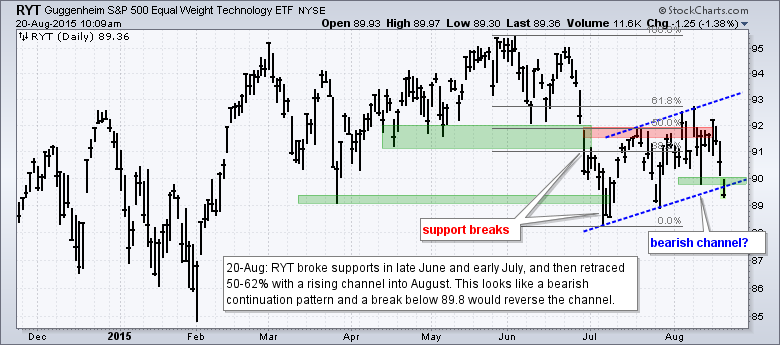
Technology Sector Weakens Further
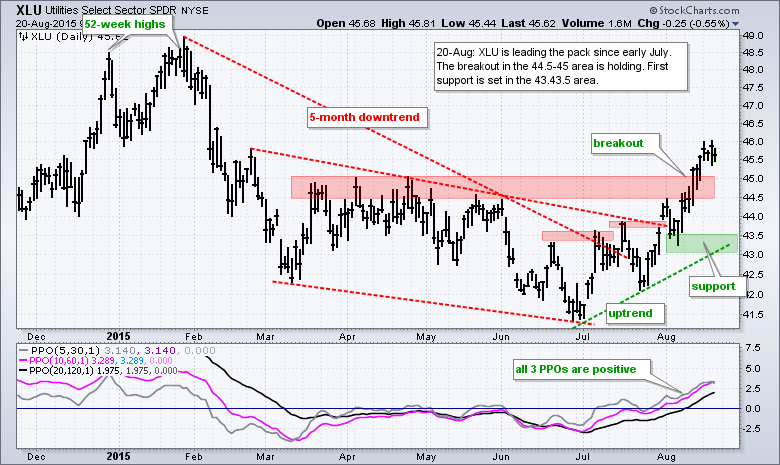
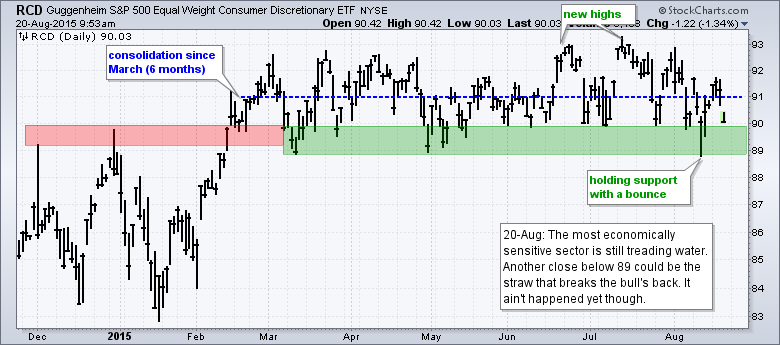
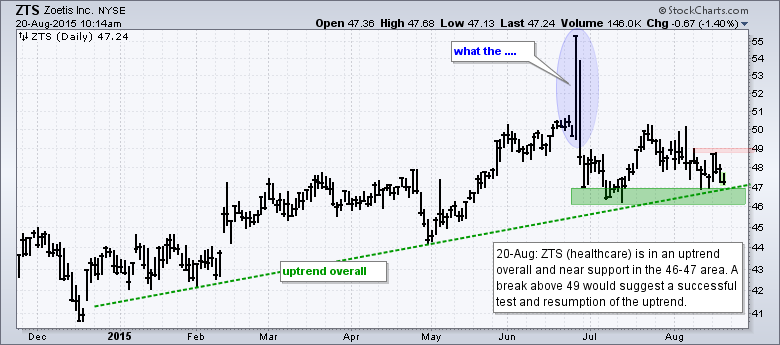
There are clearly some weak areas in the stock market, but there are also some strong areas and the sectors are split overall. Looking at the charts, consumer discretionary (XLY/RCD), finance (XLF/RYF), healthcare (XLV/RYH) and Consumer staples (XLP/RYH) have yet to break down and remain in uptrends. Utilities (XLU/RYU) recently moved into an uptrend with a breakout last week. This leaves downtrends for industrials (XLI/RGI), energy (XLE/RYE) and materials (XLB/RTM). I am also net bearish on the technology sector (XLK/RYT), but there are some pockets of strength here (software, internet).
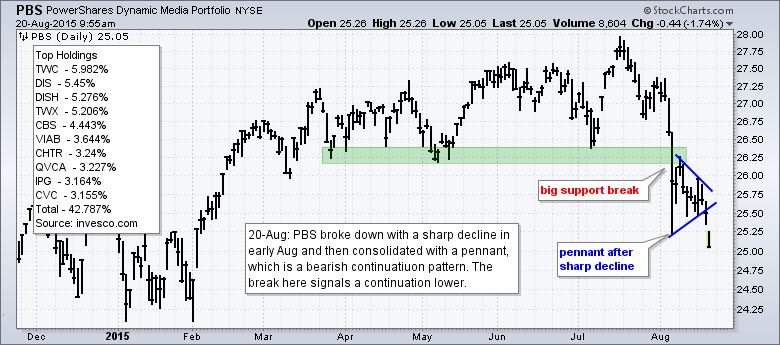
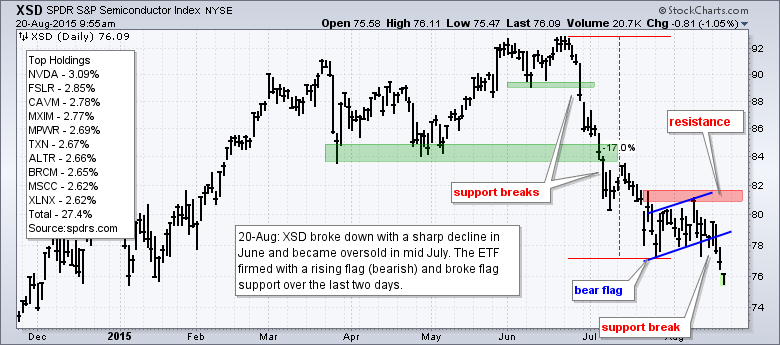
Second Shoes Drop for Media and Semiconductors
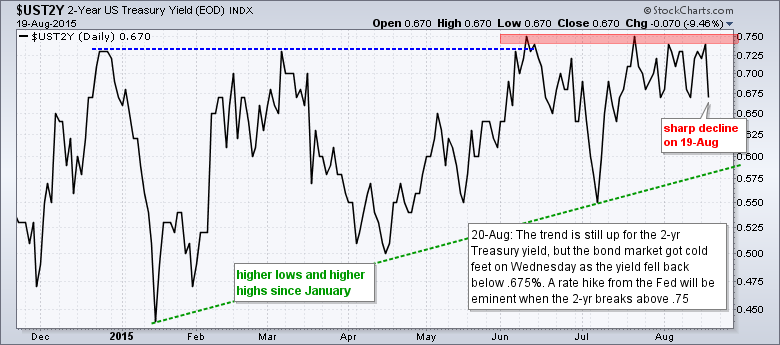
2-Yr Treasury Yield Hits a Wall
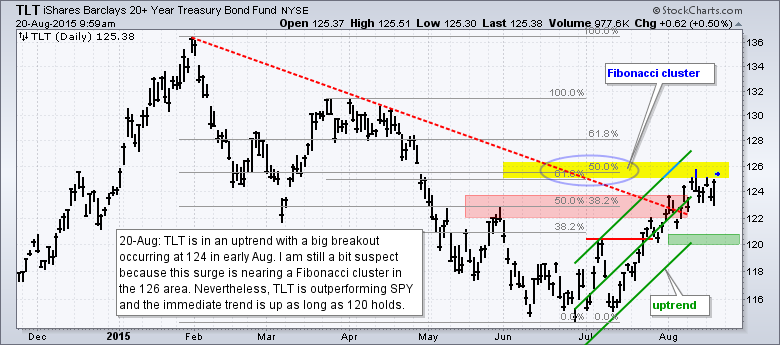
The bond market has been on a wild ride lately because the of the on again-off again rate hike from the Fed. Should we really be concerned about a move from zero to 25 basis points? It is not as if the Fed is going to raise the Fed Funds rate from 3% to 3.5%. We are just talking about a move from zero interest rate policy to almost zero interest rate policy. Turn off the TV and watch the charts!
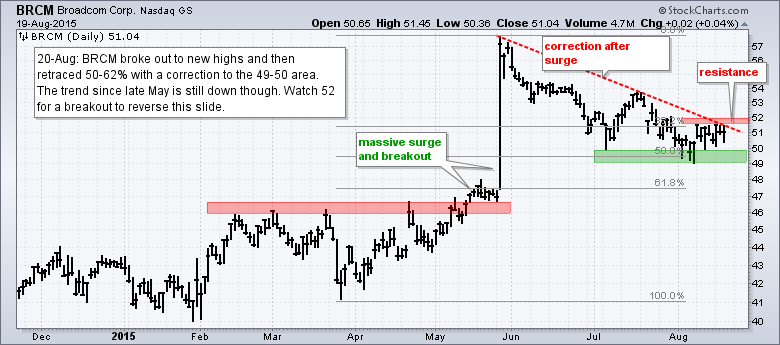
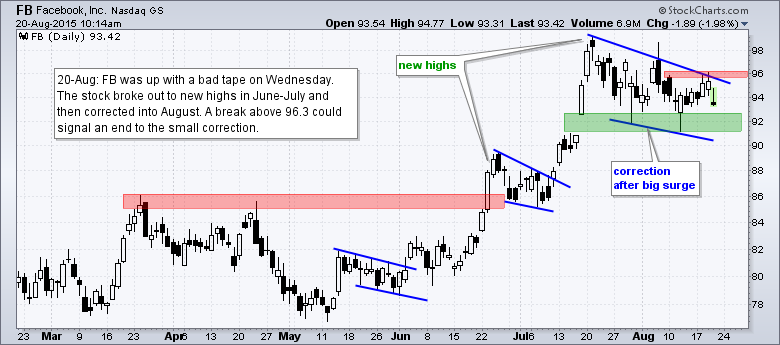
BroadCom Hits Retracement Zone as Facebook Corrects
**************************************************************
Thanks for tuning in and have a great day!
Arthur Hill CMT


