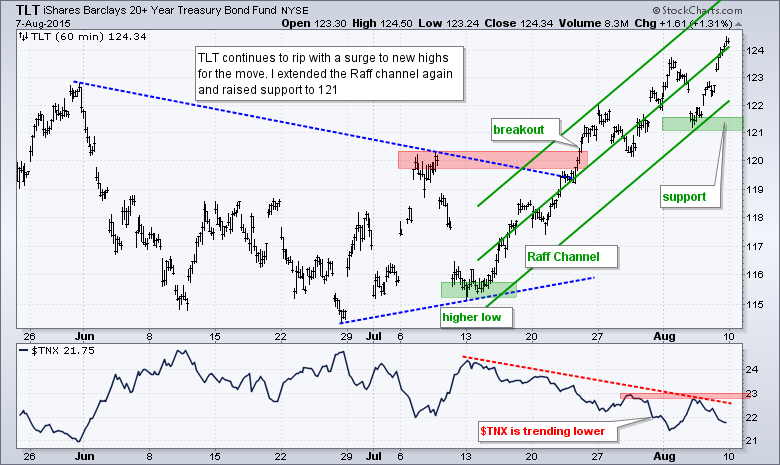
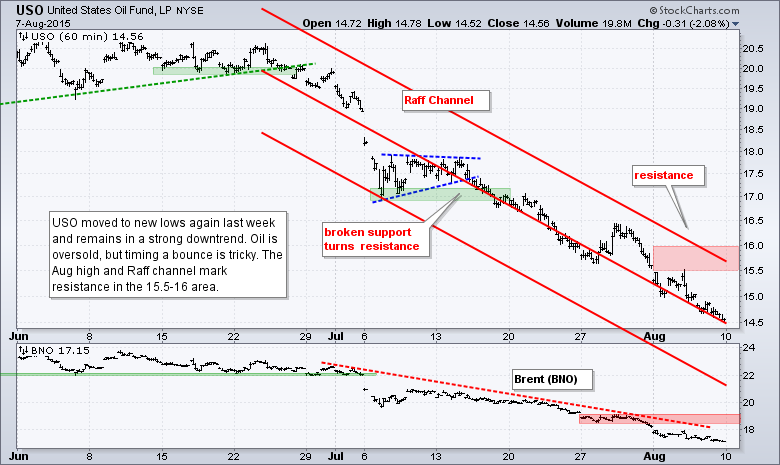
Stocks were hit with selling pressure last week, but it was not that intense. QQQ lost 1.5%, SPY declined 1.2% and IWM was down 2.5%. Small-caps remain relatively weak and continue to lead on the way down. Also note that the Equal-Weight S&P 500 ETF (RSP) has been trending lower for two months now. Eight of the nine sectors were down. Finance and consumer staples held up the best with the smallest declines. Utilities bucked the selling pressure and gained as the 10-YR Treasury Yield ($TNX) fell below 2.2%. The 20+ YR T-Bond ETF (TLT) hit a new high for the move as money continued moving into bonds. TLT is up over 7% from its mid July low and the CRB index is down over 9% from its mid July high. Clearly a negative correlation is at work between bonds and commodities right now.
**This chart analysis is for educational purposes only, and should not
be construed as a recommendation to buy, sell or sell-short said securities**
Short-term Overview (Monday, 10-August-2015):
- Short-term breadth is bearish overall.
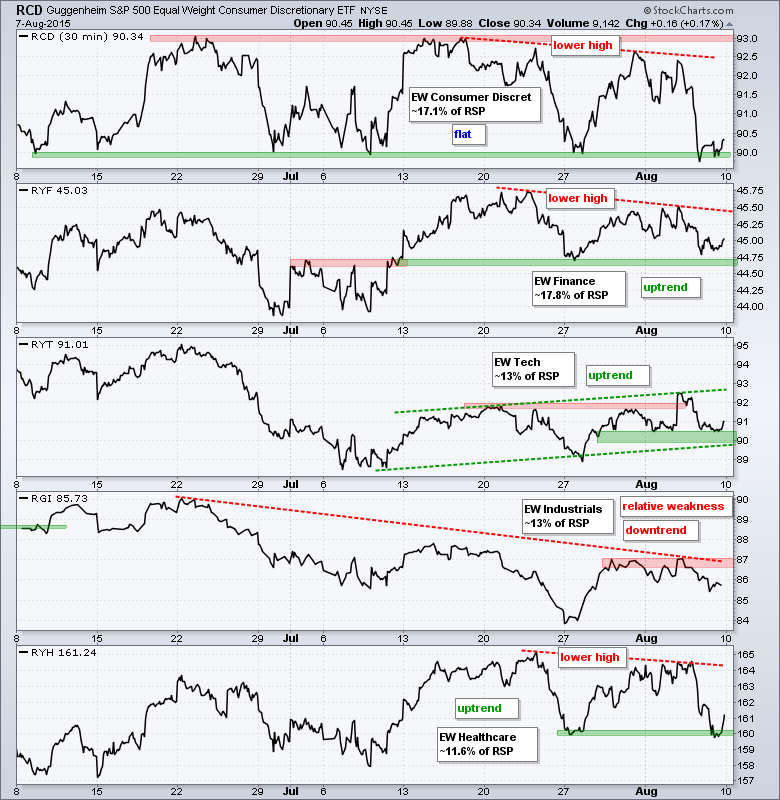
- Three of the five EW sector ETFs are in uptrends (RYT, RYH, RYF).
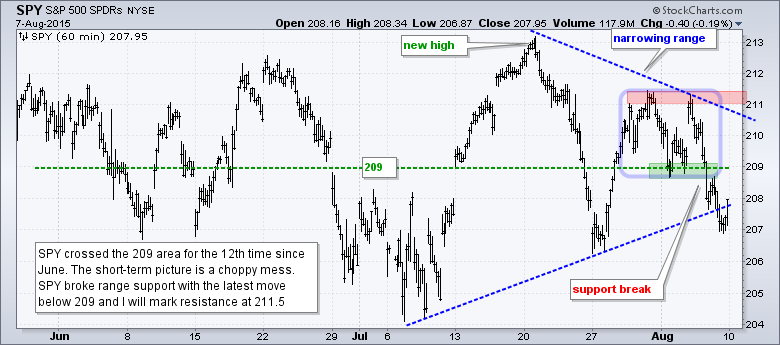
- SPY formed a lower high and broke range support last week.
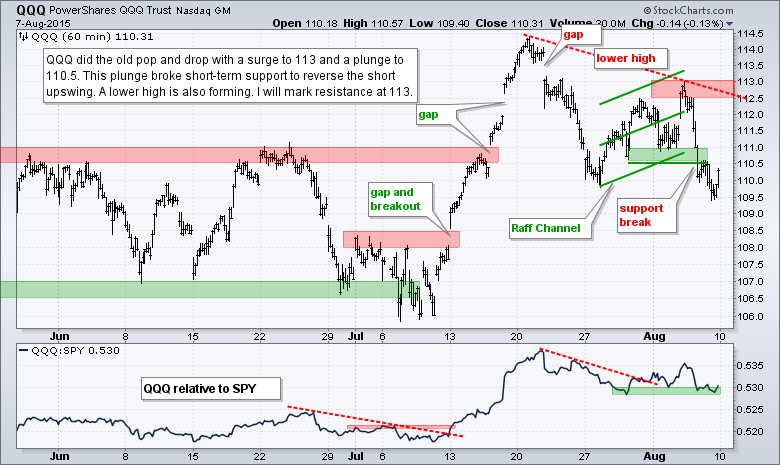
- QQQ erased its prior surge and broke channel support last week.
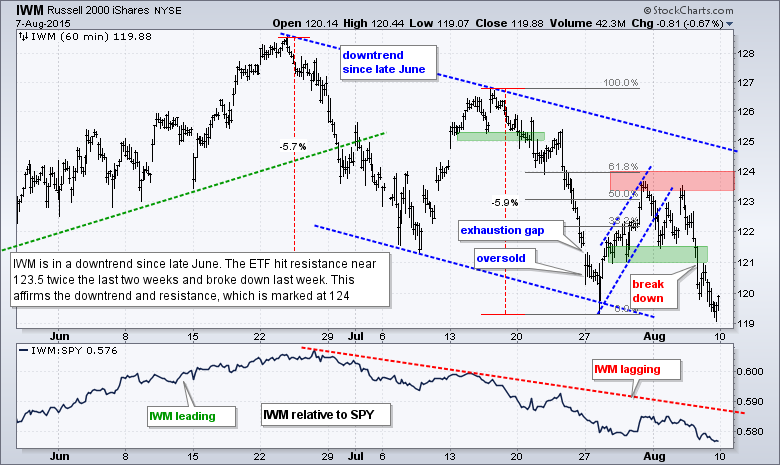
- IWM shows relative weakness with a lower high and support break.
- TLT remains in an uptrend with another new high for the move.
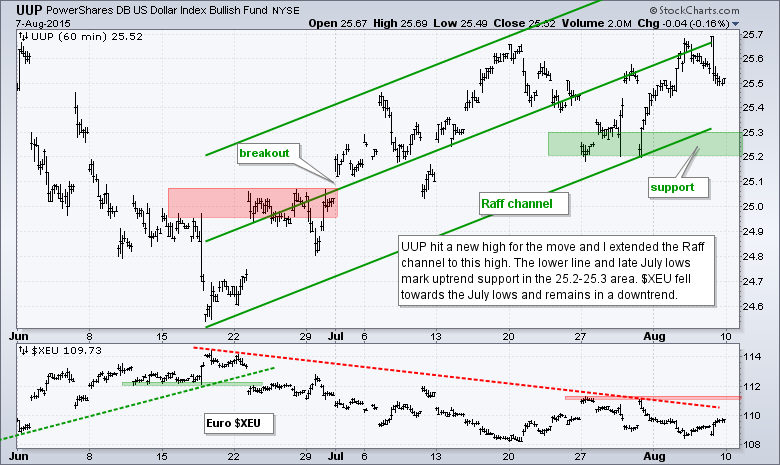
- UUP hit a new high for the move and remains in an uptrend.
- USO is in a short-term downtrend.
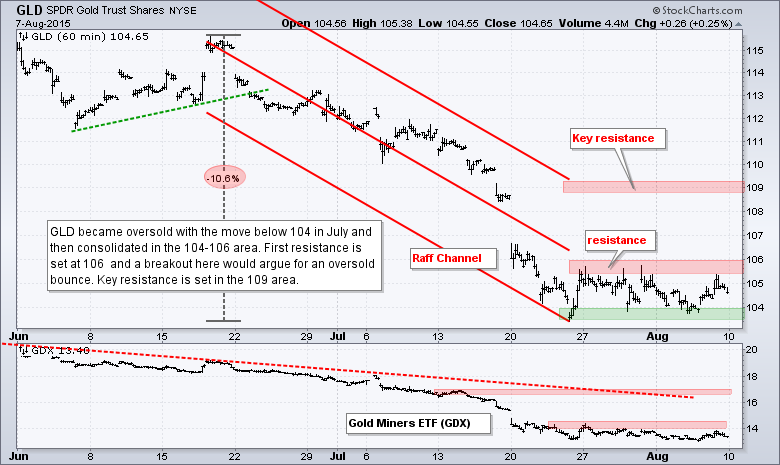
- GLD is in a short-term downtrend.
RSP surged at the end of July, hit resistance near 81 and declined in early August. The six day decline is not drastic, but we have yet to see follow through to the two-day surge on July 28th and 29th. A short Raff Regression Channel defines this descent with resistance marked at 81. Also note that RSP is trading in the lower half of the May-August range with lower highs and lower lows since mid June. There is a downtrend present over the last two months.
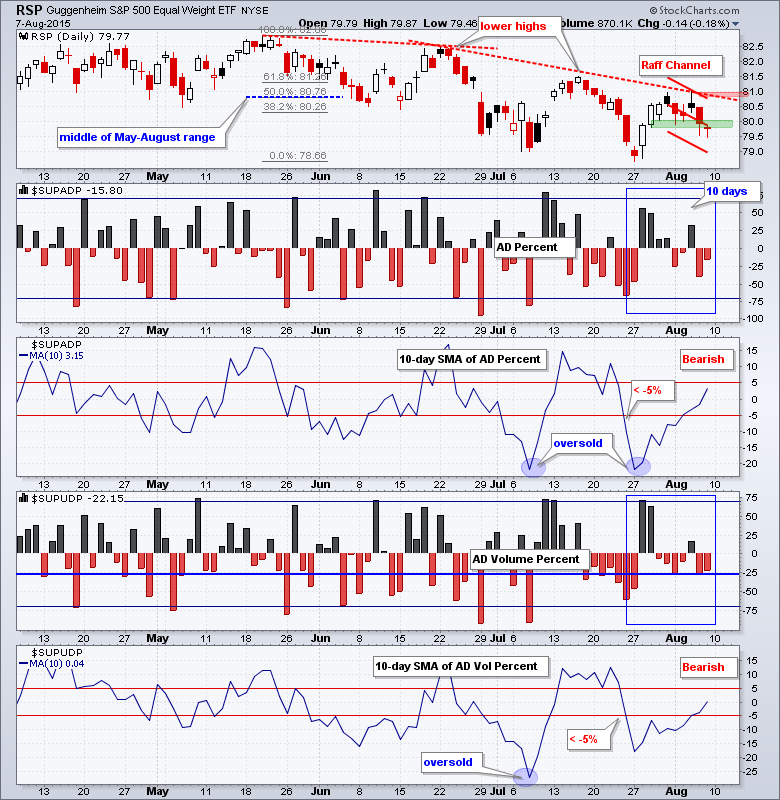
AD Percent and AD Volume Percent finished slightly negative. Again, selling pressure the last six-seven days has not been very intense. Note that breadth surged on 28 and 29 July, but readings since have been between +35% and -40%. Breadth has been indecisive on both the upside and downside this month. Overall, the 10-day SMAs for AD Percent and AD Volume Percent remain below +5% and bearish.
The sector balance is still net bullish, but support levels are being tested. Consumer discretionary is range bound and testing support from the June-July lows. Finance formed a lower high and is near support from the late July low. Healthcare also formed a lower high and tested support from the July low. Breakdowns in two of the three would tilt the balance towards the bears. Technology is the strongest right now because the early August high exceeded the late July high. Industrials remains the weakest.
**************************************************************
**************************************************************
**************************************************************
**************************************************************
**************************************************************
**************************************************************
**************************************************************
***************************************************************
Key Reports and Events (all times Eastern):
Wed - Aug 12 - 07:00 - MBA Mortgage Index
Wed - Aug 12 - 10:00 - JOLTS Jobs Report
Wed - Aug 12 - 10:30 - Crude Oil Inventories
Wed - Aug 12 - 14:00 - Treasury Budget
Thu - Aug 13 - 08:30 - Initial Jobless Claims
Thu - Aug 13 - 08:30 - Retail Sales
Thu - Aug 13 - 10:00 - Business Inventories
Thu - Aug 13 - 10:30 - Natural Gas Inventories
Fri - Aug 14 - 08:30 - Producer Price Index (PPI)
Fri - Aug 14 - 09:15 - Industrial Production
Fri - Aug 14 - 10:00 - Michigan Sentiment
Mon - Aug 17 - 08:30 - Empire Manufacturing
Mon - Aug 17 - 10:00 - NAHB Housing Market Index
Tue - Aug 18 - 08:30 - Housing Starts/Building Permits
Wed - Aug 19 - 07:00 - MBA Mortgage Index
Wed - Aug 19 - 08:30 - Consumer Price Index (CPI)
Wed - Aug 19 - 10:30 - Crude Oil Inventories
Wed - Aug 19 - 14:00 - FOMC Minutes
Thu - Aug 20 - 08:30 - Initial Jobless Claims
Thu - Aug 20 - 10:00 - Existing Home Sales
Thu - Aug 20 - 10:00 - Philadelphia Fed
Thu - Aug 20 - 10:00 - Leading Indicators
Thu - Aug 20 - 10:30 - Natural Gas Inventories
Tue - Aug 25 - 09:00 - Case-Shiller Housing Index
Tue - Aug 25 - 09:00 - FHFA Housing Price Index
Tue - Aug 25 - 10:00 - New Home Sales
Tue - Aug 25 - 10:00 - Consumer Confidence
Wed - Aug 26 - 07:00 - MBA Mortgage Index
Wed - Aug 26 - 08:30 - Durable Goods Orders
Wed - Aug 26 - 10:30 - Crude Oil Inventories
Thu - Aug 27 - 08:30 - Initial Jobless Claims
Thu - Aug 27 - 08:30 - GDP
Thu - Aug 27 - 10:00 - Pending Home Sales
Thu - Aug 27 - 10:30 - Natural Gas Inventories
Fri - Aug 28 - 08:30 - Personal Income & Spending
Fri - Aug 28 - 08:30 - PCE Prices
Fri - Aug 28 - 10:00 - Michigan Sentiment
Mon - Aug 31 - 09:45 - Chicago PMI
Tue - Sep 01 - 10:00 - Construction Spending
Tue - Sep 01 - 10:00 - ISM Manufacturing Index
Tue - Sep 01 - 17:00 - Auto/Truck Sales
Wed - Sep 02 - 07:00 - MBA Mortgage Purchase Index
Wed - Sep 02 - 08:15 - ADP Employment Report
Wed - Sep 02 - 10:00 - Factory Orders
Wed - Sep 02 - 10:30 - Crude Oil Inventories
Wed - Sep 02 - 14:00 - Fed's Beige Book
Thu - Sep 03 - 07:30 - Challenger Job Report
Thu - Sep 03 - 08:30 - Initial Jobless Claims
Thu - Sep 03 - 10:00 - ISM Services
Thu - Sep 03 - 10:30 - Natural Gas Inventories
Fri - Sep 04 - 08:30 - Employment Report
This commentary is designed to stimulate thinking. This analysis is not a recommendation to buy, sell, hold or sell short any security (stock ETF or otherwise). We all need to think for ourselves when it comes to trading our own accounts. First, it is the only way to really learn. Second, we are the only ones responsible for our decisions. Think of these charts as food for further analysis. Before making a trade, it is important to have a plan. Plan the trade and trade the plan. Among other things, this includes setting a trigger level, a target area and a stop-loss level. It is also important to plan for three possible price movements: advance, decline or sideways. Have a plan for all three scenarios BEFORE making the trade. Consider possible holding times. And finally, look at overall market conditions and sector/industry performance.


