Cash Outperforms Defensive Sectors
Correlations rise when the major stock indices are in downtrends. In addition, the deeper and sharper the decline, the higher the positive correlation among stocks. This means there are few places to hide when the stock market turns down. Healthcare, consumer staples and utilities are traditionally defensive sectors, but we have already seen a big breakdown in the healthcare sector. Despite this breakdown, the PerfChart below shows that the Equal-weight Healthcare ETF (RYH) is still the second best performing equal-weight sector year-to-date. This is because it is down the least of the eight sectors that are down year-to-date.
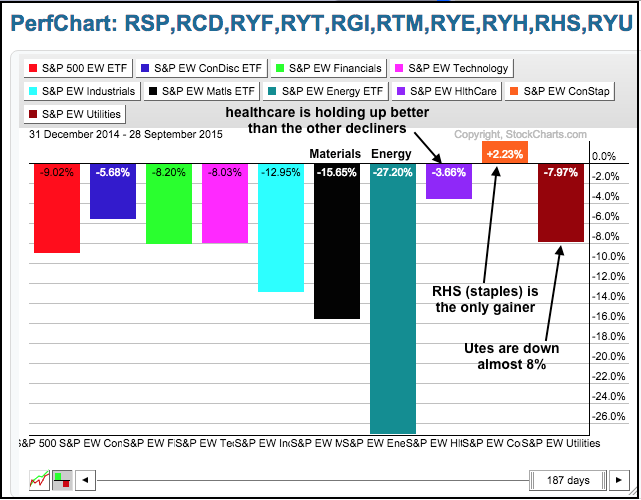
Utilities and consumer staples are holding up better than most other sectors in September, but both are in downtrends after the August breakdowns. Even with dividend-adjusted data, the Equal-weight Utilities ETF (RYU) is down over 7% year-to-date. The Equal-weight Consumer Staples ETF (RHS) is the only equal-weight sector that is still positive year-to-date. Looking at this sector performance, it is clear that cash is a real alternative to equities when the broad market trend turns down.
Inverse S&P 500 ETF Nears August High
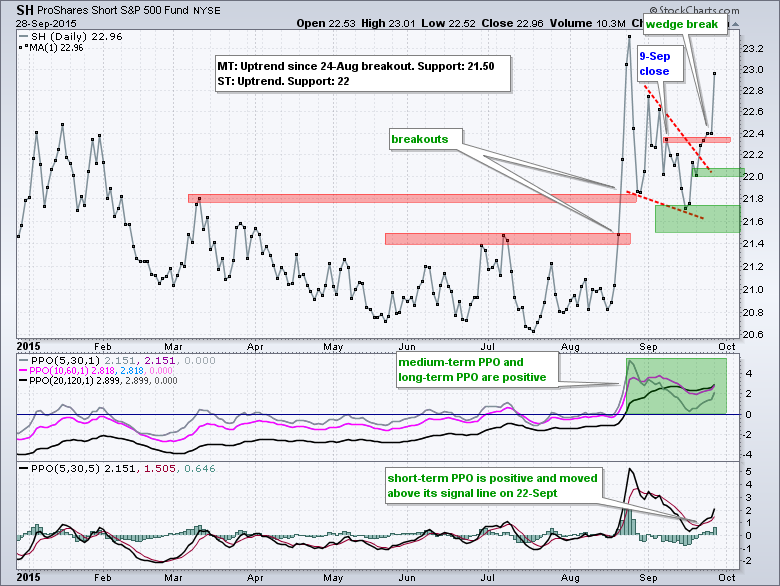
With the broad stock market in a downtrend, traders and investors must look outside of equities or turn to inverse ETFs for alternatives. As noted before, counter-trend rallies in a downtrend can be sharp and this makes it difficult to trade the short side of the market. I am not even going to get into leveraged ETFs because leverage is a double-edged sword. As noted last week, the ProShares Short S&P 500 ETF (SH) is about as plain vanilla as inverse ETFs get. It is liquid, it tracks the S&P 500 (inverse) and its chart is not skewed by leverage. On the price chart below, SH broke out by closing above its 9-Sept close on Thursday. A bullish momentum signal foreshadowed the breakout when the PPO (5,30,5) moved above its signal line on 22-Sept. Keep in mind that momentum signals occur more often than breakouts and not all momentum signals result in big moves. This short-term momentum signal, however, was in harmony with the bigger uptrend because the long-term and medium-term PPOs were already in bull mode (positive since late August). I am marking short-term support at 22 and long-term support at 21.5.
Bonds, Euro and Gold Outperform Stocks
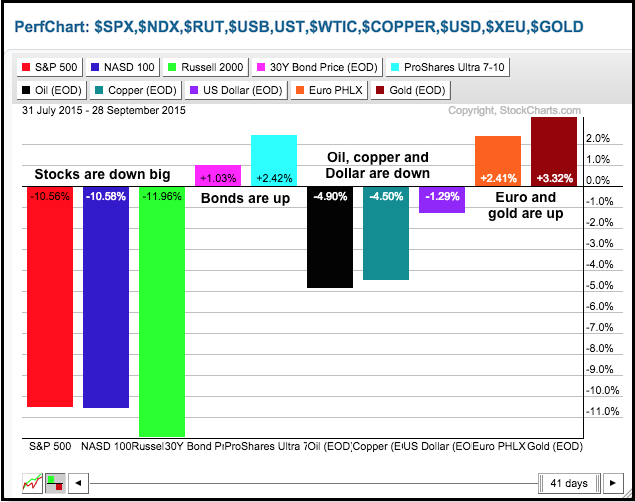
PerfChart XX shows the performance for ten inter-market securities since early August. I picked early August because this is right before the stock market breakdown and we can clearly see what is weak and what is holding up. Stocks are clearly weak with the S&P 500, Nasdaq 100 and Russell 2000 down over 10%. Bonds are holding up because the 30-yr and 10-yr Treasury bonds show small gains. At the other end of the chart, the Euro and gold are up. Oil, copper and the Dollar are down. This tells us that money moved into bonds, the Euro and gold over the last two months.
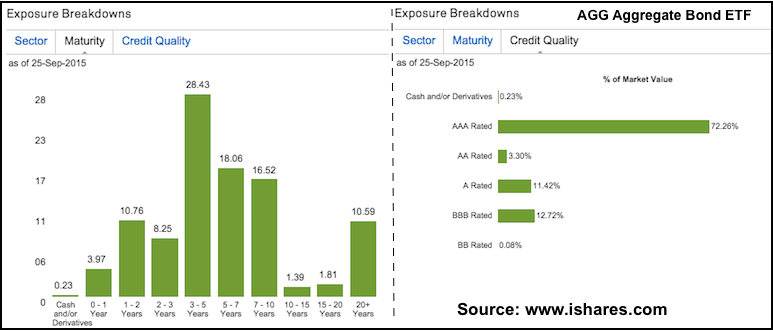
Aggregate Bond ETF Struggles at Breakout
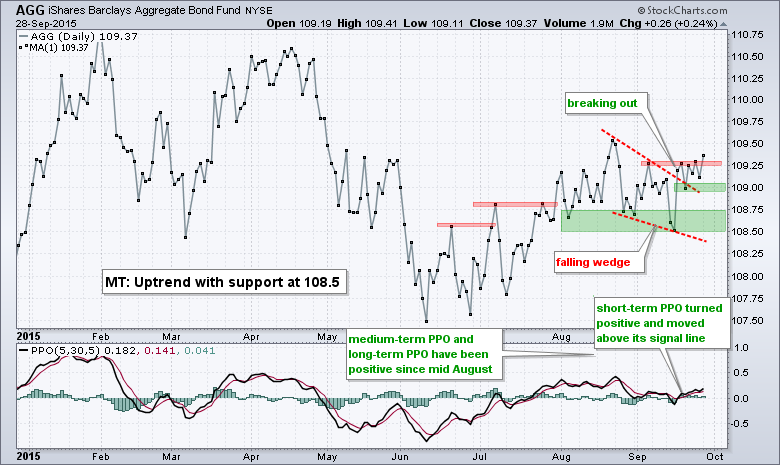
Even though bonds are outperforming stocks and money is moving into bonds, I am not that impressed with recent price action in the bond ETFs. The Aggregate Bond ETF (AGG) is in an uptrend and has a wedge breakout working, but the ETF is struggling to hold this breakout. Chartists need to understand the holdings to understand the price action in ETFs and one thing stands out. 12.72% of the bonds are BBB rated and 11.42% are A rated. These are not junk bonds, but rather bonds with medium credit quality and there are higher quality bonds to be had. AAA and AA are the highest rated. The medium credit ratings are holding AGG back. Despite the struggle, the overall trend is still up. Last week's low marks first support and a move below this level would negate the wedge breakout. The August-September lows mark key support in the 108.5-108.75 area.
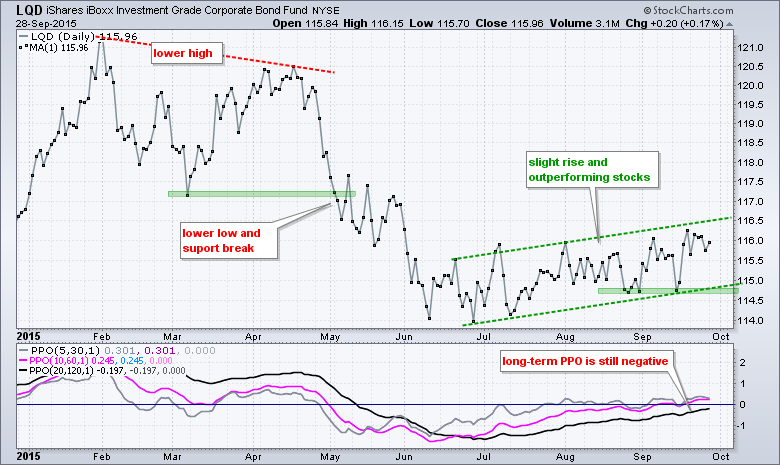
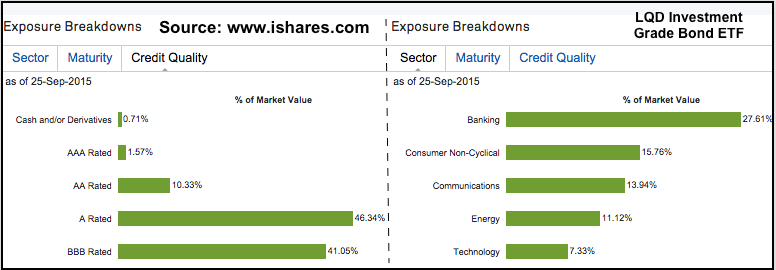
Investment Grade Bond ETF Flattens Out
I am also not that impressed with the Investment Grade Bond ETF (LQD), which includes lots of A and BBB rated corporate bonds (~87% of total). Also note that 27.6% of these bonds are from the banking sector and 11.12% are from the energy sector. On the price chart, LQD formed a lower high in April and broke down in May. The ETF rose from late June to September, but this rise is rather tepid and could be an extended correction (counter-trend bounce). The lower trend line and August lows mark support in the 114.7 area.
High-Yield Bond ETF Sinks to New Lows
High-yield bonds remain under extreme pressure and this group is underperforming the stock market. This is significant because high yield bonds are the riskiest bonds and relative weakness in this asset class reflects risk aversion in the financial markets. The chart below shows the High-Yield Bond ETF (HYG) in the top window and the unadjusted HYG in the lower window. Data at StockCharts is dividend adjusted, which means dividends are added back into the price. This dividend-adjusted data gives chartists the total return picture for stocks and ETFs. Chartists can plot un-adjusted data by preceding the symbol with an underscore (_HYG).
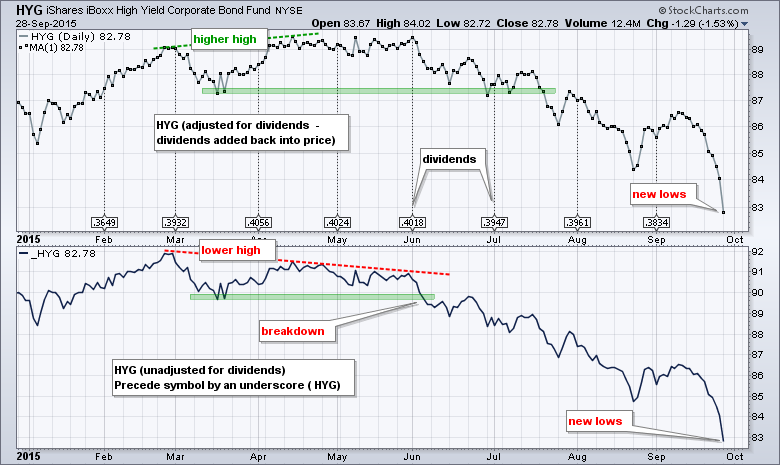
Any way you slice it, the trend for HYG is down and the ETF hit a new low in September. SPY has yet to close below its August closing low and this means HYG is weaker than SPY. Looking at the unadjusted chart, notice that _HYG formed a lower high from February to May and broke down in June. This breakdown occurred a few weeks before the breakdown on the adjusted chart. Note that chartists can plot the dividend dates and amounts by adding "events" as an "overlay".
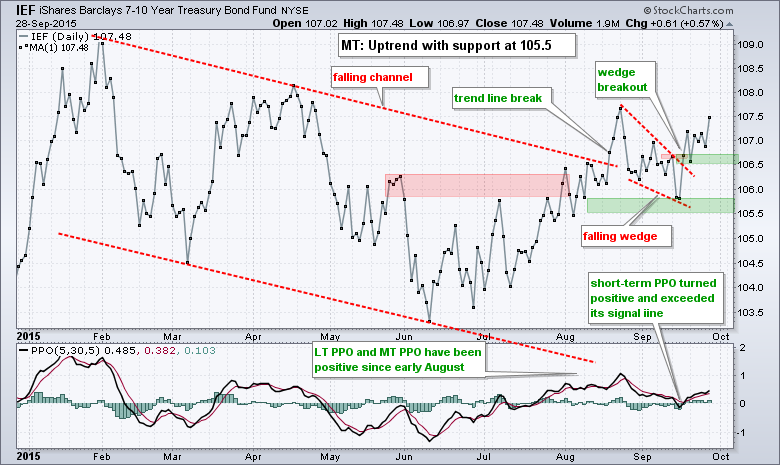
7-10 YR T-Bond ETF Holds Breakout
The 7-10 YR T-Bond ETF (IEF) is one of the strongest bond ETFs in the market right now. On the price chart, IEF broke its channel trend line in mid August, fell back with a rising wedge into September and broke wedge resistance in mid September. This breakout is clearly bullish with 106.5 marking short-term support. I will mark medium-term support at 105.5 for now.
Dollar Extends Downtrend as Euro Holds Support
The Dollar is not attracting much money as a safe-haven currency lately and remains in a downtrend overall. It is not a strong downtrend, but it is a downtrend none-the-less. On the price chart, UUP broke support in April, formed a rising wedge from May to July and broke wedge support with a sharp decline in August. UUP is currently trading above its August lows, but the overall trend is clearly down with resistance set in the 25.25-25.5 area. Taking a step back, the decline from March to August could be one big correction after the new high in March. Notice that a big falling wedge is taking shape and a breakout would signal a continuation of the prior advance. This is just a heads up on what to watch because the onus remains on the bulls to proven the current downtrend otherwise with a breakout.
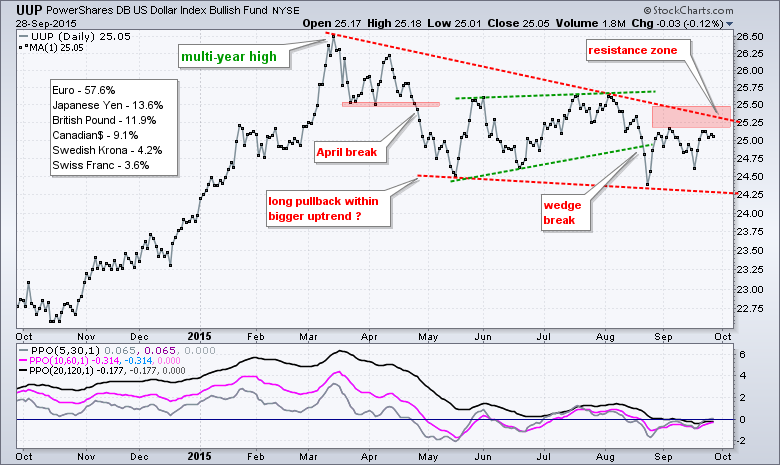
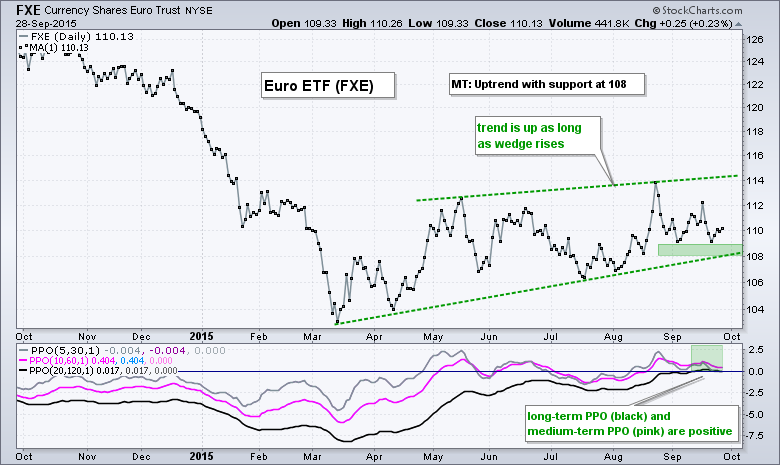
UUP is dependent on the Euro for its direction, and the Yen to some extent. The Euro accounts for some 57.6% of UUP and the Yen accounts for around 13.6%. FXE is in a slight uptrend since March, but this uptrend could be a big correction in the form of a rising wedge. The trend is up as long as the wedge rises and I am marking support at 108. I will stay bullish on the Euro and bearish on the Dollar as long as 108 holds. A close below 108 would break support and this would be bullish for the Dollar.
Gold Backs off Resistance
The Gold SPDR (GLD) did not offer a safe haven on Monday as gold fell along with stocks. Overall, GLD is in a medium-term downtrend and a short-term uptrend. As noted yesterday, I really only look at two trends: the bigger trend and the smaller trend. The bigger trend extends 2-6 months and is captured by PPO (10,60,1) and PPO (20,120,1). The short-term trend extends 1-9 weeks and its captured by the PPO (5,30,5).
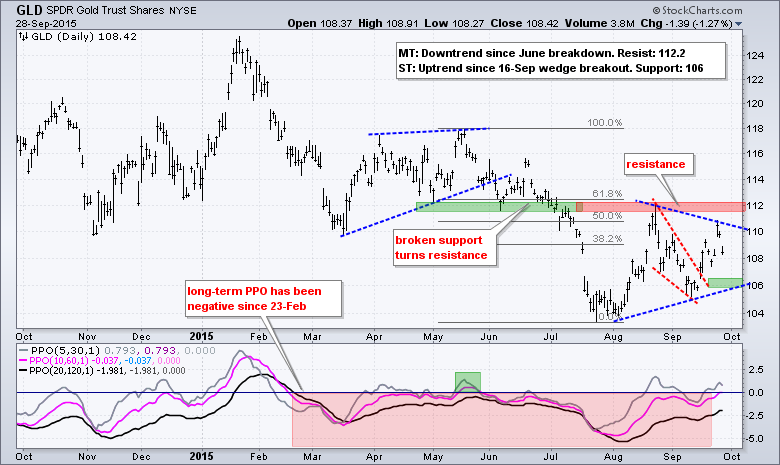
The bigger trend for GLD is down because PPO (20,120,1) is negative, GLD hit a new low in late July and the ETF has yet to break a significant resistance level (112). The short-term trend is up with the wedge breakout, but this is a smaller uptrend within a bigger downtrend, which means I am neutral on GLD right now. Overall, a triangle could be taking shape since late July and a break below 106 would be short-term bearish.
Oil Extends Dull Decline
Oil remains within a boring falling wedge, but crude has held up relatively well in September because the rate-of-ascent is not drastic and oil remains above its August lows. Chartists can measure the rate-of-ascent or rate-of-descent by eye-balling the trend lines. The steeper the trend lines, the greater the rate of ascent or descent. The bigger trend is clearly down for oil and this means I should be ignoring short-term bullish setups. However, technical analysis is part ART and part SCIENCE - and there is a little speculator in all traders. The "Art" side of my brain is a bit intrigued with the wedge setup in crude and the potential for a bounce.
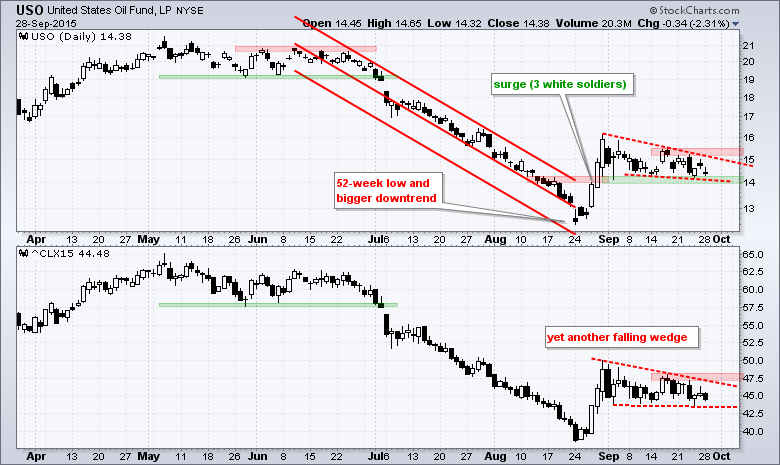
The top window shows the USO Oil Fund (USO) and the bottom window shows November Crude Futures (^CLX15), which I will use as the basis for analysis. Oil surged in late August and then corrected in September with a falling wedge. The short-term trend is down as long as the wedge falls so I will be watching the mid September highs for a potential breakout. USO needs to exceed 15.5 and ^CLX15 needs to exceed 48 for a breakout.
*****************************************
Thanks for tuning in and have a good day!
--Arthur Hill CMT
Plan your Trade and Trade your Plan
*****************************************


