Bigger Trend and Breadth Remain Bearish
Programming note: I will add a video to this commentary by 10AM ET. Also note that I will not be doing a webinar on Tuesday, but will post a commentary. There is no change in the medium-term trends and indicators for the major index ETFs. The trends are down and the indicators are bearish. These medium-term signals have been in effect since August 21st. Just to clarify, the medium-term trend is the big trend as far as I am concerned and this trend is best captured on a daily price chart that extends nine to twelve months. I am really only interested in two trends: the medium-term trend (bigger) and the short-term trend (smaller). The medium-term trend dictates the trading bias and long-term signals. The medium-term trend is down and this means the short-term trading bias is bearish. There are really only two possible positions to have when the trading bias is bearish: short or out. As such, I ignore short-term bullish signals when the trading bias is bearish and only focus on bearish signals, and we sure got a lot of bearish signals last week. Excessive bearish sentiment is about the only positive I can come up with at this point.
The chart below shows the S&P 1500, the S&P 1500 AD Line, the S&P 1500 AD Volume Line and the 10-day EMA of S&P 1500 High-Low Percent. The AD Volume Line broke down on June 29th and the AD Line broke down on July 28th as participation narrowed, especially in July. The broad market was split heading into August and then all hell broke loose. The index went on to break support on August 21st and the 10-day EMA for High-Low Percent crossed below -3% that same day. I am now marking medium-term resistance at the September highs for the S&P 1500, the AD Line and the AD Volume Line. The High-Low indicator is bearish until its breaks back above +3%.
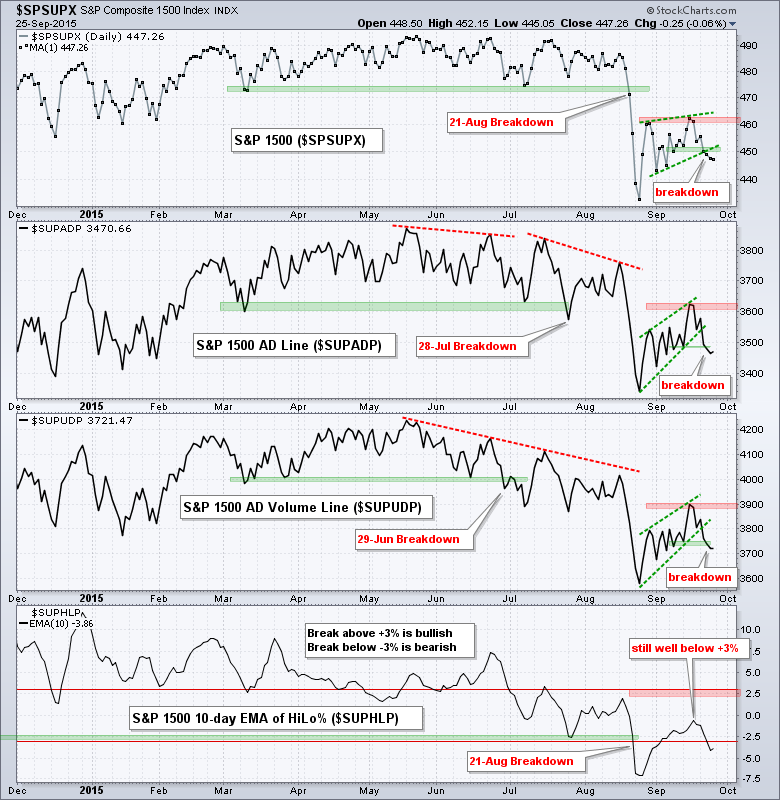
After becoming oversold in late August, the S&P 1500 and breadth indicators bounced from late August to mid September and then broke down again last week. Notice that the S&P 1500, the AD Line and the AD Volume Line formed rising wedges and broke wedge support with sharp declines. The 10-day EMA for High-Low Percent did not even make it back above the zero line before turning down and moving back below -3%. Thus, the short-term evidence is also bearish right now.
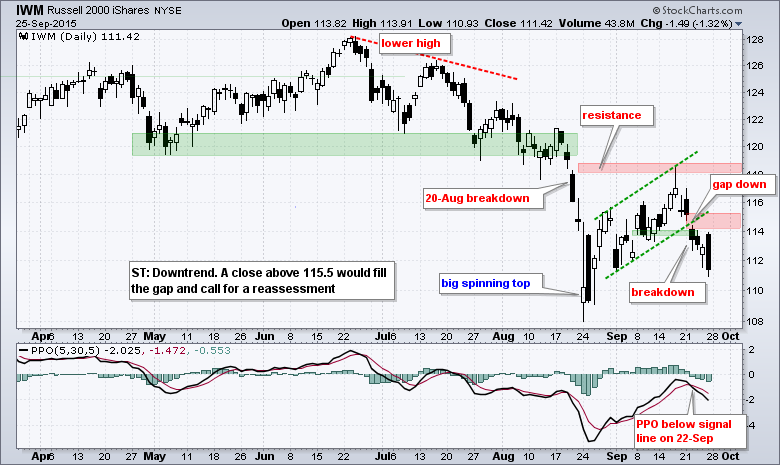
Signal Watch for QQQ, IWM and SPY
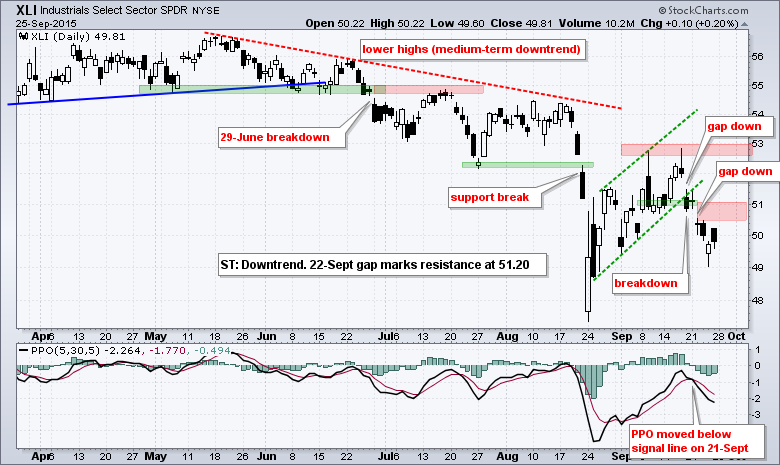
QQQ, IWM and SPY triggered short-term bearish signals last week and these signals remain in effect. These signals started when all three gapped down on Tuesday (22-Sep) and their short-term PPOs turned down, which is when PPO (5,30,5) moved below its signal line. Price action followed as all three closed below their 9-Sept closes, which marked my short-term lines in the sand. IWM was the first to break support by closing below its 9-Sept close on Tuesday. SPY followed suit on Wednesday and QQQ succumbed on Friday. IWM is clearly the weakest of the three, QQQ held up the best and SPY is somewhere in the middle.
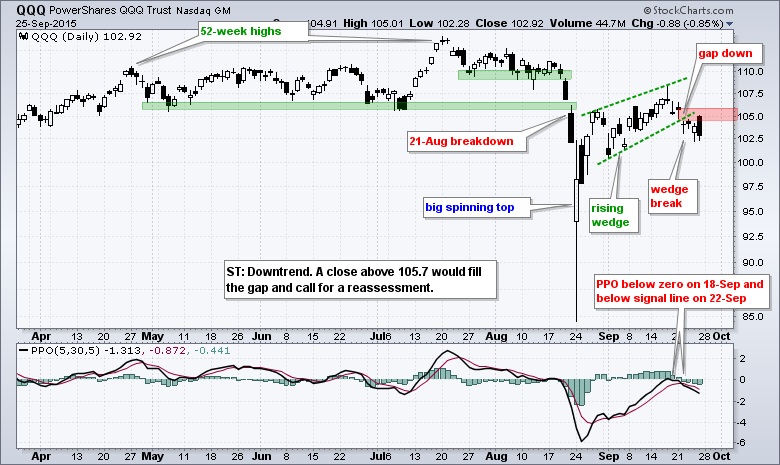
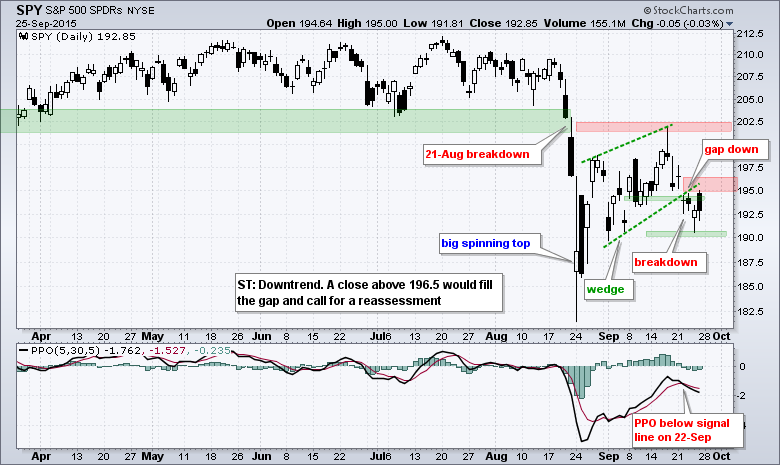
At this point, I am focusing on what would prove this short-term bearish stance otherwise (wrong). Tuesday's gap down was significant and it is important that this gap-decline holds. A close above last Tuesday's close would fill the gap and call for a reassessment. QQQ and SPY opened strong on Friday and entered the gap zone, but did not hold these gains and closed weak. This further reinforces the validity of these gap zones.
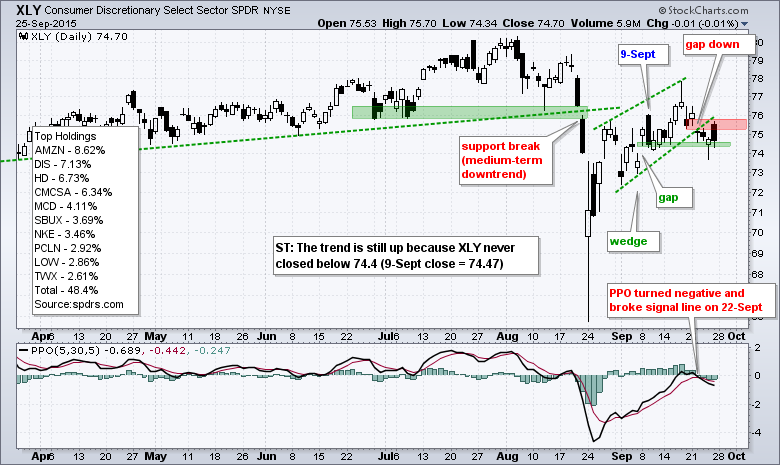
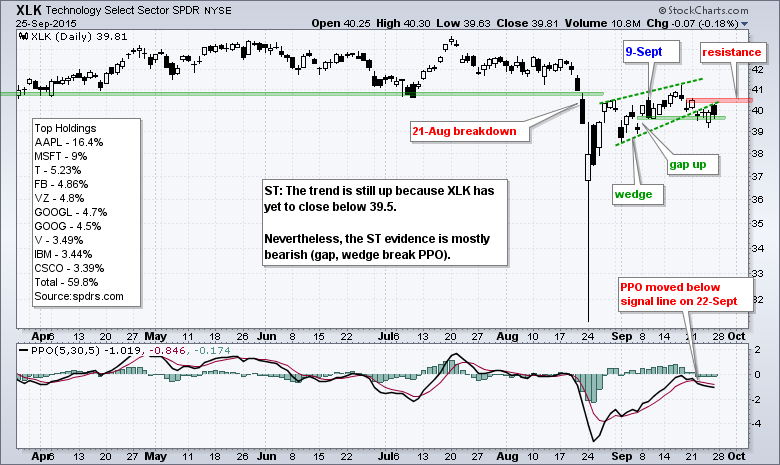
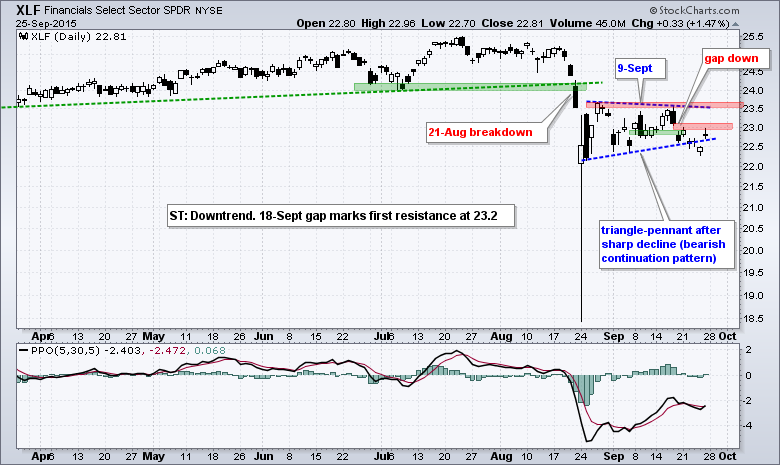
Consumer Discretionary and Technology Hold Out
The Consumer Discretionary SPDR (XLY) and Technology SPDR (XLK) are in short-term uptrends on the price chart because they have yet to close below the 9-Sept close. Even so, the majority of short-term evidence is bearish for these two. Both gapped down on Tuesday, both broke their wedge trend lines and their PPOs moved below the signal lines on 22-Sept (Tuesday). The Industrials SPDR (XLI) and the Finance SPDR (XLF) are the weakest of the four as both gapped down on 18-Sept and have yet to fill these gaps.
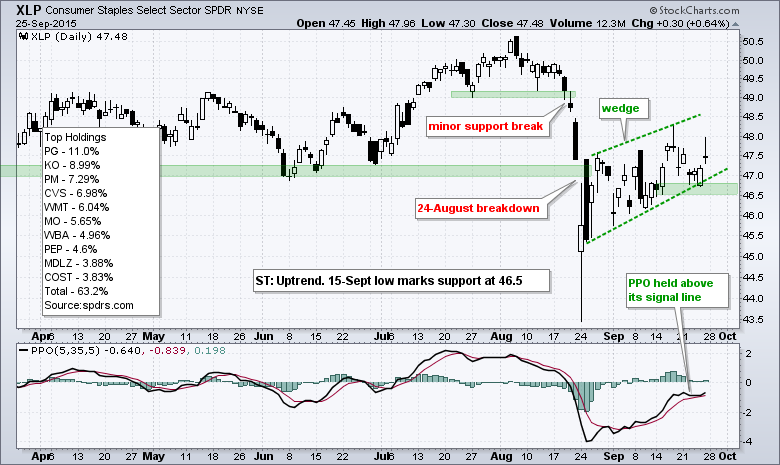
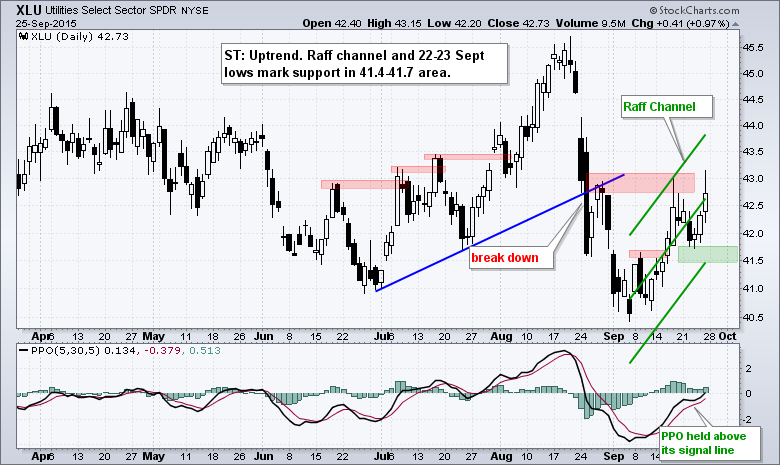
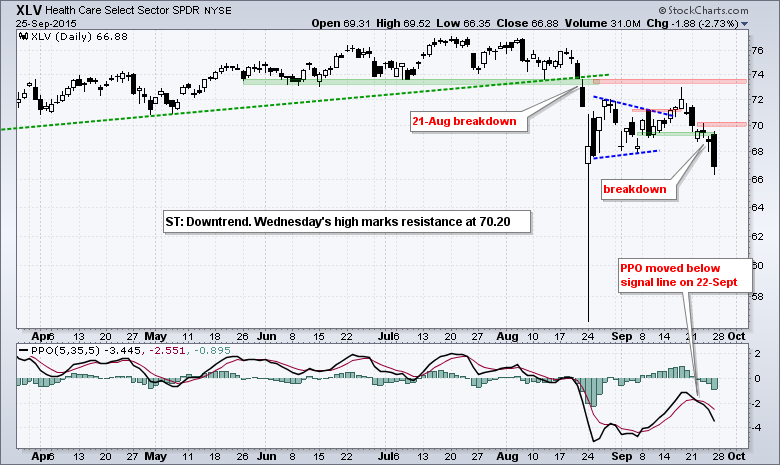
The Consumer Staples SPDR (XLP) and Utilities SPDR (XLU) held up the best last week as money rotated into these defensive sectors. Note that both remain in short-term uptrends and their PPOs did not break below the signal lines. The HealthCare SPDR (XLV) did not hold up and broke down with a close below the 9-Sept close on Thursday.
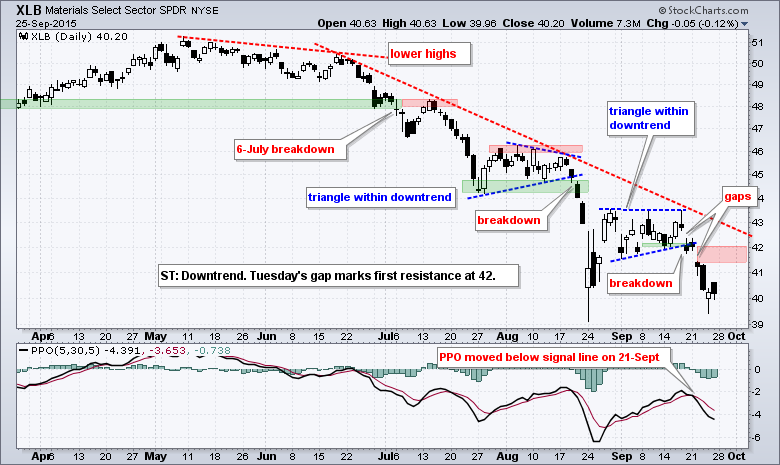
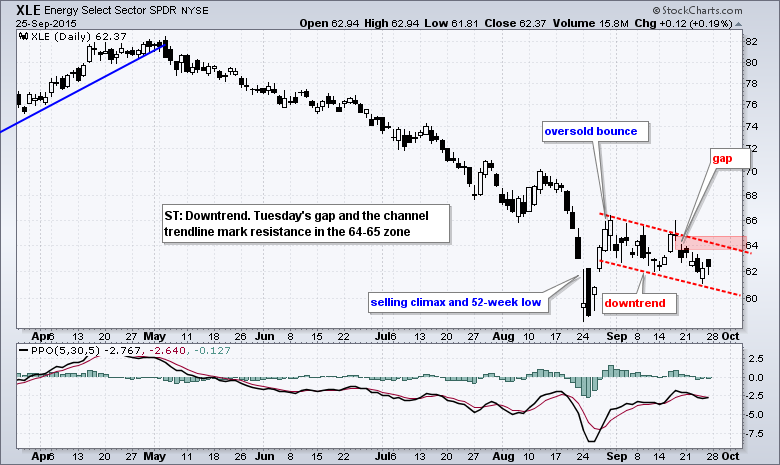
On a closing basis, the Materials SPDR (XLB) closed at a 52-week low on Friday and remains the weakest of the nine sectors on a medium-term basis. The Energy SPDR (XLE) is not far behind and remains in a downtrend since early September.
And then There were Three
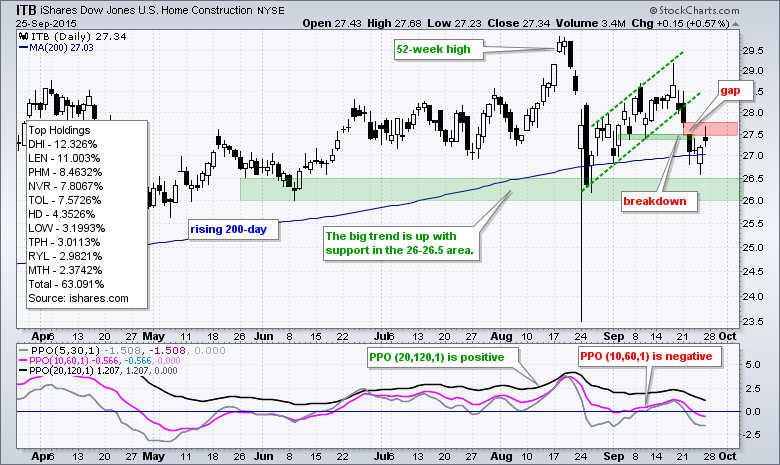
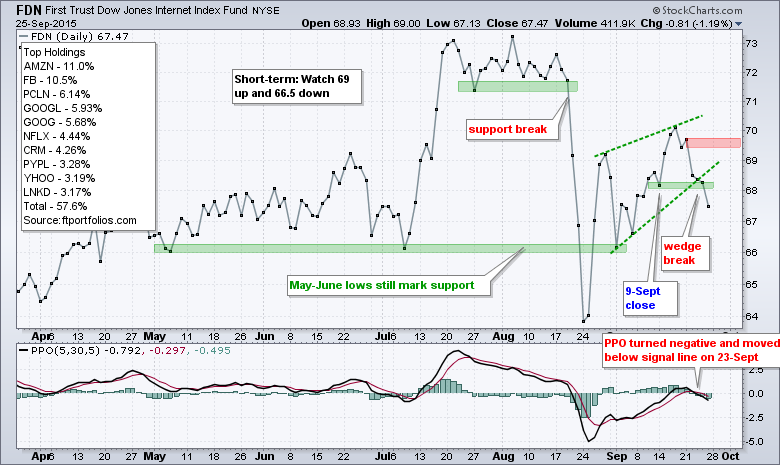
Of the 58 industry group ETFs that I track, only three have a positive PPO (20,120,1). This means that the 20-day EMA is below the 120-day EMA for 55 of the 58 industry group ETFs. The Home Construction iShares (ITB), Home Builders SPDR (XHB) and Internet ETF (FDN) were the only three holding up. That may be about to change because ITB looks vulnerable after it broke short-term support with a gap and the PPO (10,60,1) turned negative. Technically, I still consider the bigger trend up because the PPO (20,120,1) is positive, the rising 200-day has held and the ETF has yet to break a major support level. The June-August lows mark major support at 26 and a breakdown here would reverse the bigger uptrend. The second chart shows FDN breaking wedge support on Friday and I am marking first resistance at 69.75.
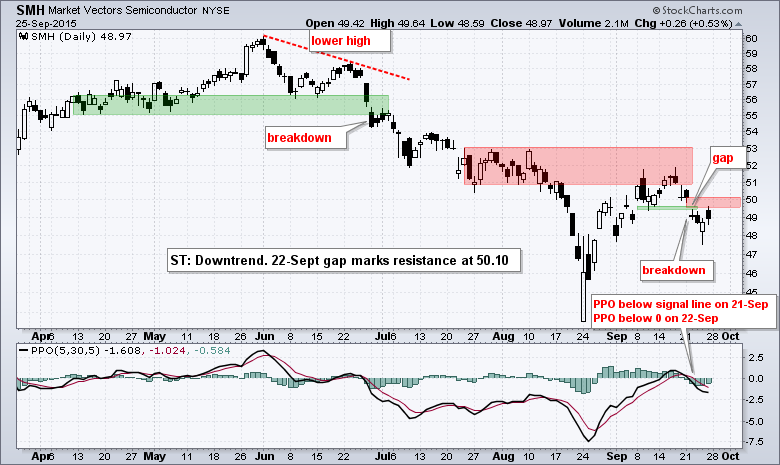
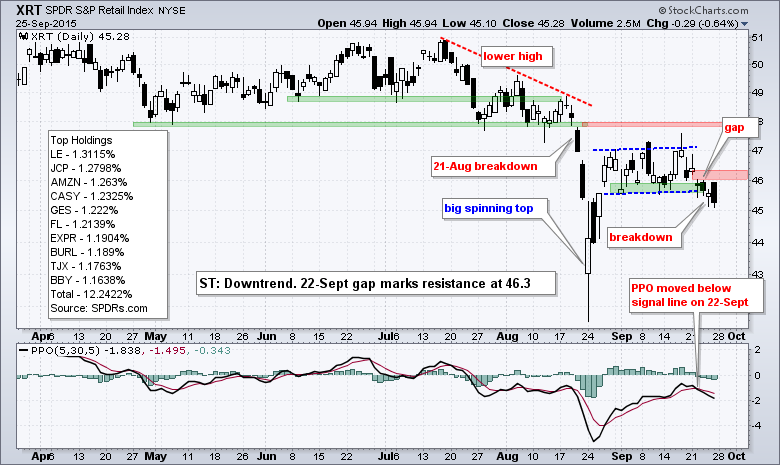
Semis and Retail Break Down
The Semiconductor ETF (SMH) and the Retail SPDR (XRT) represent two cyclical industry groups and both broke down last week as well. In addition, semis are important for the technology sector and retail is an important part of the consumer discretionary sector. Once again, Tuesday's gaps hold the key to these short-term breakdowns.
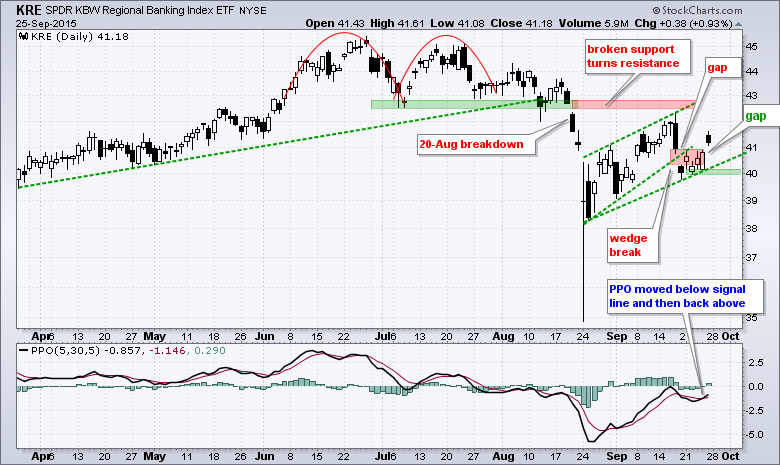
Regional Bank ETF Fills the Gap
The Regional Bank SPDR (KRE) is complicating the short-term picture with a gap up and close above 41 on Friday. First and foremost, the bigger trend is down after the August breakdown. This means short-term uptrends run counter to the bigger downtrend and I am not taking short-term bullish signals. I can turn neutral when the short-term trend is up and the medium-term trend is down, but I would not turn outright bullish. Thus, even though KRE gapped up and the PPO moved above its signal line, it is just cause to turn neutral. I will now mark support at 40. A break below 40 and bearish signal line cross in the PPO would reverse the short-term uptrend.
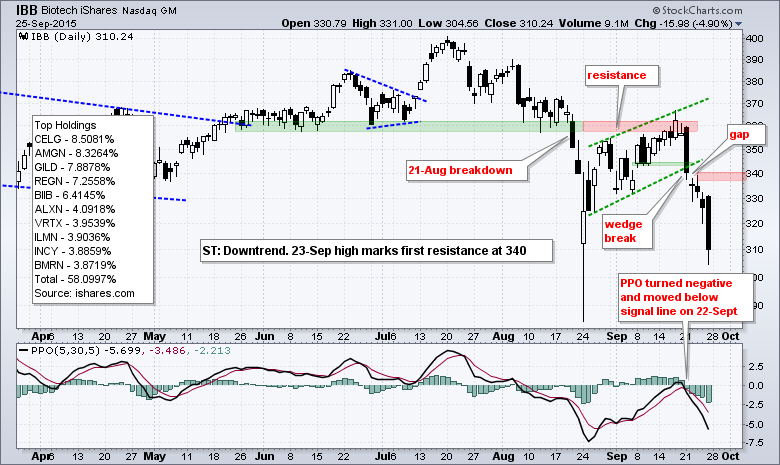
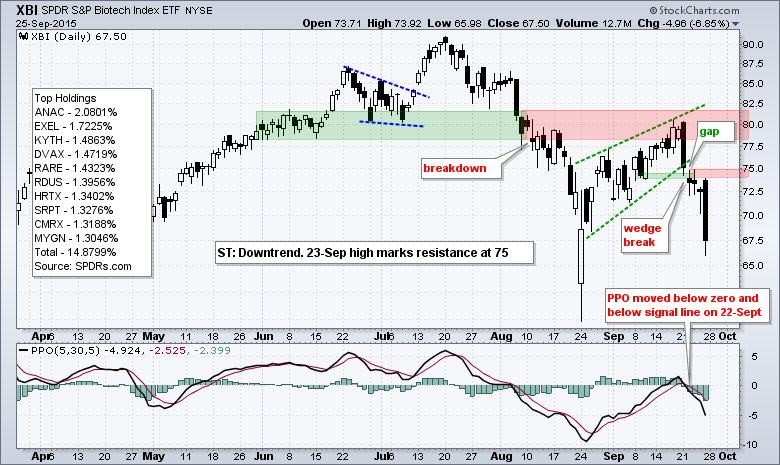
Biotechs Follow Through on Signals
Biotechs were hit hard on Friday, but bearish signals triggered before these breakdowns. Thus, Friday's weakness should not be a complete surprise. I showed IBB and XBI with rising wedges last Tuesday and marked support with the 9-Sept close. Both ETFs closed below this level on Tuesday and broke down with the rest of the market. Note that the StockCharts Technical Ranks (SCTR) for IBB and XBI moved below 30 for the first time since July-August 2014.
*****************************************
Thanks for tuning in and have a good day!
--Arthur Hill CMT
Plan your Trade and Trade your Plan
*****************************************


