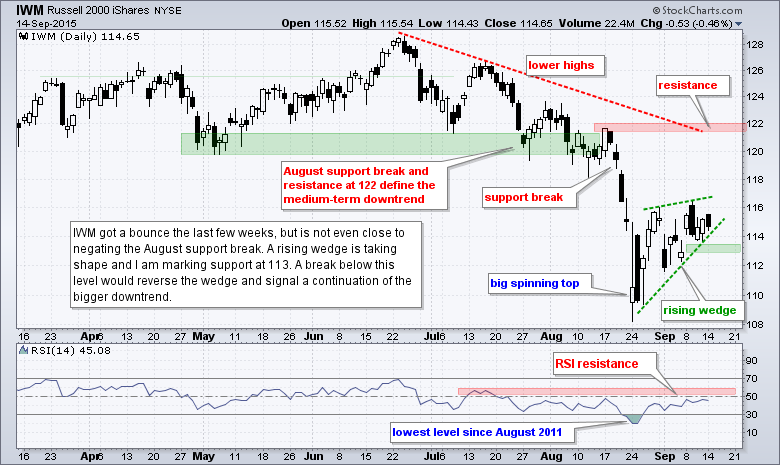
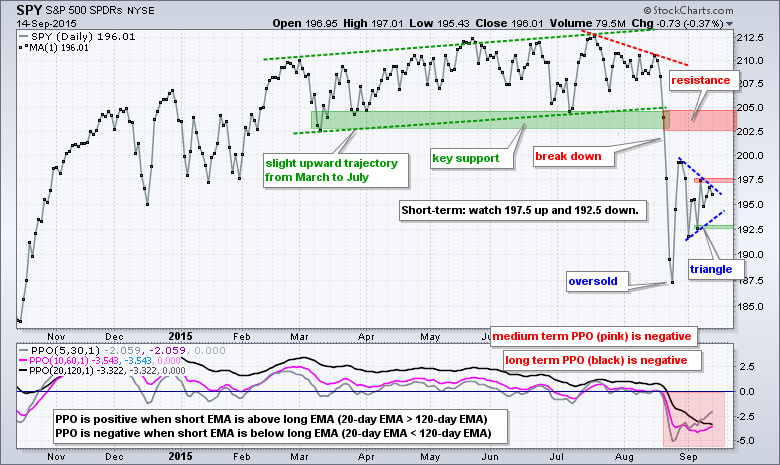
The major index ETFs remain in medium-term downtrends and short-term uptrends. Well, the short-term uptrend in SPY is up for debate because a triangle is taking shape. Nevertheless, SPY, QQQ and IWM gapped up last Tuesday and these gaps held for five days. We saw an intraday reversal on Wednesday with dark cloud patterns and bearish engulfings forming, but there was no downside follow through and the gaps are still standing (and short-term bullish).
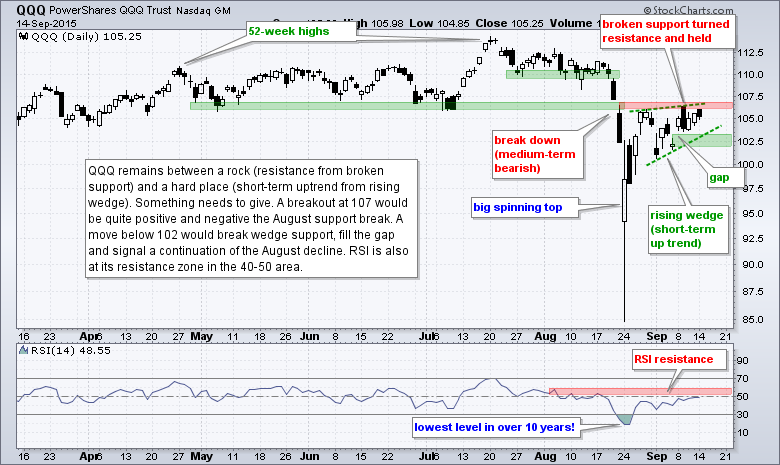
Despite gaps and engulfings last week, I am showing a close-only price chart for SPY to filter out some of the recent volatility. IWM and QQQ are in short-term uptrends with rising wedges taking shape, while SPY is holding within a triangle. Rising wedges are typical for corrective bounces within a bigger downtrend. It is OK to be short-term bullish as long as the wedges rise, but chartists should tread carefully because the bigger trend is down and could take over. I am watching wedge support for signs of a break down to signal that the bigger downtrends are resuming.
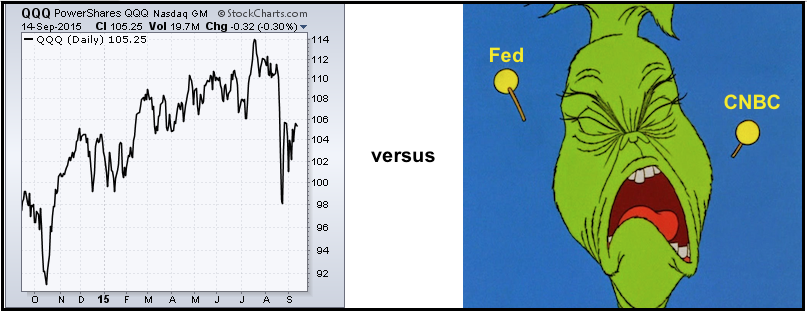
Enough Already!
It seems that there is a Fed meeting this week and this is creating a high level of anxiety in the markets. Give me a break. Who really cares if the Fed Funds rate is 0% or .25%. Even though a rate hike means the end of zero interest rate policy, it does not signal the beginning of high interest rate policy. It is a non-event as far as I am concerned. Market anxiety stems from the unknown because nobody really knows what the Fed will do and when. My advice: tune out the Fed and tune in the charts. The financial markets typically lead the Fed and will do what they want, regardless of what the Fed does this month or next.
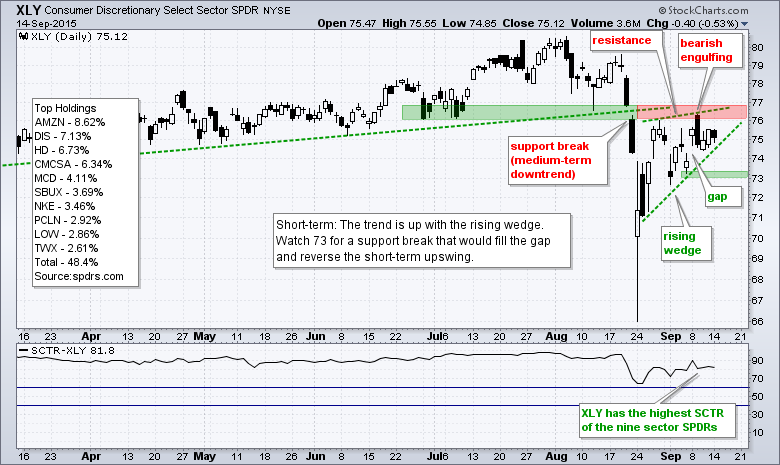
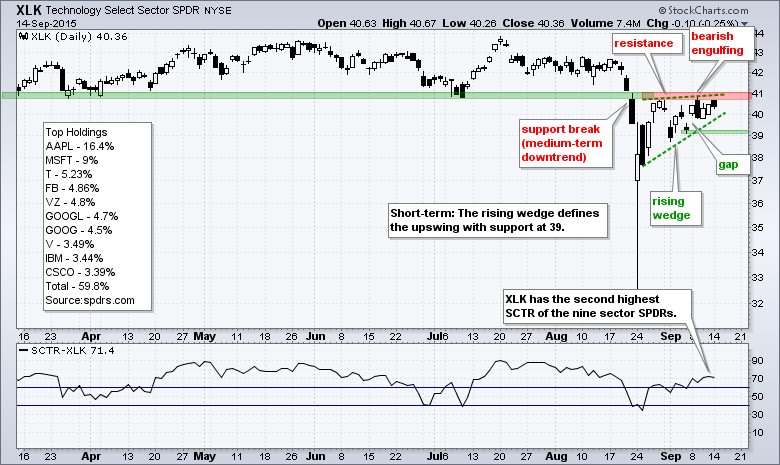
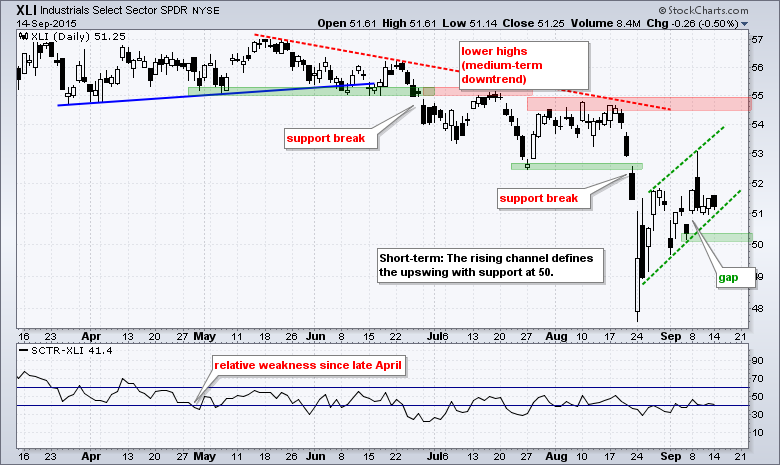
XLY and XLK Lead with Rising Wedges
All nine equal-weight sector ETFs are in medium-term downtrends after the August support breaks. Some managed to bounce over the last few weeks, while others simply consolidated and traded flat. The Consumer Discretionary SPDR (XLY), Technology SPDR (XLK) and Industrials SPDR (XLI) got nice bounces over the last few weeks and formed rising wedge patterns. The short-term trends are up as long as Tuesday's gaps hold. I am watching these three closely because they led the rebound over the last three weeks. Break downs in these three would weigh on the broader market.
Housing and Retail Split
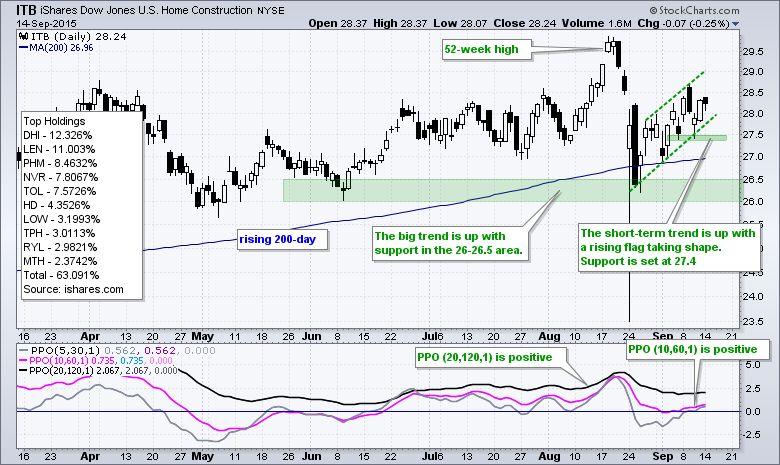
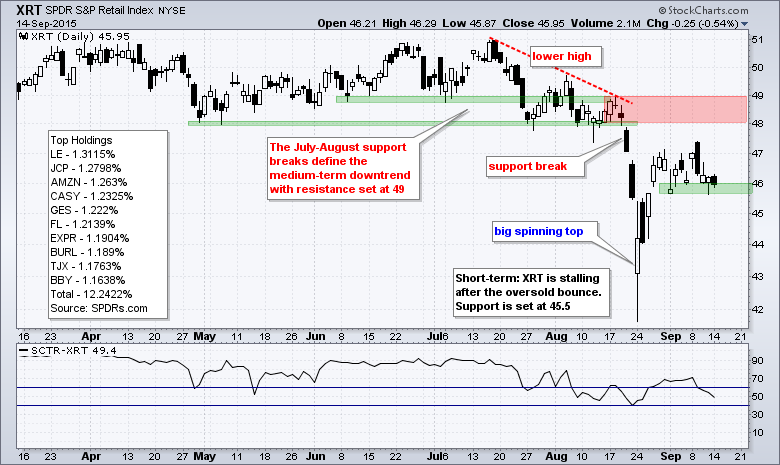
Within the consumer discretionary sector, I am always watching the Home Construction iShares (ITB) and the Retail SPDR (XRT) closely because they are tied to the domestic economy. It is little wonder that the market is mixed because these key industry groups are not on the same page. ITB held support in August, remains in an uptrend and shows relative strength. XRT broke down in August and shows relative weakness.
Semiconductor ETF Holds Breakout
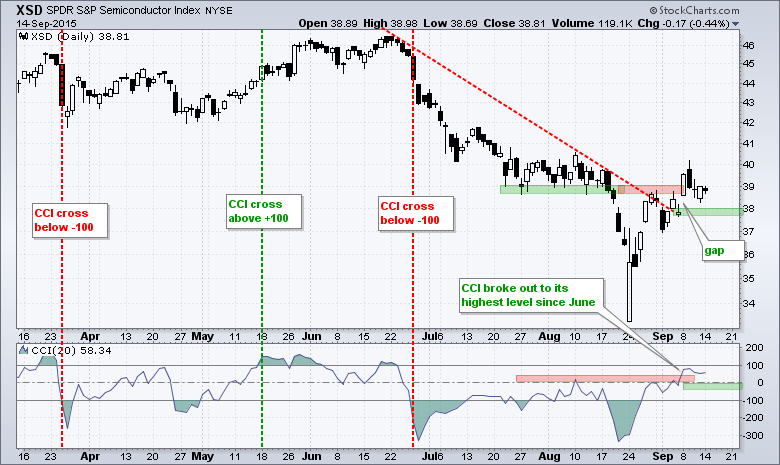
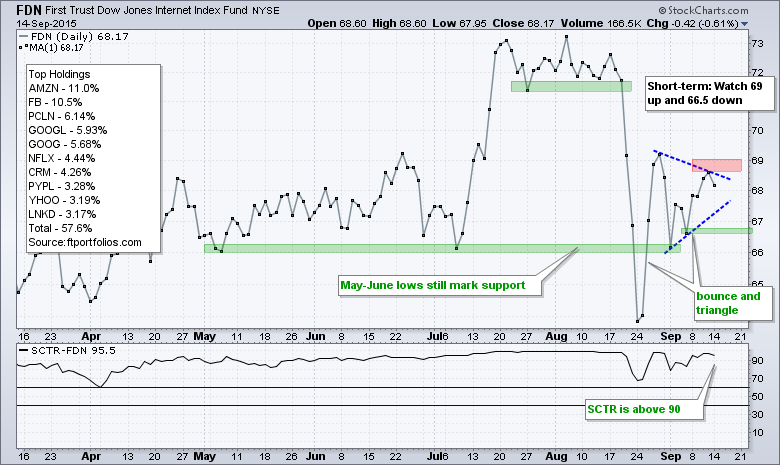
Within the technology sector, my eyes are on the Semiconductor SPDR (XSD) because it recently broke out and the Internet ETF (FDN) because it is the technical leader. XSD broke out with a surge above 39 last week and then formed a dark cloud pattern the very next day. Despite this intraday reversal, last week's gap is holding and the immediate trend is up. I am marking first support at 37.60. The indicator window shows CCI breaking above 50 and hitting its highest level since June. Momentum favors the bulls as long as CCI holds above -50.
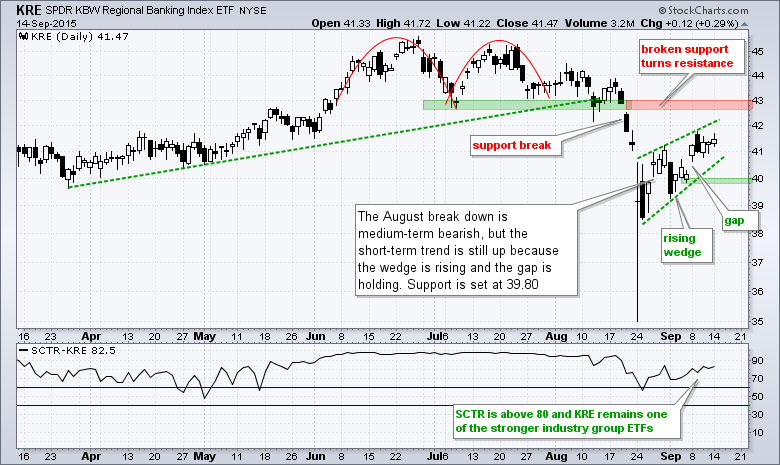
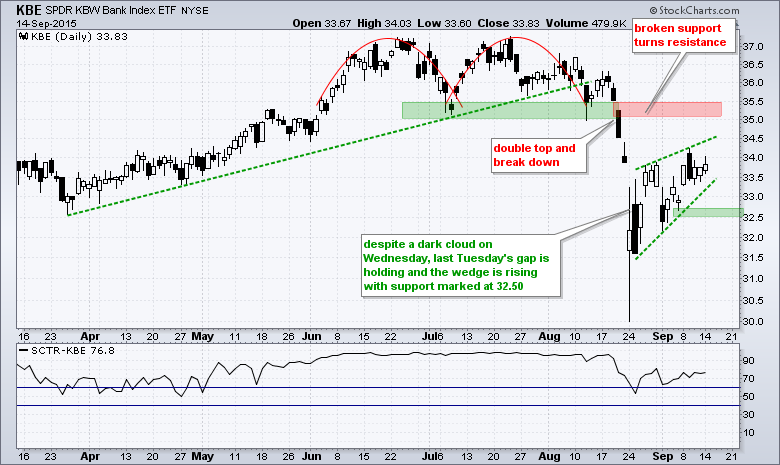
Bank ETFs Mind Their Gaps
Despite the August breakdowns, the three finance-related ETFs below are maintaining their short-term uptrends and holding last week's gap. Rising wedges are taking shape to define the uptrend over the last few weeks. As with the major index ETFs above, this puts these finance-related ETFs between a rock (medium-term downtrend) and a hard place (short-term uptrend). Chartists should watch the gaps for a break that would reverse the short-term uptrend and signal a continuation lower.
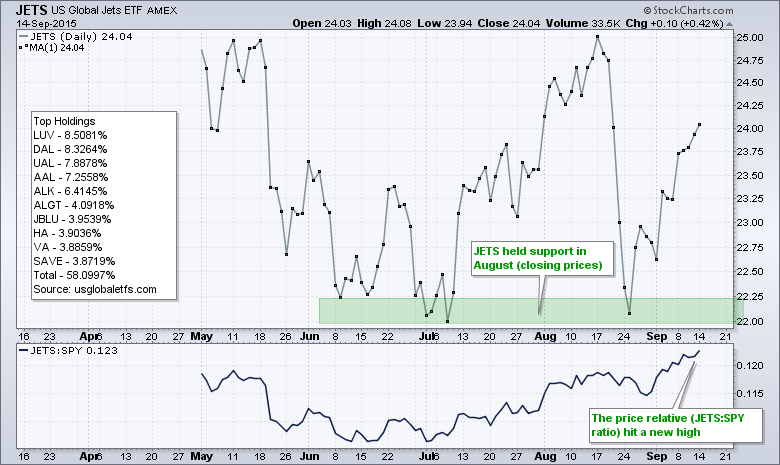
Airline ETF Hits New Relative High
The Airline ETF (JETS) continues to show relative strength as the price relative moved to another new high this week. On the price chart, JETS held the June-July lows in August (closing basis) and surged off this support zone the last three weeks. The ETF closed higher the last five days in a row and represents one of the strongest groups in the market right now.
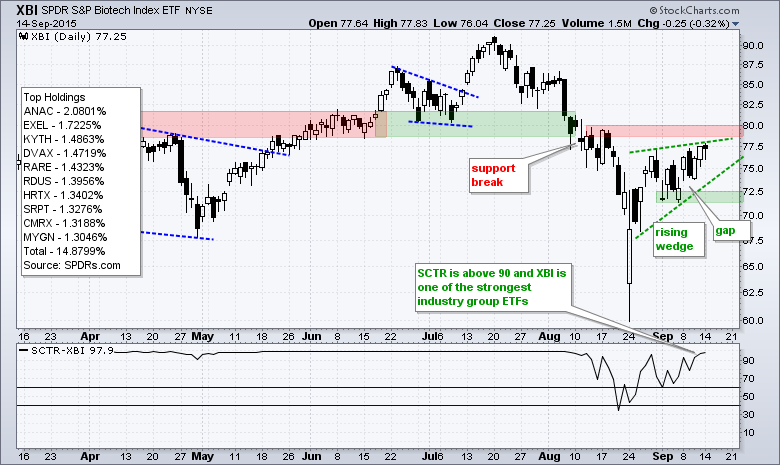
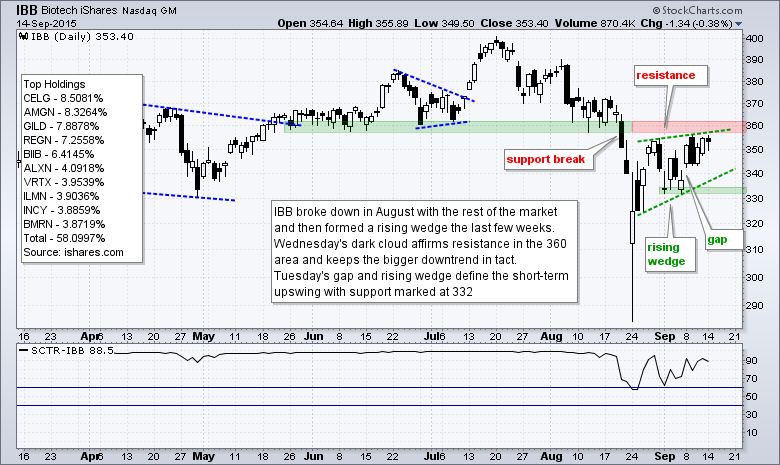
Biotech ETFs Near August Support Breaks
The Biotech iShares (IBB) and Biotech SPDR (XBI) are also caught between a rock and a hard place. The August support breaks turn into resistance and both are nearing these resistance levels with rising wedges. The rising wedges define the current upswing with support marked by the early September lows.
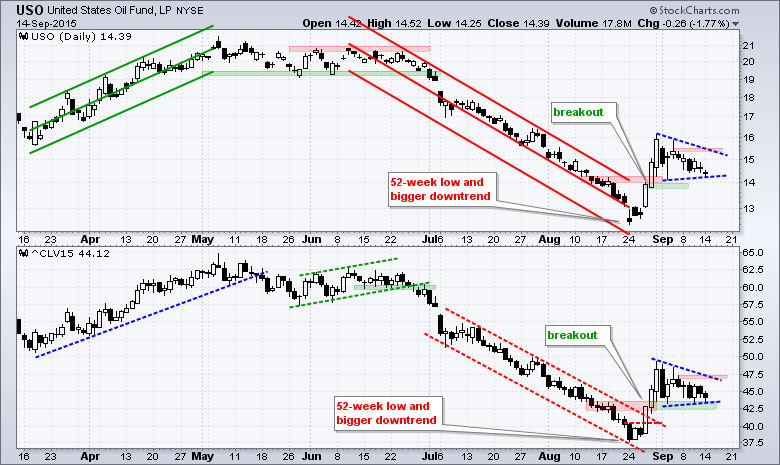
Oil Consolidates after late August Surge
The USO Oil Fund (USO) and the October Crude Contract (^CLV15) surged with a big three-day advance in late August and then consolidated with small triangles the last few weeks. Even though the bigger trend is down for oil, these triangles could be short-term bullish. A breakout from triangle resistance would signal a continuation of the late August surge. A breakout in oil would lift the Energy SPDR (XLE) and Oil & Gas Equip & Services SPDR (XES).
******************************************
Thanks for tuning in and have a great day!
--Arthur Hill CMT
Plan your Trade and Trade your Plan!
*****************************************


