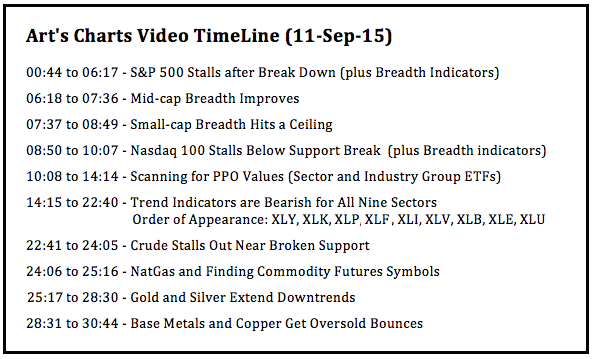
There is clearly a bearish headwind working against stocks right now. The major stock indices are in downtrends after their August support breaks, the key breadth indicators are bearish and all nine sectors are in downtrends. The image below shows the major indexes and their key breadth indicators. The boxes are all red and this means each indicator is bearish.
Trading has turned choppy over the last two weeks as the stock market attempts to digest the August breakdowns and the surge in volatility. The stock market went through a similar period in August-September 2010 and from May to July 2011. At this point, I will simply adhere to the bearish signals until there is evidence to the contrary. I do not know how long this signal will last and how far the market will decline. It will end when it ends, and not a moment sooner.
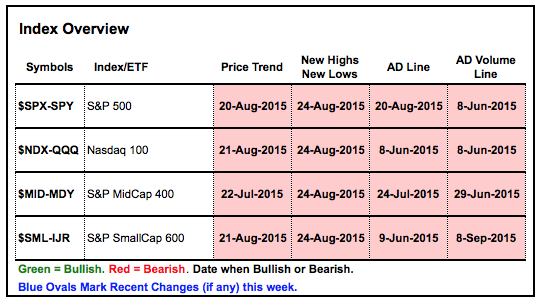
S&P 500 Stalls after Break Down
Before looking at the breadth indicators and major index charts, note that the 10-day SMA for S&P 1500 AD Percent ($SUPADP) has yet to record a bullish breadth thrust and remains bearish. Overall, the major stock indices and their respective breadth indicators remain bearish. The break down parade for the S&P 500 started with the AD Line on June 8th and the AD Volume Line on June 15th. The S&P 500 followed with a close below the March-July lows on August 20th and the 10-day EMA for High-Low Percent turned bearish with a break below -3% on August 24th. These signals remain in force and have yet to be overturned with upside breakouts.
Trading in the S&P 500 turned volatile the last two weeks as the index gyrated between 1989 and 1913. Note that this gyration is taking place well below the August support break and within an overall downtrend. The annotations show small triangle taking shape short-term. A close above 1970 would produce an upside breakout and argue for a challenge to broken support. A close below 1920 would trigger a bearish signal and argue for a continuation of the larger downtrend. The AD Line and AD Volume Line are also consolidating with the green dashed lines marking short-term support and the red dashed lines marking short-term resistance.
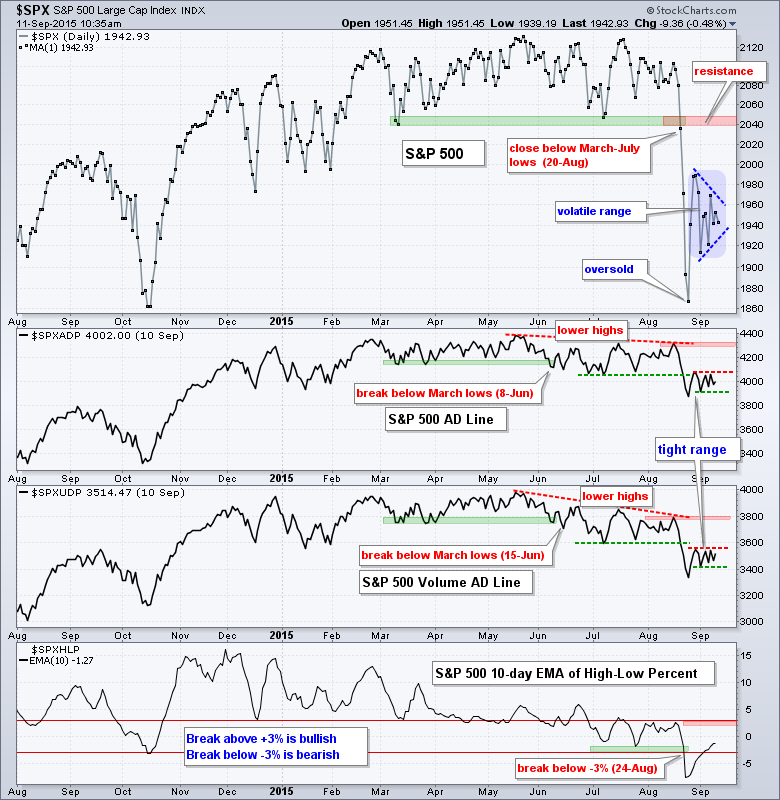
Mid-cap Breadth Improves
The medium-term evidence for the S&P MidCap 400 remains bearish, but the AD Line and AD Volume Line are showing some short-term strength in September. Notice that the index consolidated with a pennant-triangle and did not exceed its late August high. In contrast, the AD Line and AD Volume Line exceeded their late August highs and showed some relative strength recently. Keep in mind that this is just a short-term issue. A close above 1421 in the index would be short-term bullish. Alternatively, a close below 1380 would break pennant support and be short-term bearish.
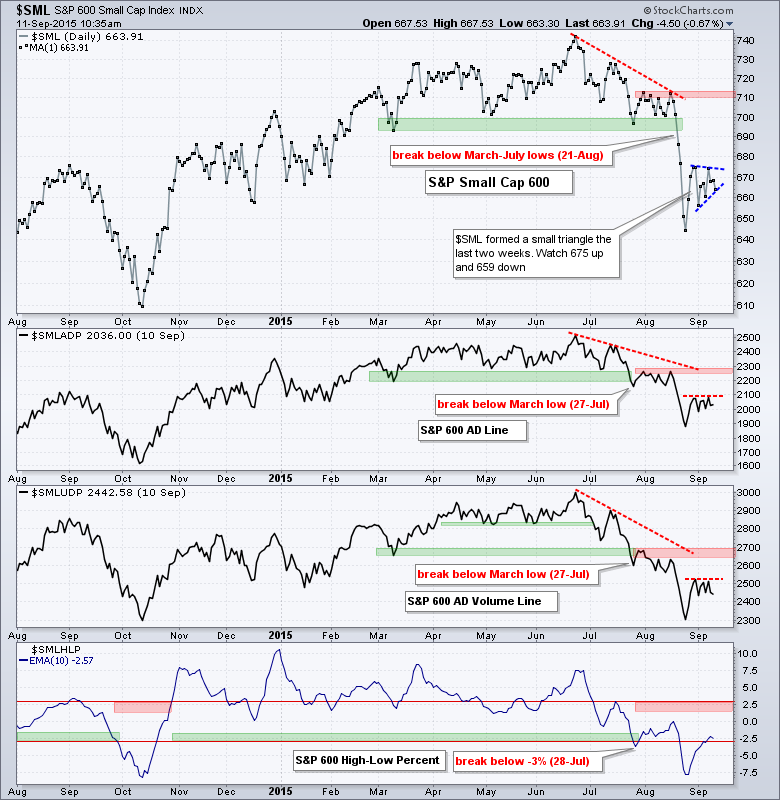
Small-cap Breadth Hits a Ceiling
The medium-term evidence for the S&P Small-Cap 600 remains bearish. The three breadth indicators turned bearish at the end of July and the S&P Small-Cap 600 broke support on August 21st. The index, AD Line and AD Volume Line stalled the last two weeks and chartists can watch these boundaries for the next short-term signals. While upside breakouts would be short-term bullish, they would not be enough to reverse the bigger downtrends. Note that a close below 659 would break triangle support and signal a continuation lower.
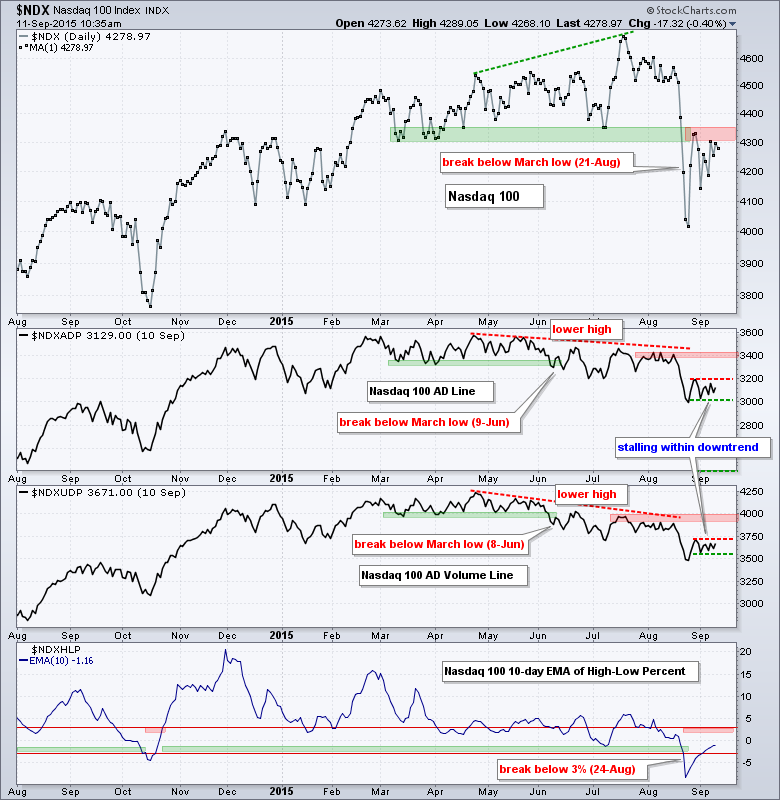
Nasdaq 100 Stalls Below Support Break
The medium-term evidence is bearish for the Nasdaq 100. The AD Line and AD Volume Line broke down in early June. The Nasdaq 100 broke down on August 21st and the High-Low indicator broke below -3% on August 24th. Broken support is turning into resistance and a close above 4350 would argue for a reassessment of the downtrend. The AD Line and AD Volume Line stalled the last two weeks with the red line marking short-term resistance and the green line marking short-term support. Upside breakouts would be short-term bullish and downside breaks would signal a continuation of the bigger downtrend.
Trend Indicators are Bearish for All Nine Sectors
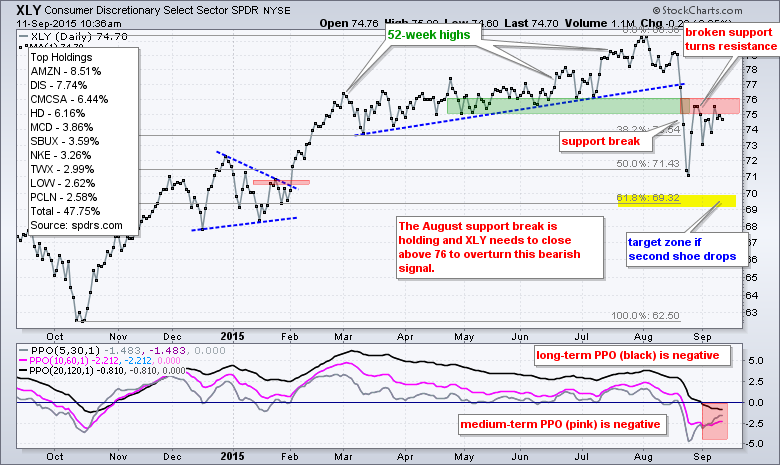
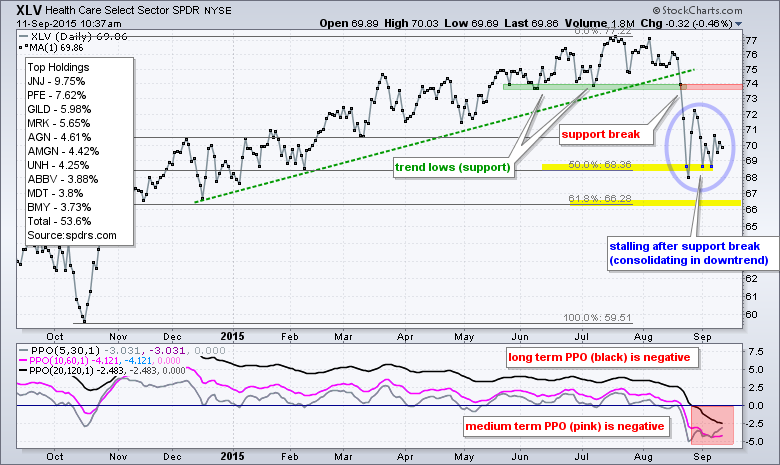
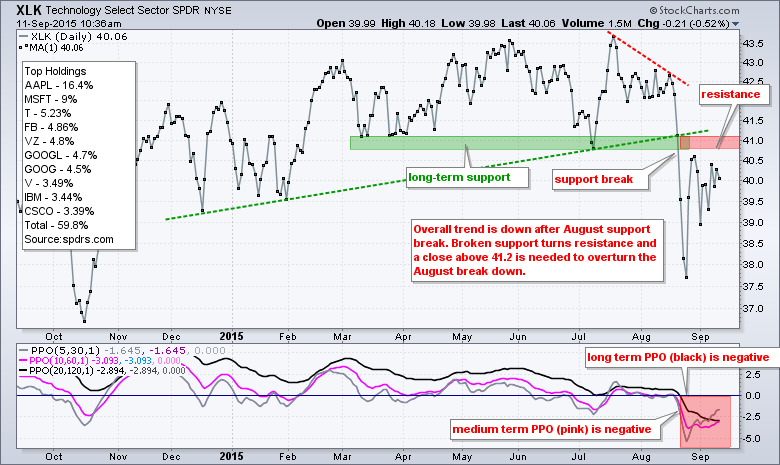
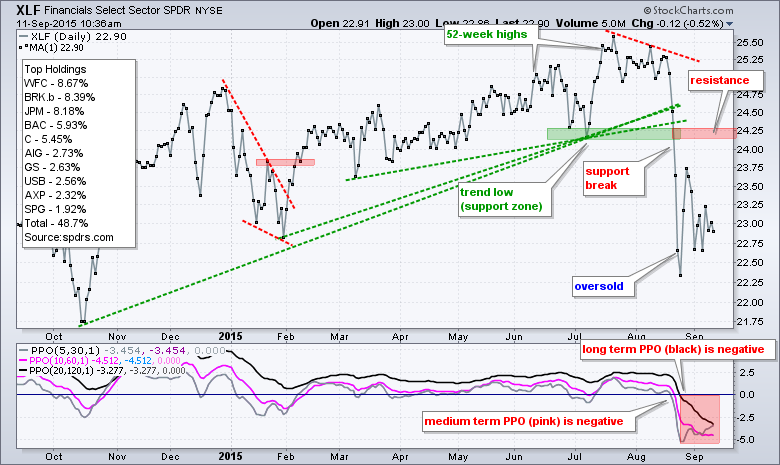
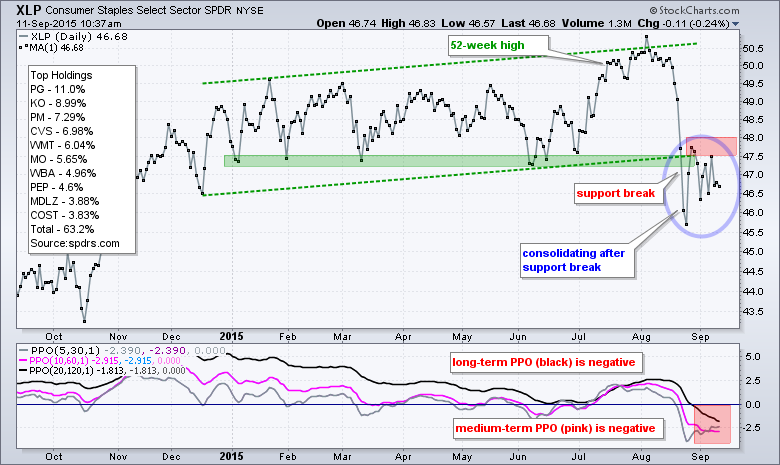
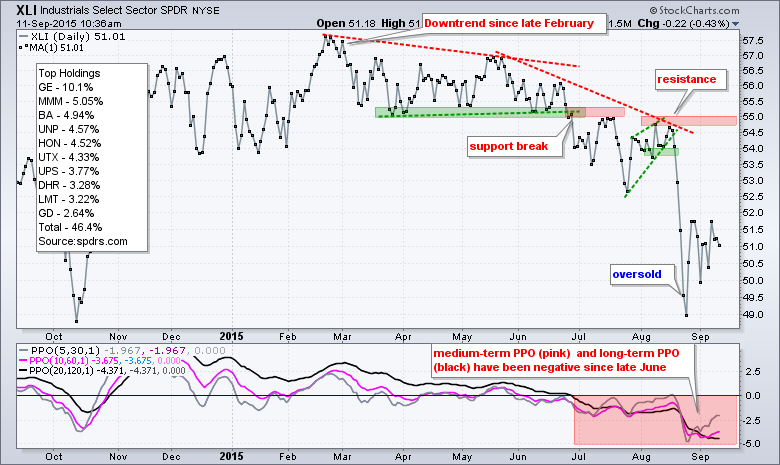
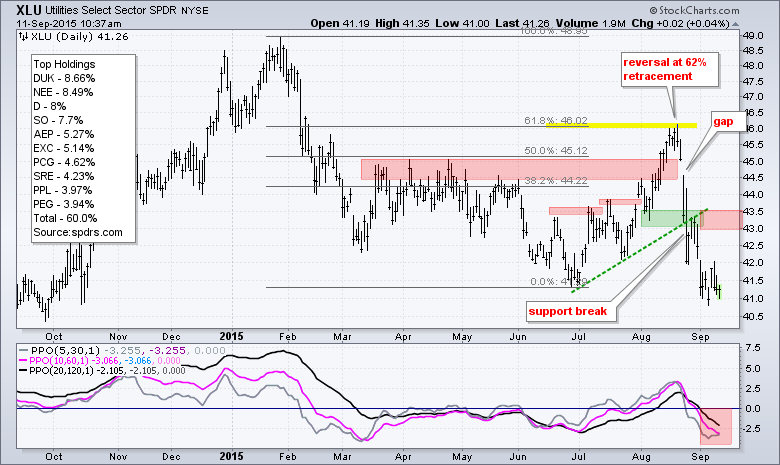
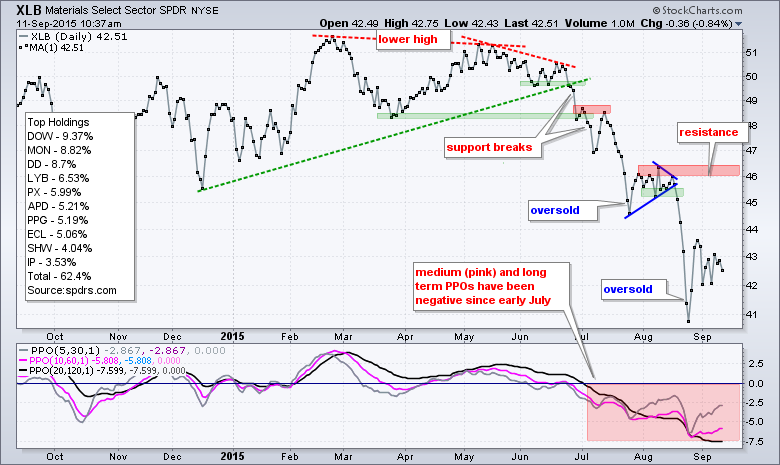
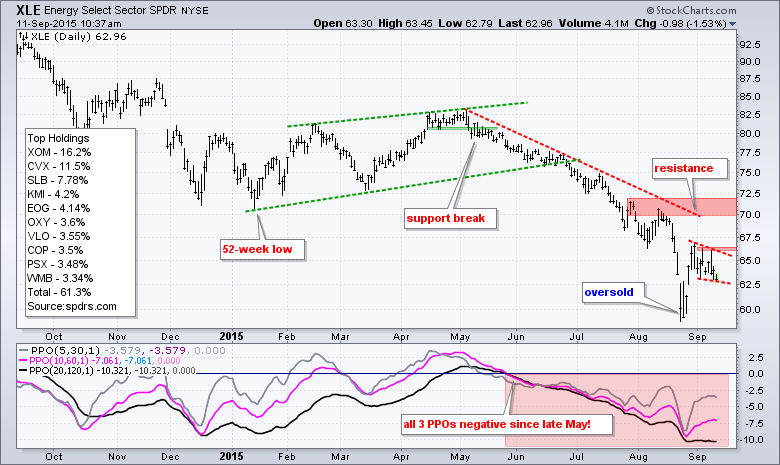
The next charts show the nine sector SPDRs with the Percentage Price Oscillators in the indicator window. The PPO(10,60,1) is positive when the 10-day EMA is above the 60-day EMA and negative otherwise. I use this PPO to gauge the 2-3 month trend. The PPO(20,120,1) is positive when the 20-day EMA is above the 120-day EMA and negative otherwise. I use this indicator to gauge the 4-6 month trend. Currently, the medium-term PPO (10,60,1) and long-term PPO (20,120,1) are negative for all nine sector SPDRs. They are also negative for the nine equal-weight sector SPDRs. This means all sectors are in downtrends and this supports the bearish case for the broader market.
As the charts below show, the August support breaks remain the dominant signals on most of the price charts. The first challenge for the bulls is to recover these support breaks and close above the red resistance zones. Note that the order of the charts reflects a loose relative performance ranking. Overall, XLY is the strongest of the group and XLE is the weakest.
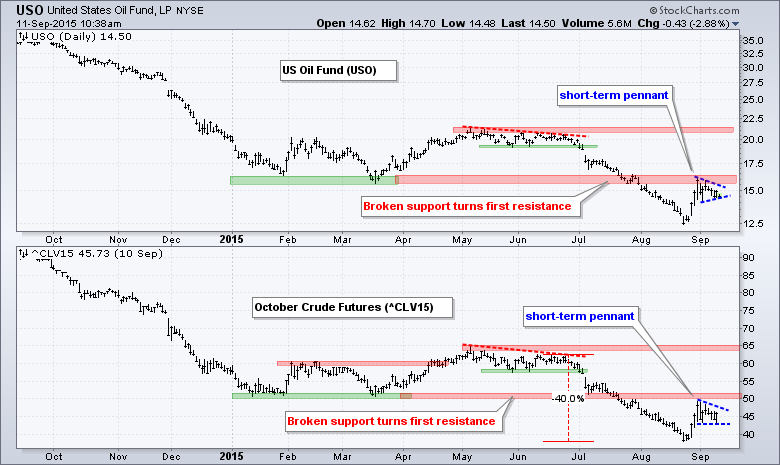
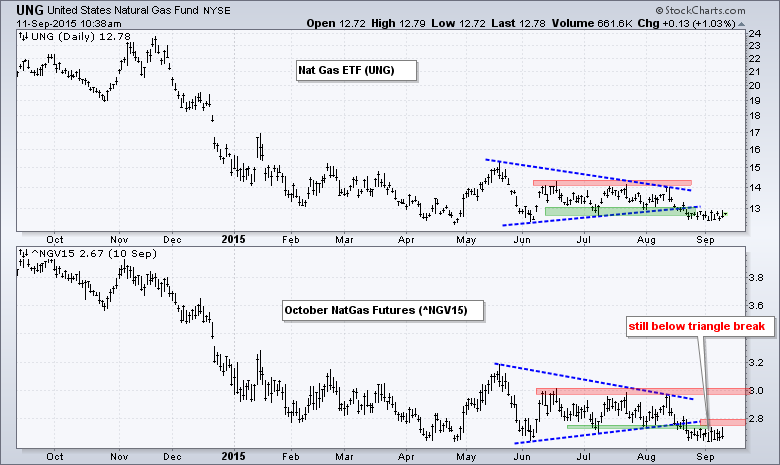
Crude Stalls Out Near Broken Support
Oil got an oversold bounce at the end of August, but this is still just a bounce within a bigger downtrend. I am focusing on October Crude Futures (^CLV15) for the analysis, trend and signals. Crude broke down with a 40% decline and then bounced back to broken support near 50. This level turned into resistance as prices stalled with a small pennant or wedge. A move above 48 would break wedge resistance and argue for a break above broken support. Such a move would be positive, but still within a bigger downtrend and with major resistance at 65. The second chart shows October NatGas Futures (^NGV15) breaking triangle support and remaining below this break.
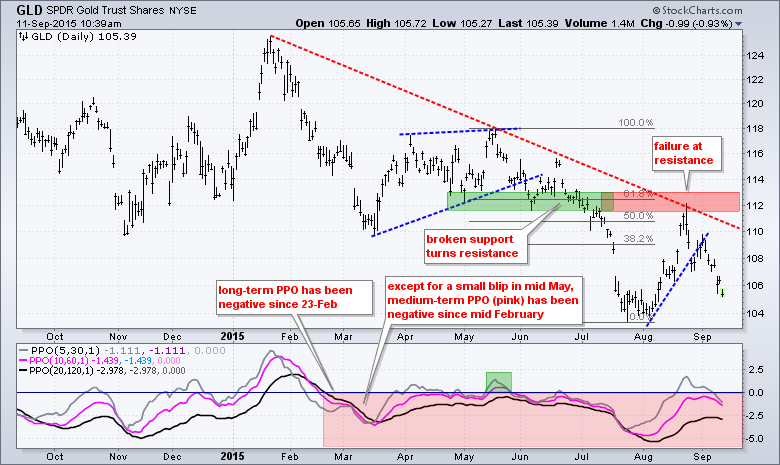
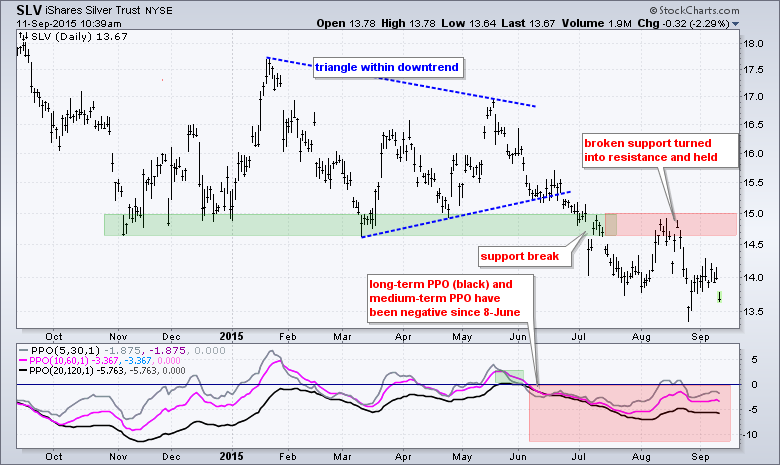
Gold and Silver Extend Downtrends
Gold remains in a clear downtrend after failing at broken support in late August. Gold surged as the stock market plunged in mid-late August, but did not break above its resistance zone and reversed near the 62% retracement. This peak reinforces resistance in the 112-113 area and GLD must break this resistance zone to reverse the downtrend.
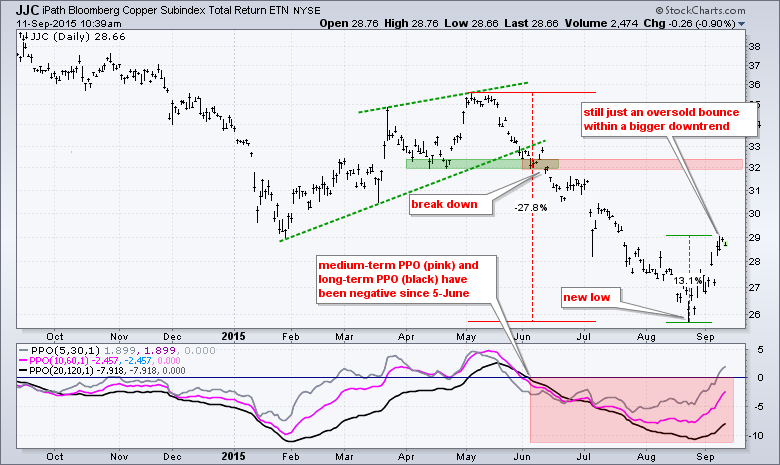
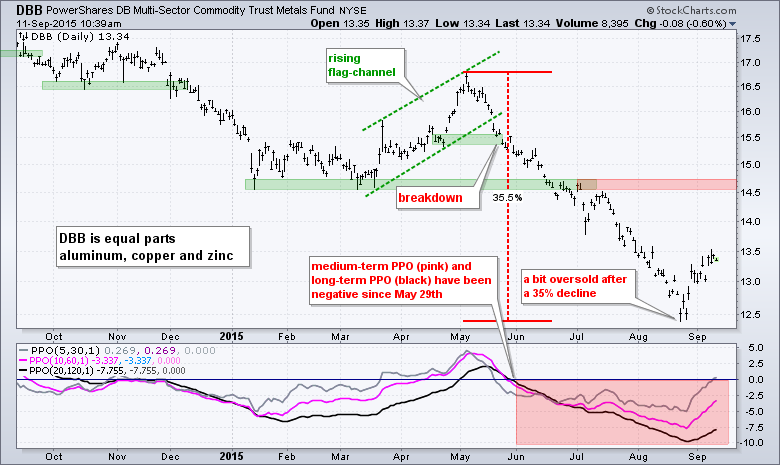
Base Metals and Copper Get Oversold Bounces
The Copper ETN (JJC) surged over 10% from its August low and led the Base Metals ETF (DBB) higher. Despite double digit gains the last two weeks, both remain in bigger downtrends and the current bounce is still just an oversold bounce. JJC broke support in early June and fell over 25% from May to August. After becoming very oversold, the ETF finally got a bounce with a 13% surge to the 29 area. This surge comes off a new low and within a bigger downtrend. In addition, both the medium-term and long-term PPOs are negative. I am setting first resistance in the 32-32.5 area.
******************************************
Thanks for tuning in and have a great weekend!
--Arthur Hill CMT
Plan your Trade and Trade your Plan
*****************************************


