Oversold Bounces Fall Short
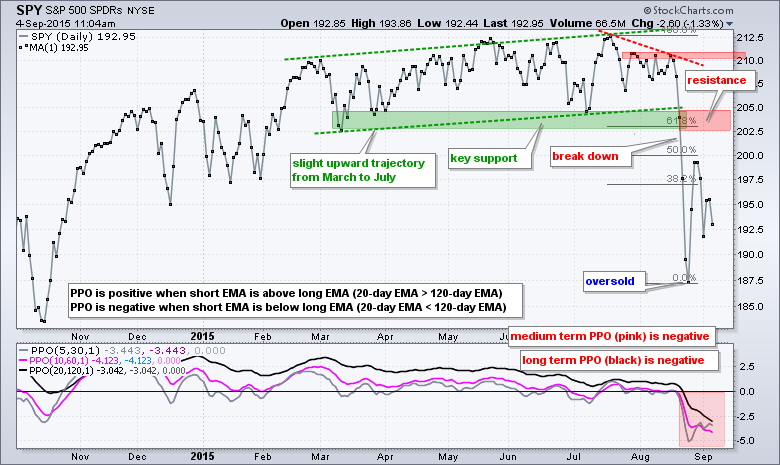
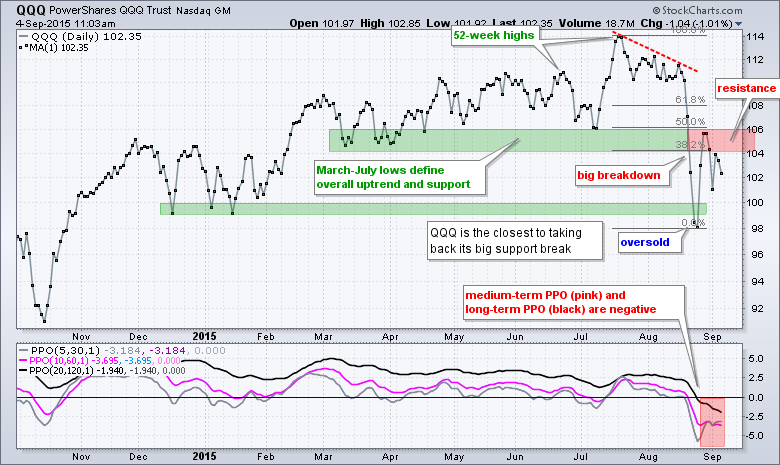
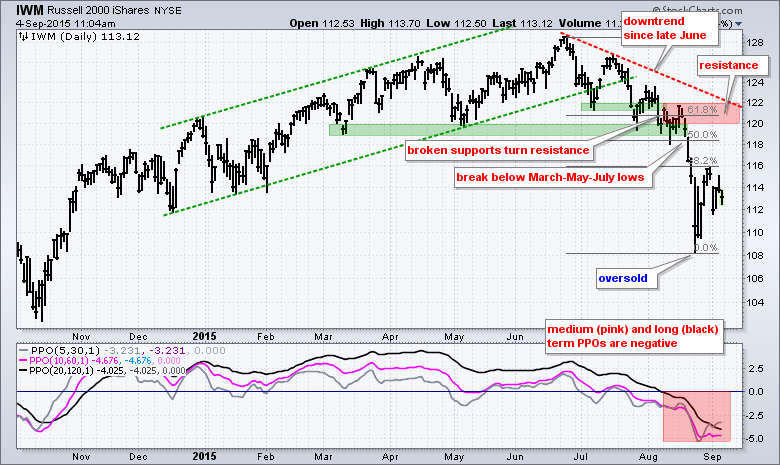
The overall trend remains down for the major index ETFs (QQQ, SPY and IWM). Trading turned volatile with the mid August breakdowns, but the breakdowns remain and these are the dominant feature on most stock-related charts. Current volatility makes it hard to determine what will happen between the August low and the big support break. SPY and the other major index ETFs became very oversold in mid August and then bounced back with retracements ranging from 38.2% to 50%. As the charts show, the Russell 2000 iShares (IWM) had the shallowest bounce and the Nasdaq 100 ETF (QQQ) was the only one to make it back to broken support. This means IWM was the weakest on the rebound and QQQ was the strongest. SPY fell somewhere in the middle. As the charts below illustrate, the March-July lows marked a support zone and broken support zone turns into the first significant resistance zone to watch. A break back above this level is needed before I would consider turning bullish again.
Reviewing October 2014, October 2011 and September 2010
The market does not repeat itself verbatim, but we can study the past to better prepare for the present. Yes, I do mean present because we should chart in the present, not the future. As far as I know, future data points are not available so we cannot use them and I certainly cannot predict the future. As a trend-follower by nature, I am looking at the chart as is and trying to decipher the trend. Once I have determined the trend, I then look for levels, signals and breaks that would prove it otherwise. However, and this is a big HOWEVER, I do not act until a signal or trend-reversing event actually materializes. I will be late to the party and miss the first move, but that is the nature of trend following.
Having clarified that, let's look a three bottoms over the last six years. I chose May-September 2010 (flash-crash), August-October 2011 (European sovereign debt crisis) and October 2014 (Ebola scare) because SPY experienced a very short and sharp decline each time. The ETF took a few months to bottom in 2010 and 2011, but formed a sharp "V" reversal in 2014.
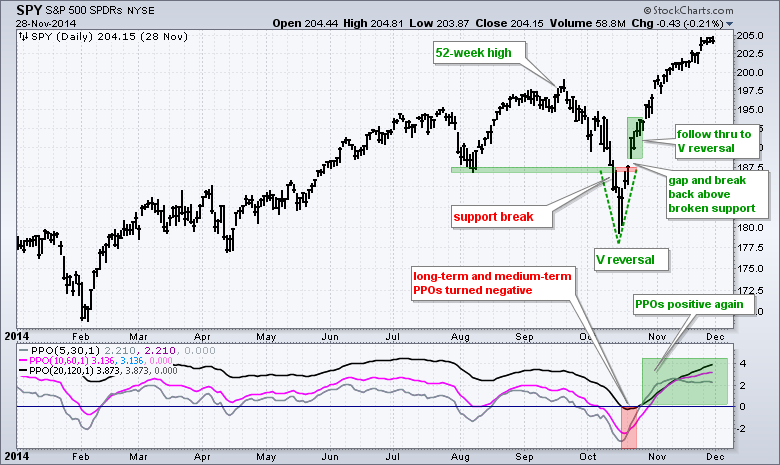
First up is the Ebola-induced break down in October 2014. SPY declined around 10% from the September 19th high to the October 15th low and broke the August low on October 13th. The medium-term PPO (pink) turned negative on October 7th and the long-term PPO (black) turned negative on October 17th. The evidence was clearly bearish in mid October, but this did not last long as a sharp "V" reversal took shape and SPY recovered its support break within a fortnight (two weeks). More importantly, SPY followed through on this reversal with further gains and the PPO turned positive. Thus, the bulls regained the upper hand on October 27th.
The European sovereign debt crisis is associated with the break down in August 2011. SPY fell over 15% in two weeks from late July to early August. The ETF broke support levels in the 114-116 area and all three PPOs were negative by August 5th. Clearly, the evidence was bearish at this stage. A period of horrendous volatility then ensued as SPY produced eight 7+ percent moves in two months (four up and four down). I lost a lot of hair during those two months and it never came back. Despite some big swings, notice that SPY never recovered its support break and established resistance near 114 in late August. The trend did not fully reverse until the breakout in mid October. At this time, the medium-term PPO (10,60,1) was also positive and the evidence was tilting back towards the bulls.
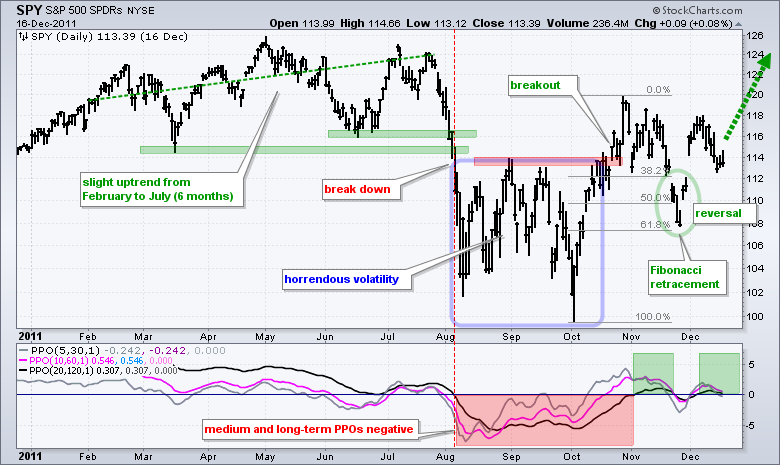
Even though a breakout reverses the downtrend, it is sometimes hard to buy the first breakout and initiate a position after a 15% surge (October low to October high). SPY provided a second chance with the November pullback that retraced 62% and formed an island reversal (green oval).
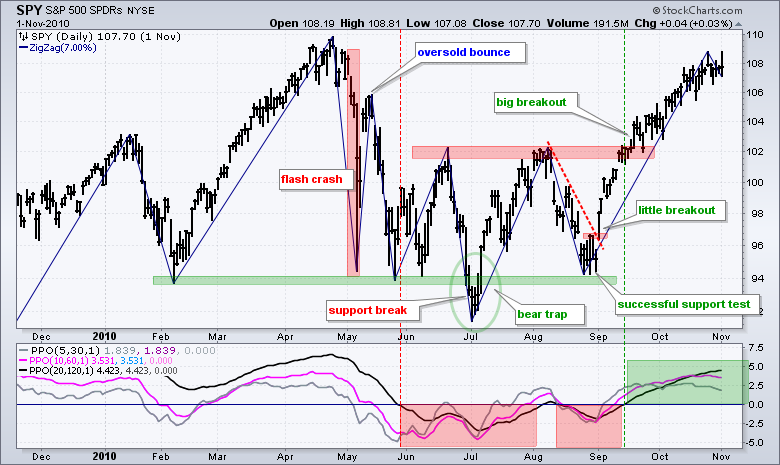
The flash-crash is associated with the break down in May 2010 and a 15+ percent decline in around two months. SPY did not break a major support level until late June when the ETF declined below 94. Note, however, that all three PPOs were negative in late May and this argued for a downtrend. In any case, volatility surged in early May and remained high until August as SPY produced six 7+ percent swings during this period. The first sign of resilience occurred when SPY forged a bear trap. This pattern occurs with a support break and then a quick move back above support to negate the break down. SPY surged to the June high and then fell back to affirm resistance here. The subsequent decline back to the May low marked a successful support test and there was a small breakout in early September. This small breakout led to a bigger breakout as the index exceeded its June-August highs in mid September. The breakout and trend change were clearly valid because all three PPOs were also on board in mid September.
Key Takeaways from Three Bottoms
Volatility does not dissipate overnight. The declines in May 2010 and August 2011 exceeded 15% and volatility remained for another three to four months. The current decline was around 12% from the July closing high to the August closing low. This suggests that we may be in for another 1-2 months of volatility.
Shallow declines are mere pullbacks. The decline in October 2014 was relatively shallow and, therefore, did not last long. SPY declined just 7.4% from the September closing high to the October closing low.
Follow through is important. The first surge after the October 2014 support break was just an oversold bounce. Follow thru with a gap and further gains signaled that something more bullish at work. Though not shown on the chart, a bullish breadth thrust accompanied the "V" reversal in October 2014.
The first challenge for the bulls is to retake broken support. Broken support turned into resistance in October 2014 and August-September 2011. The ability to take back this level showed resilience. Chartists should be watching these broken support zones for the major index ETFs and the sector.
Confirm a reversal with the PPOs. The medium-term PPO (10,60,1) turns positive when the 10-day EMA moves above the 60-day EMA. The long-term PPO (20,120,1) turns positive when the 20-day EMA moves above the 120-EMA. A resistance break and positive medium-term PPO is the first real sign than the trend is actually reversing.
Big Three Sectors Remain Bearish
Today I will run through the equal-weight sector charts because these equal-weight versions represent the performance for the "average" stock in each sector. Of the nine sectors, I consider the consumer discretionary, finance and technology sectors the most important for the health of the broader stock market. The consumer discretionary sector is the most economically sensitive sector and contains restaurants, retailers and auto manufacturers. The finance sector represents the health of the financial system, both internationally and domestically. It is also the second biggest sector in the S&P 500 and the biggest sector in the Russell 2000. The technology sector represents the appetite for risk and the prospects for growth. At 20%, it is also the biggest sector in the S&P 500. At least two of these three need to be in bull mode for the broader market to be in bull mode. All three are in bear mode right now.
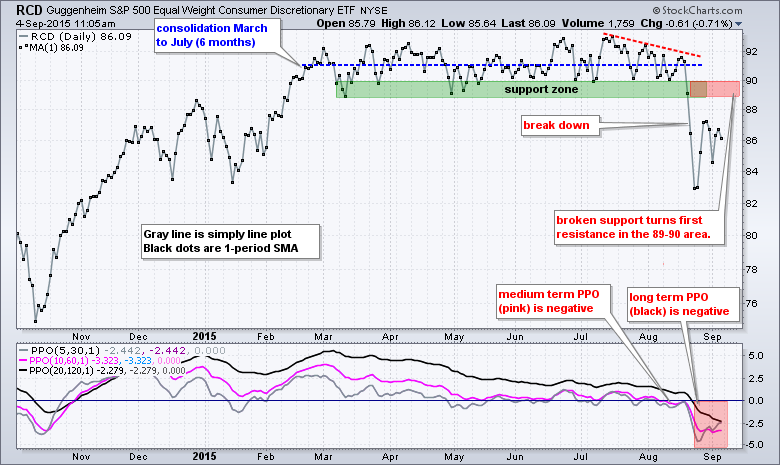
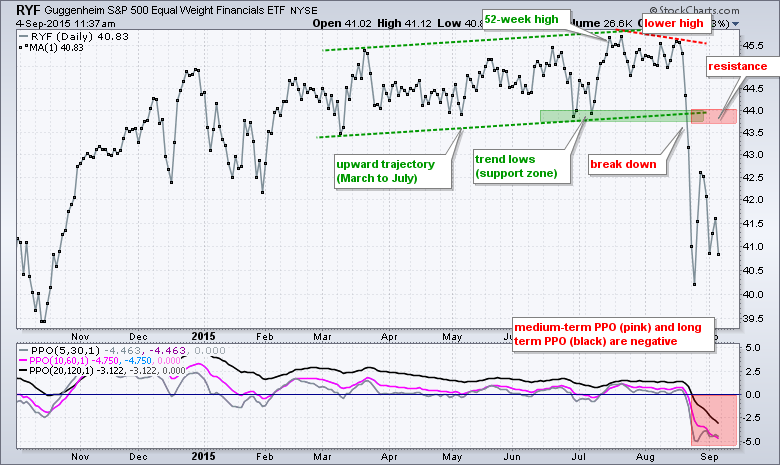
After trading in a tight range for six months, the Equal-Weight Consumer Discretionary ETF (RCD) made a decisive move with a break below support in August. The medium-term PPO was already negative and this support break tilted the balance to the bears on August 21st. The long-term PPO followed with a negative cross on August 24th. Broken support turns resistance in the 89-90 area and RCD must recover this level before thinking bull again. The Equal-weight Finance ETF (RYF) broke down and remains well below broken support and clearly bearish.
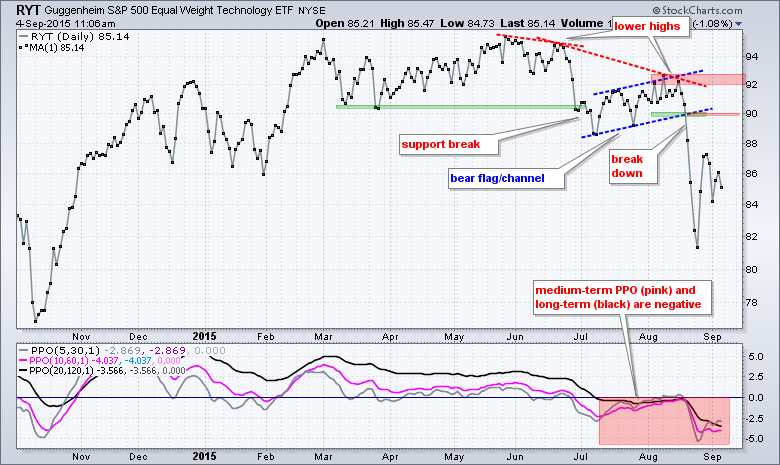
The Equal-weight Technology ETF (RYT) broke down ahead of the other two with a move below the March low in late June and early July. A lower high formed with the rally into August and the ETF broke down again in mid August. Notice that the medium-term PPO (10,60,1) and long-term PPO (20,120,1) have been negative since mid July. There is nothing but downtrend here with 90 as the first level to watch.
Because of the intraday spikes on August 24th, I am forced to use close-only price charts for dozens of ETFs. The charts below show a solid gray line for the "type" of price plot. I added a 1-period SMA in the "style" of black dots to emphasize the daily closing prices.
Defensive Sectors Offer Little Relief
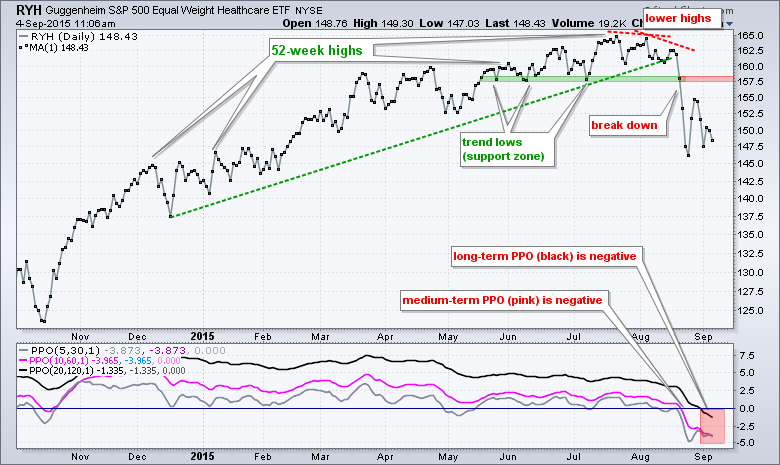
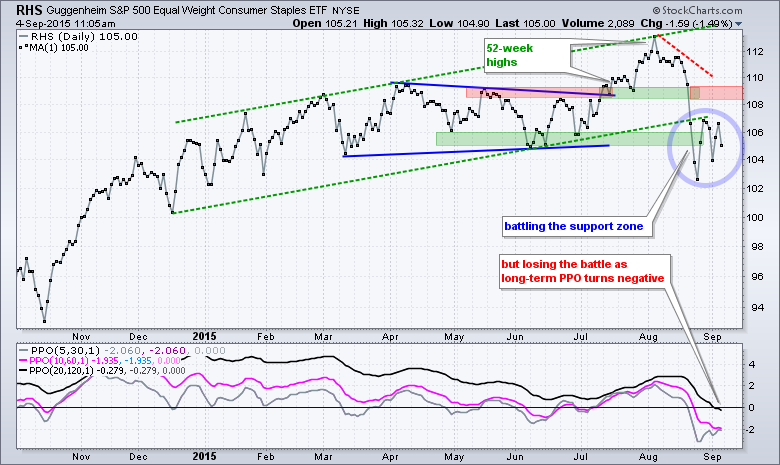
The defensive sectors have also broken down, but consumer staples and healthcare are holding up the best of the nine sectors. This is not a bullish vote, but rather a vote that is just less bearish than the others. The Equal-weight Healthcare ETF (RYH) broke down and remains below the break. The Equal-weight Consumer Staples ETF (RHS) is battling support, but the long-term PPO (20,120,1) just turned negative.
The Three Laggards Continue to Lag
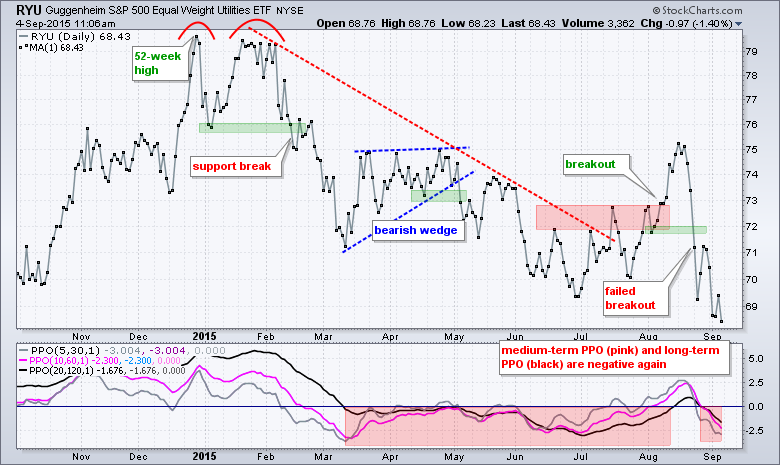
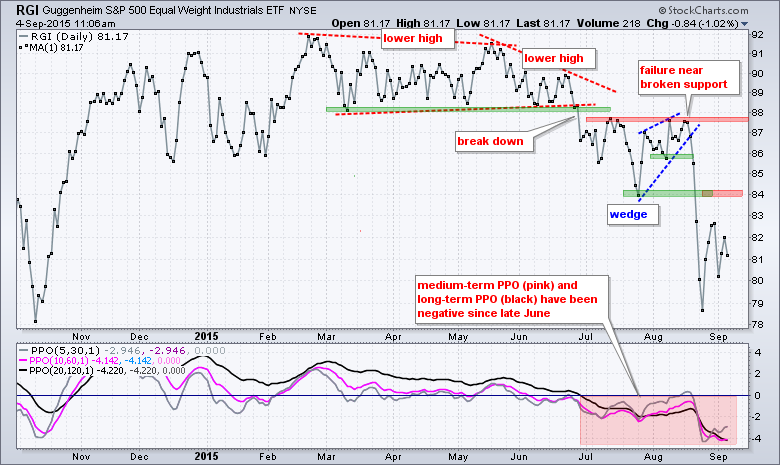
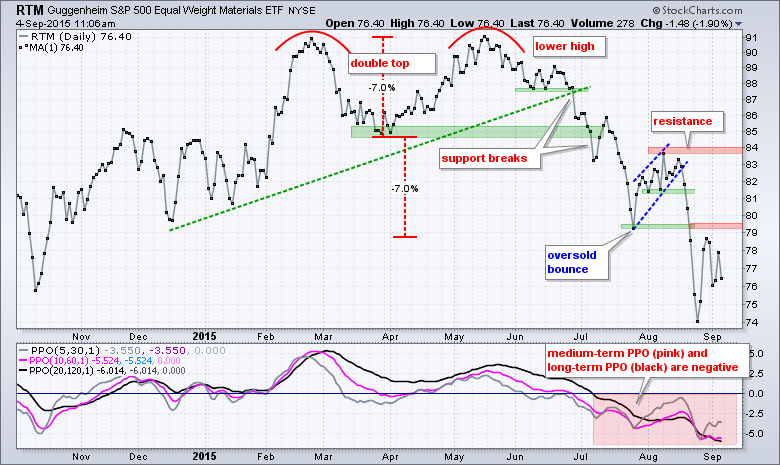
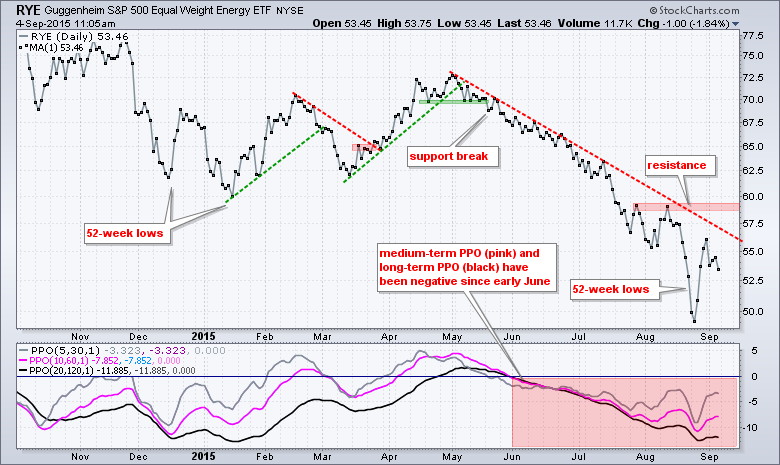
Industrials, energy and materials remain the three weakest sectors overall. The Equal-weight Materials ETF (RTM) and Equal-weight Energy ETF (RYE) hit new 52-week lows in August and remain in clear downtrend. The Equal-weight Industrials ETF (RGI) is close to a 52-week low.
Some Stocks and Industry Groups Holding Up
The stock market remains in the grip of the bears right now. The overall trends for the major index ETFs and the sector ETFs are down. Not just a few, but all of the major index ETFs and all sector ETFs are in downtrends. This tells us that selling pressure was broad based and there are few places to hide. Nobody knows how long these trends will extend. The best I can do is to follow the trend until the bulk of the evidence proves it otherwise.
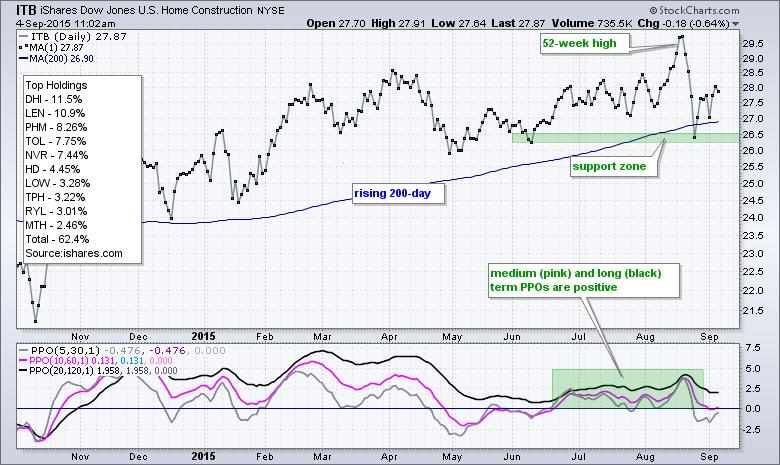
There are some groups showing relative strength and a few industry groups that remain in uptrends. As highlighted earlier this week, the Home Construction iShares (ITB) and Home Builders SPDR (XHB) are still above their rising 200-day moving average and in uptrends. I am not sure how long they can buck the overall selling pressure so chartists should watch support levels closely. Airlines also continue to show relative strength and this group was highlighted in my Wednesday posting.
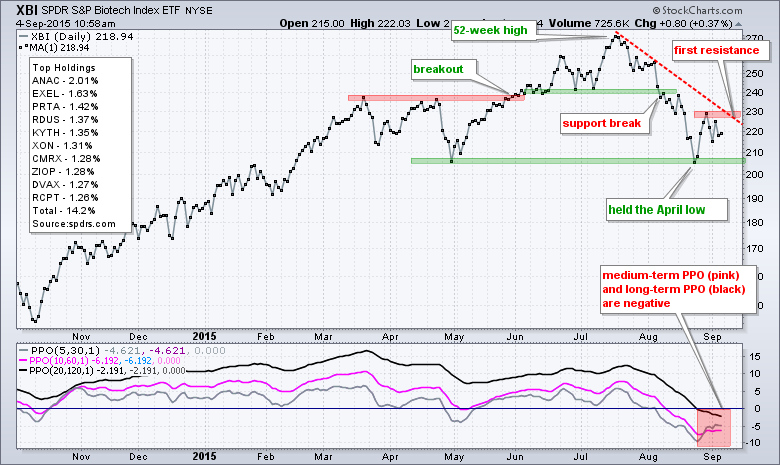
Elsewhere, the Biotech SPDR (XBI) is showing some relative strength the last few months and on Friday. IBB held its April low during the August decline and is up in early trading on Friday. The immediate trend, however, is down and a breakout at 230 is needed before thinking bull. Also note that TASR, SMRT, CALD, ELLI and PANW were featured in Thursday's commentary and all five are up in early trading on Friday. Keep an eye on these charts too.
The following stocks were featuted in the video at the beginning of the commentary: SMRT, TJX, CALD, ELLI, CHKP, PANW, PFPT
**********************************************
Thanks for tuning in and have a great Weekend!
--Arthur Hill CMT
Plan your Trade and Trade your Plan!
**********************************************


