QQQ Shows Relative Strength as Pennant Takes Shape
There are two narratives at work in the stock market and these are reflected on the charts for QQQ, SPY and IWM. First, we have a big support break in August and this break down is medium-term bearish. Broken support zones turn into resistance and a move back above these support breaks is needed to negate the August breakdowns. Second, there was a surge off the August 24th low and then a triangle-pennant type consolidation. Despite the spike low on August 24th, I attempted to define the late August bounce and mark the current triangle-pennant formations. Keep in mind that a triangle after a surge is typically a bullish continuation pattern and a break above last week's high would be short-term bullish. Stock futures are trading sharply higher this morning and breakouts could be in the offing.
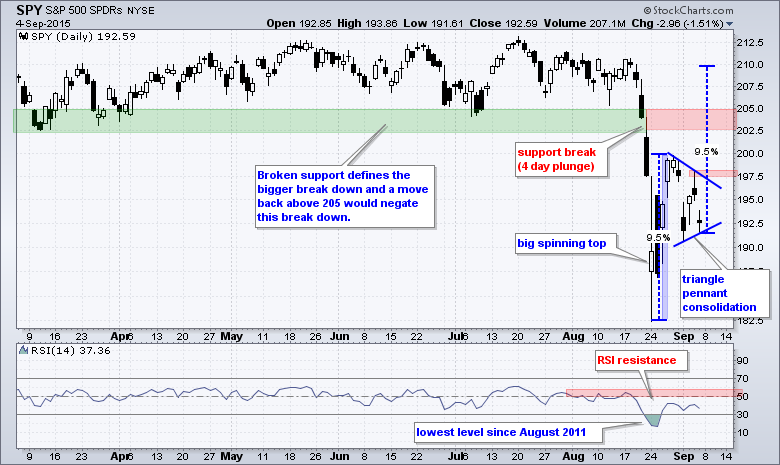
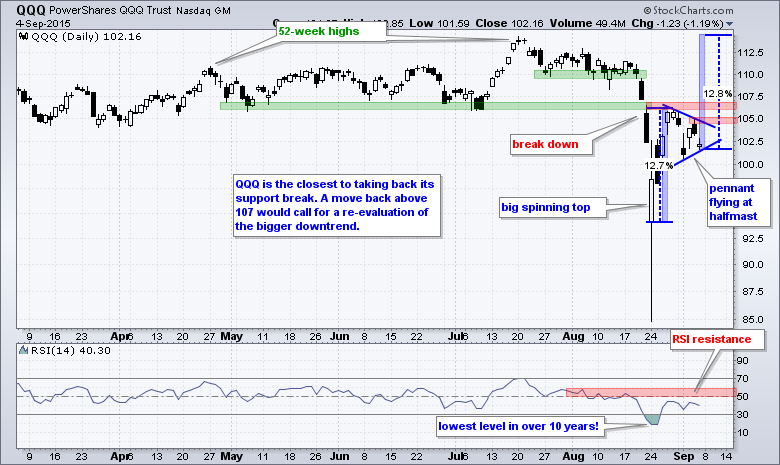
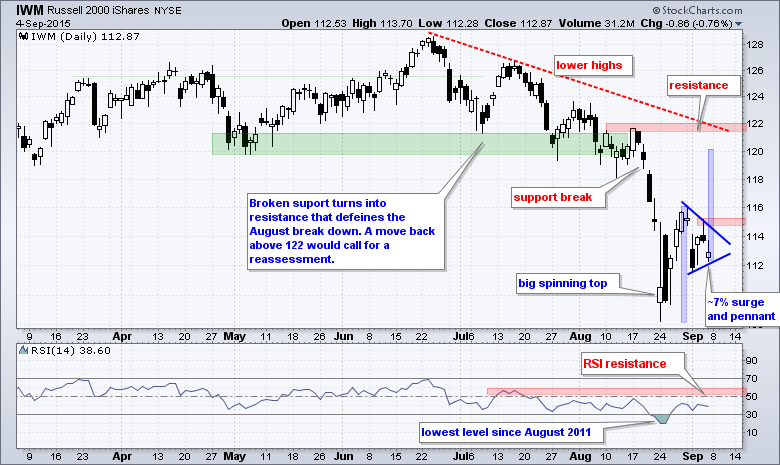
Overall, the medium-term picture remains bearish with the August break down, but the short-term picture is looking bullish with the surge-triangle sequence. This puts the market between a rock and a hard place, and could mean volatility is here to stay. I think QQQ is the strongest of the big three because it is the closest to negating its August support break. I also estimated the August surge and applied it to Friday's low to guesstimate the upside target after a pennant breakout. Regardless of the target, a strong breakout should hold and chartists can mark support at Friday's low. A break below this level would negate the pennant breakout and put the bears back in the driver's seat.
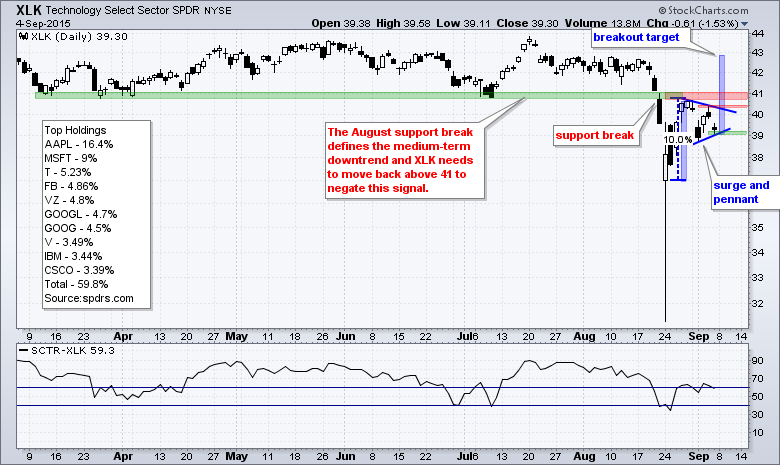
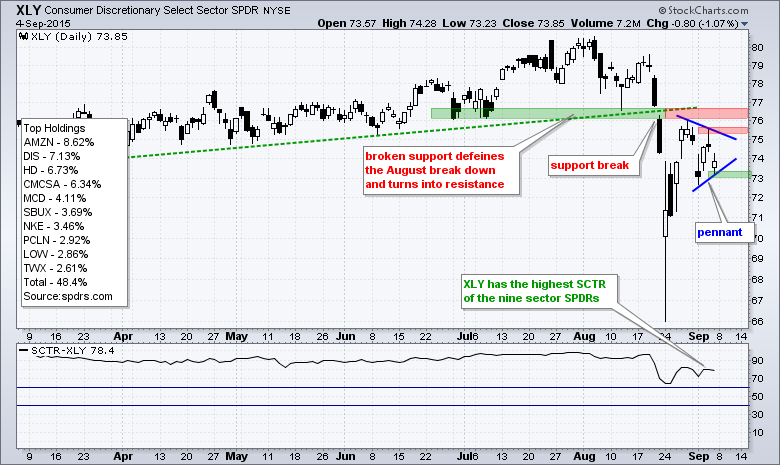
XLY and XLK are Close to Negating August Breakdowns
The Consumer Discretionary SPDR (XLY) and the Technology SPDR (XLK) sport patterns similar to the major index ETFs. Both broke down in August, surged off the August 24th lows and then formed pennant consolidations the last five days. A move above last week's high would break pennant resistance and signal a continuation of the August bounce. Such a breakout may even be strong enough to negate the August support breaks, which would call for a reassessment of the medium-term downtrends in XLY and XLK.
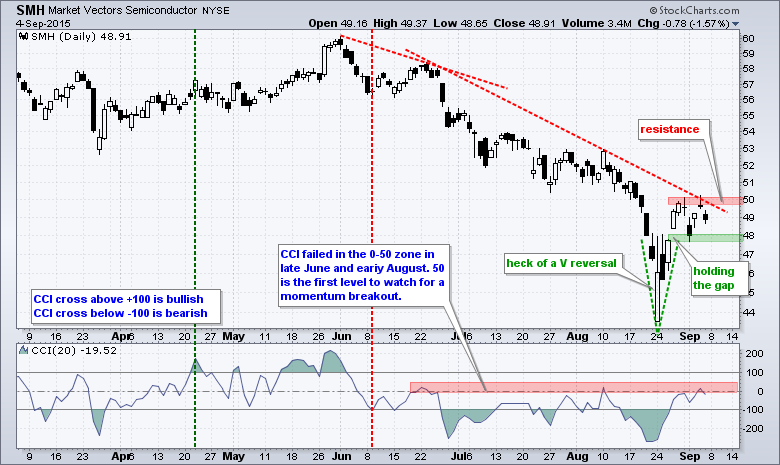
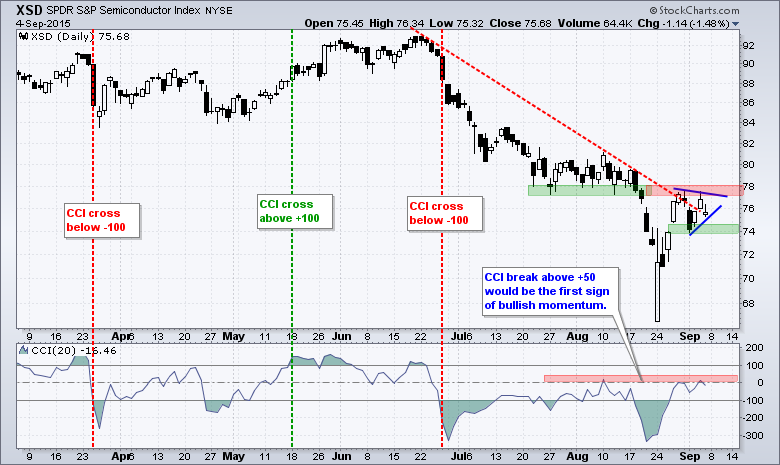
Semiconductor ETFs Stall Near Resistance
Even though the Semiconductor ETF (SMH) and Semiconductor SPDR (XSD) have been showing relative weakness the last few months, they are showing some relative strength the last two weeks and held up well last week. SMH forged a "V" reversal with a surge to resistance in the 50 area. Notice that the ETF fell back on Friday, but the dip was much shallower than other dips because the ETF held well above Monday's low. Also notice that a pennant is not forming because SMH exceeded the 31-August high on Thursday. A breakout at 50.2 on the price chart and 50 for CCI would be bullish. XSD has similar chart features with resistance at 78.
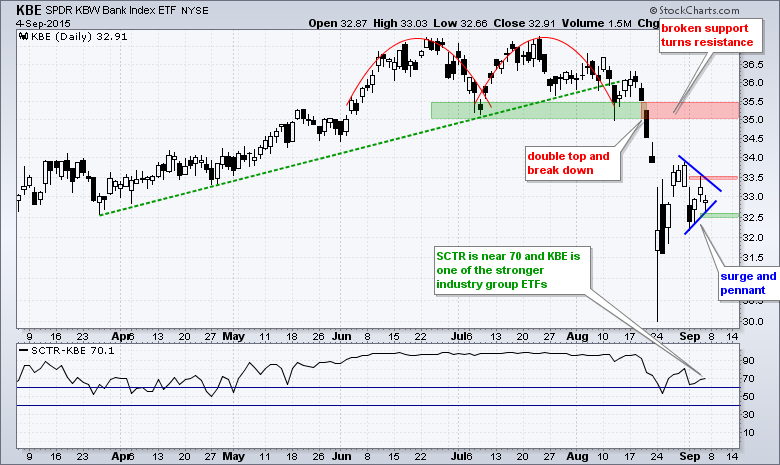
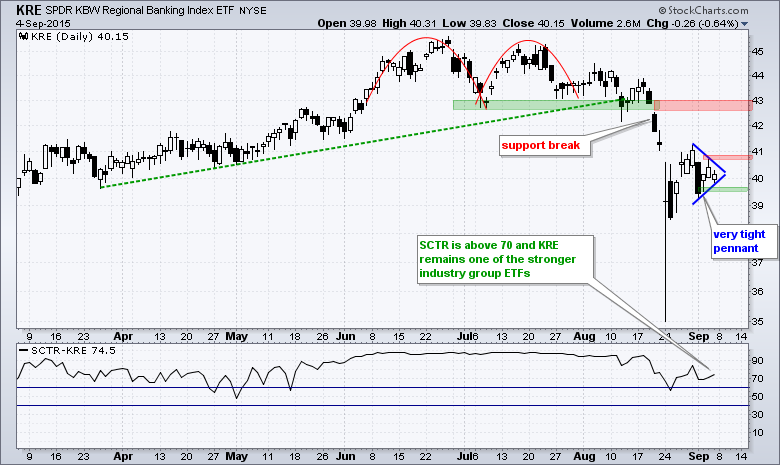
Bank ETFs Join the Pennant Club
Banks represent another key group to watch in the coming days, especially with a Fed meeting on the burner. The Bank SPDR (KBE) and the Regional Bank SPDR (KRE) were both slammed in August and broke key support levels. As with the major index ETFs, these broken support zones turn into the first medium-term level to watch for a breakout that would negate the August break down. Shorter-term, KRE and KBE bounced off their August lows and also formed pennants last week. Look for a break above Friday's high to extend the oversold bounce.
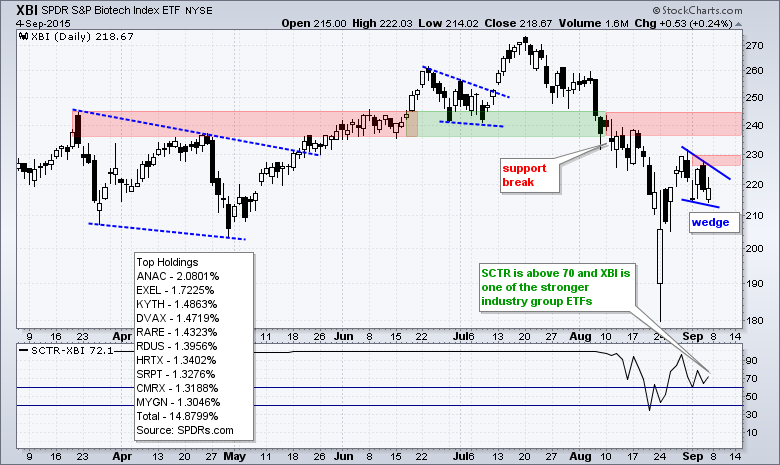
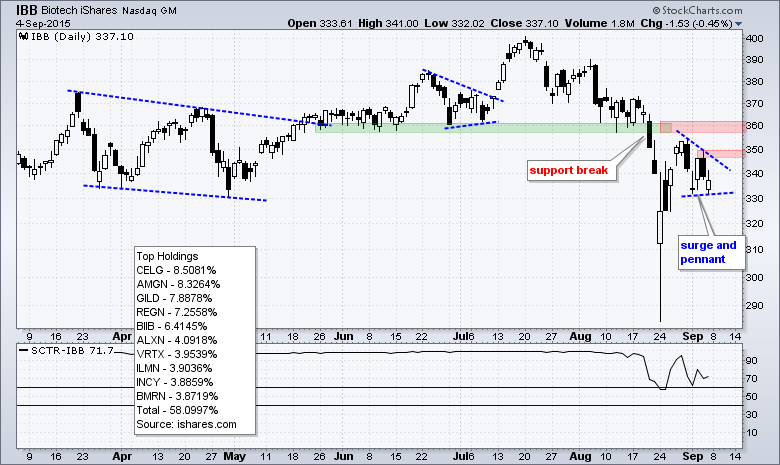
Biotech SCTRs Show Relative Strength
The Biotech SPDR (XBI) and the Biotech iShares (IBB) are also holding up well because their SCTRs are above 70. SCTRs above 70 indicate that the ETF is in the top 30% for performance in our ETF universe, which excludes inverse and leveraged ETFs. XBI surged in late August and then formed a falling wedge the last five days. This looks like a small correction and a breakout at 230 would signal a continuation of the August surge. The August support break is still the dominant chart feature here and follow through above 245 is needed to negate this bigger break down.
Airlines, Housing and Retail Still Strong
Airlines, housing and retail represent three cyclical industry groups with a large domestic focus. Strength in these three would suggest strength in the broader US economy and this would be positive for stocks.
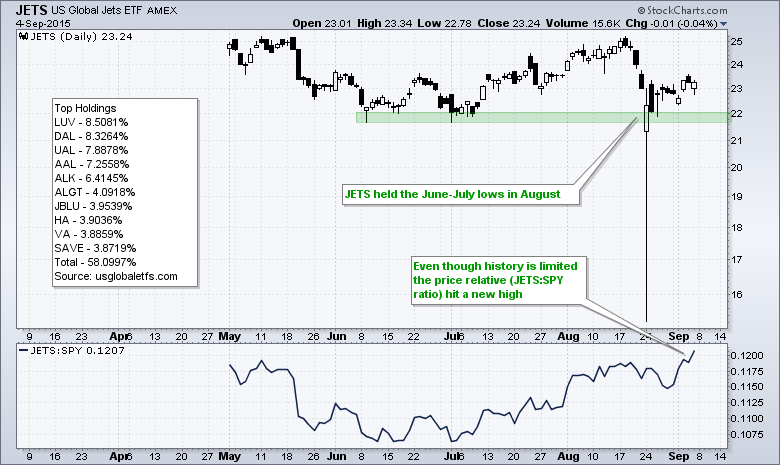
The Airline ETF (JETS) has a limited history because it started trading on May 1st and this means the SCTR is not yet available. Chartists can, however, measure relative performance with a ratio plot (JETS:SPY) in the indicator window. Notice that this ratio hit a new high and this means JETS is outperforming SPY (relative strength). The ETF also held the July lows in August (closing basis) and showed relative strength with a gain last week.
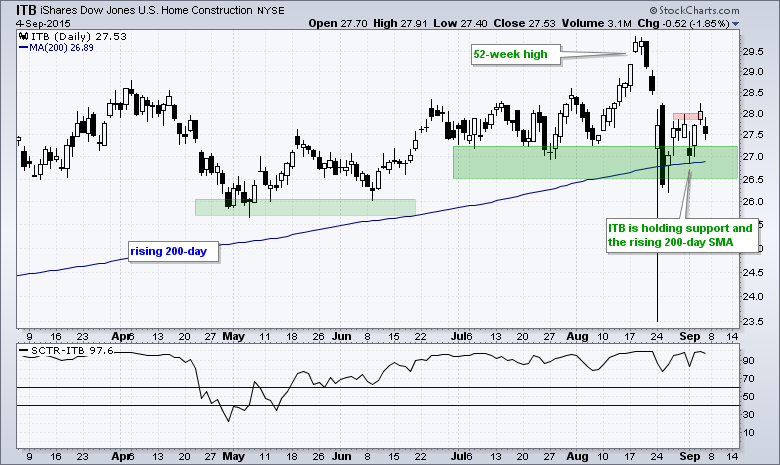
There are clearly some weak spots in the market, but the Home Construction iShares (ITB) remains one of the strongest industry group ETFs according to the StockCharts Technical Rank (SCTR) because it is currently above 95. On the price chart, ITB held its rising 200-day moving average this month and the support zone in the 26.5-27 area.
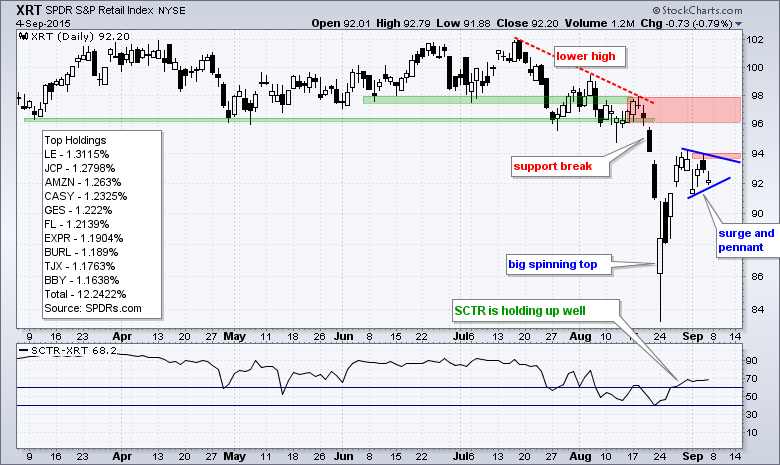
The Retail SPDR (XRT) is also holding up pretty well because the SCTR is at 68. It is not one of the strongest, but neither is it one of the weakest. On the price chart, XRT surged and formed a rather tight pennant. A breakout at 94 would be short-term bullish.
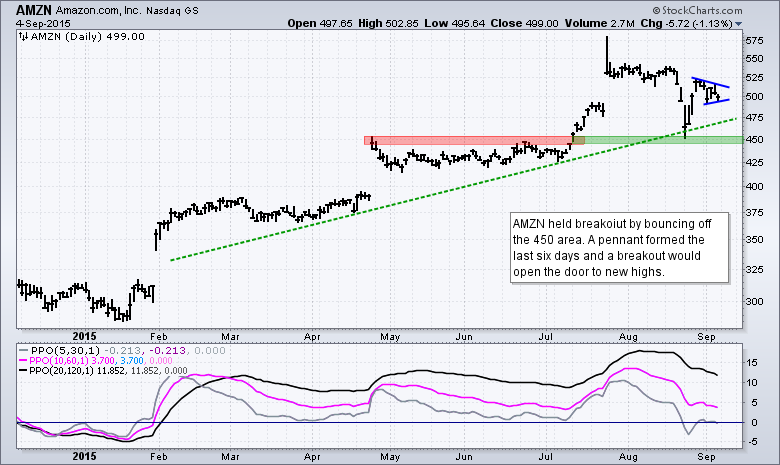
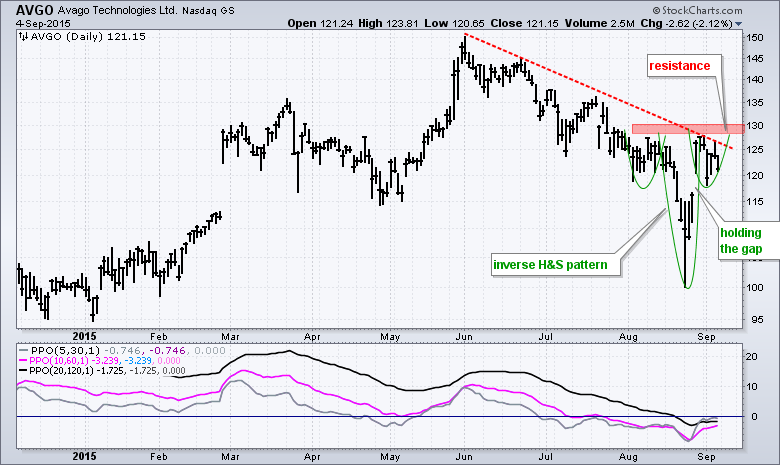
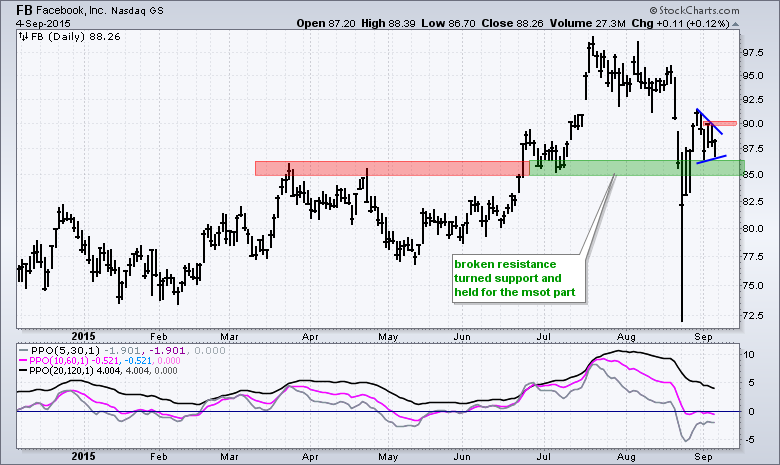
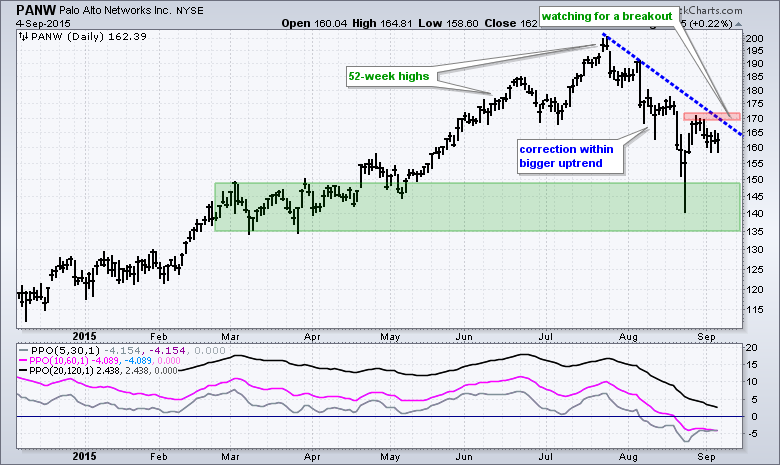
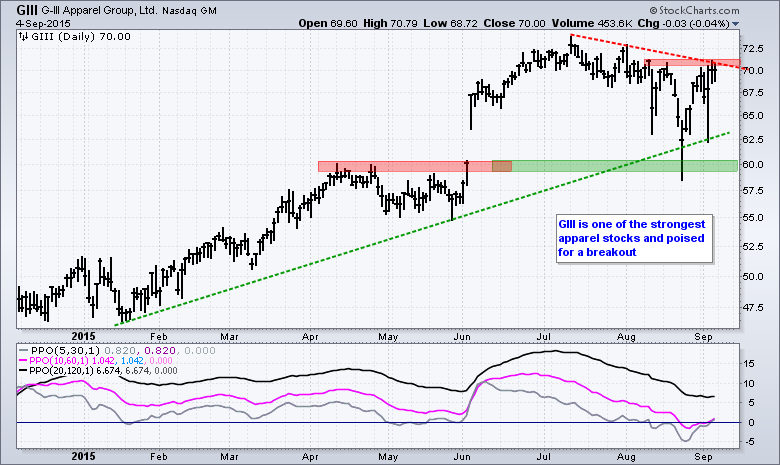
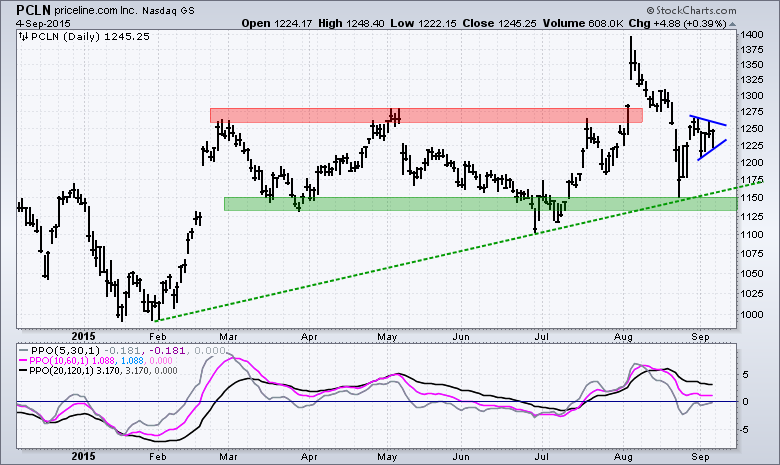
Stocks worth Watching (AMZN, AVGO, FB, PANW, GIII, PCLN)
******************************************
Plan your Trade and Trade your Plan!
--Arthur Hill CMT
******************************************


