Stock futures are sharply lower on Tuesday morning and this means the oversold bounce is failing below the support break for the major index ETFs, sector ETFs and most industry group ETFs. Stocks became very oversold in mid August and then rebounded with sharp rallies last week. The deeper the decline and the more oversold the security, the steeper the oversold bounce. It is hard to say what will happen day-to-day because of the volatility. Chartists should just keep in mind that the trends for the major index ETFs reversed in August and all nine sectors are in downtrends as well. This means the "stock" market is in a downtrend and this is the dominant force at work for most stocks. There will be some stocks that buck the trend and rise, but finding them will be a serious challenge because some 80% of stocks follow the broader market. What's more, correlations tend to rise during a crisis-type decline and that is what we saw in August. The decline hit all sectors, most industry groups, most international stock indices and most stocks. There are few places to hide and cash looks pretty good relative to a downtrend.
Webinar Details:
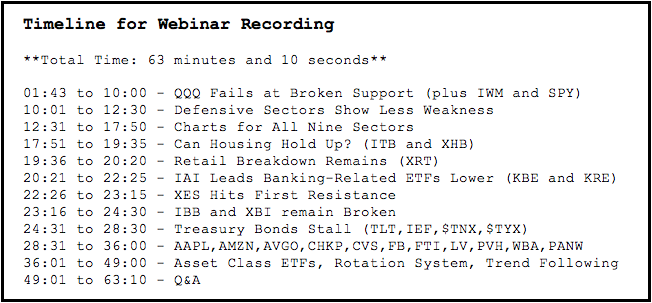
Today's Commentary and Charts
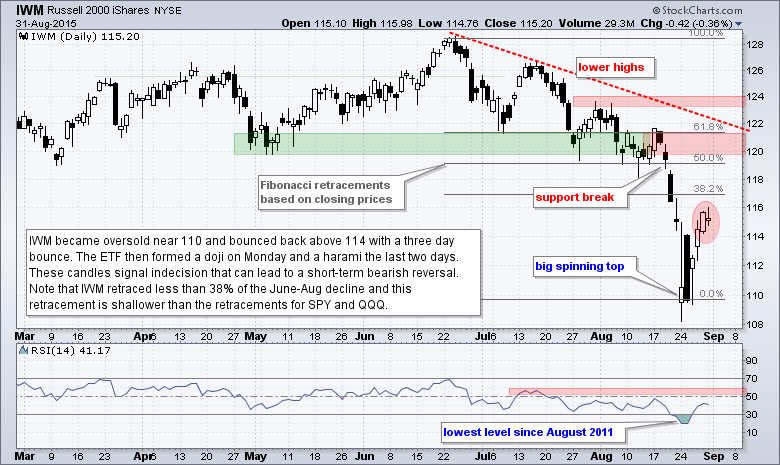
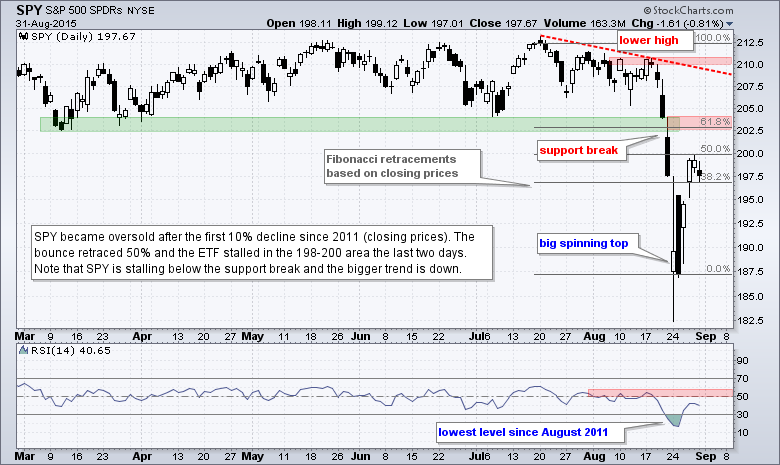
- QQQ Fails at Broken Support (plus IWM and SPY)
- Defensive Sectors Show Less Weakness
- Charts for All Nine Sectors
- Can Housing Hold Up? (ITB and XHB)
- Retal Breakdown Remains (XRT)
- IAI Leads Banking-Related ETFs Lower (KBE and KRE)
- XES Hits First Resistance
- IBB and XBI remain Broken
- Asset Class ETFs
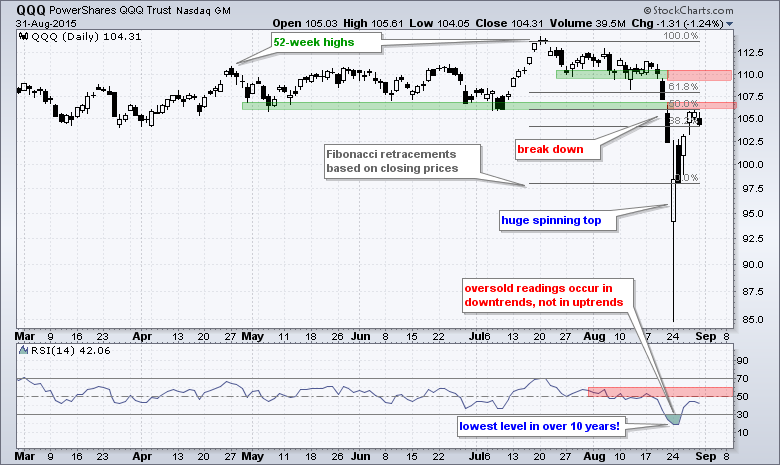
QQQ Fails at Broken Support
QQQ formed a huge spinning top on August 24th. Bounced back to the 106 area last week and backed off a little on Monday. Notice that broken support marks resistance here and the 50% retracement marks a potential reversal zone in he 106 area. Because of recent volatility, I decided to draw the Fibonacci Retracements Tool from the July closing high to the August closing low.
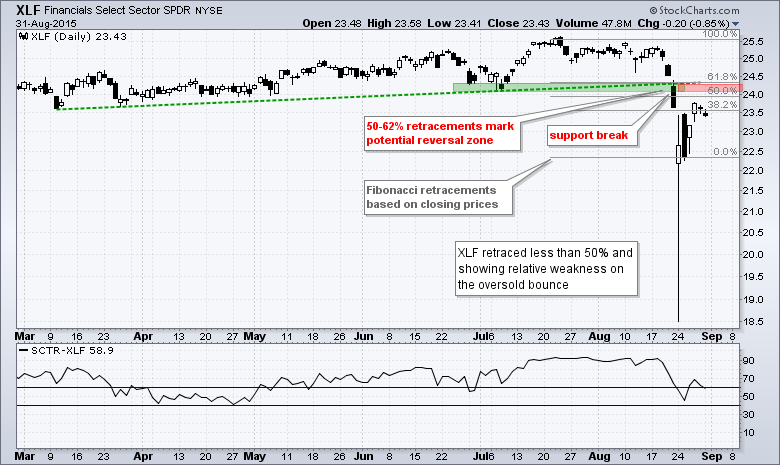
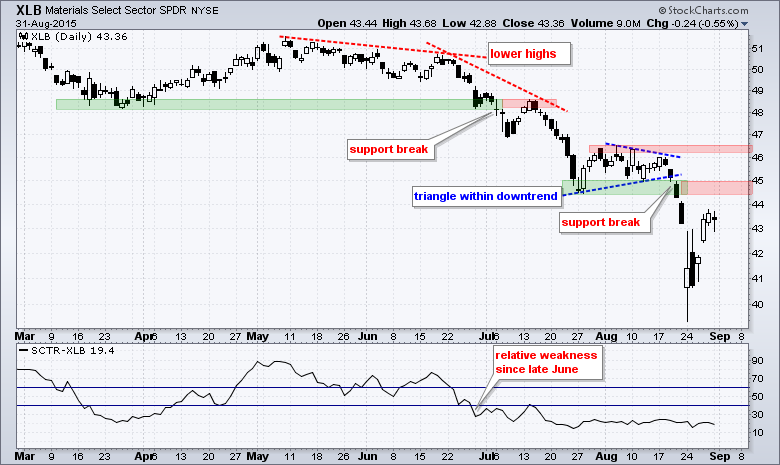
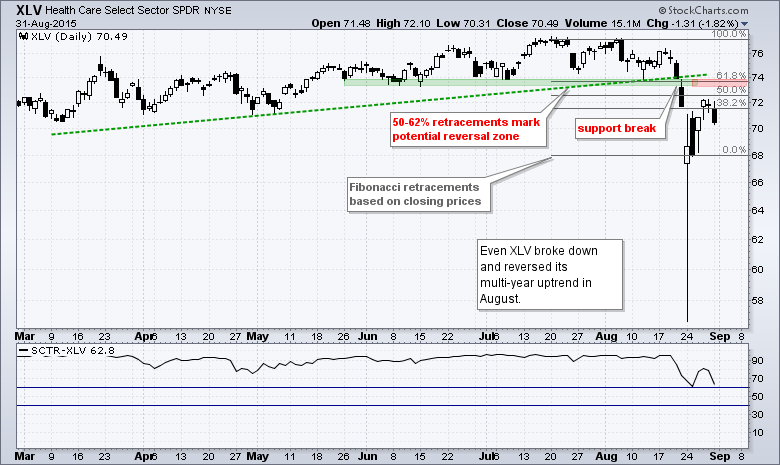
Defensive Sectors Show Less Weakness
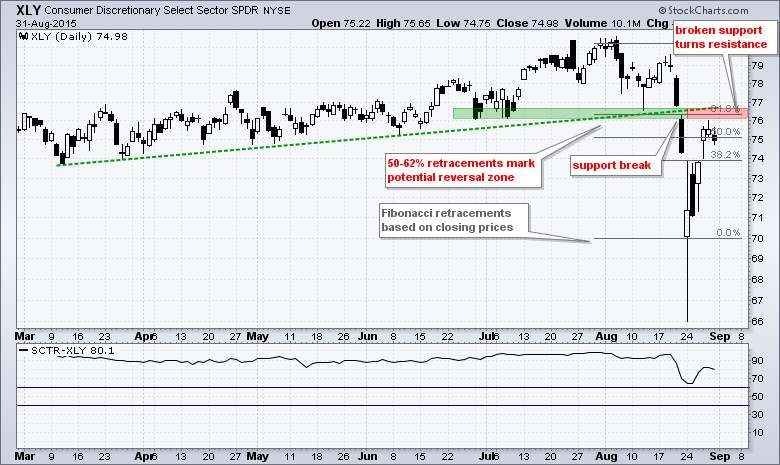
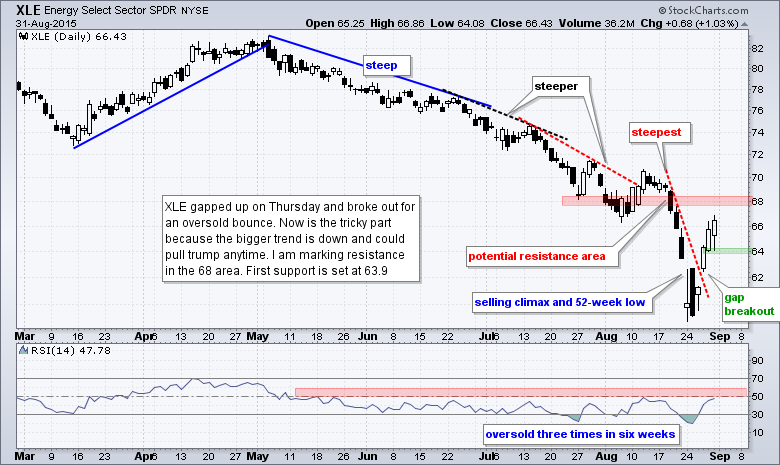
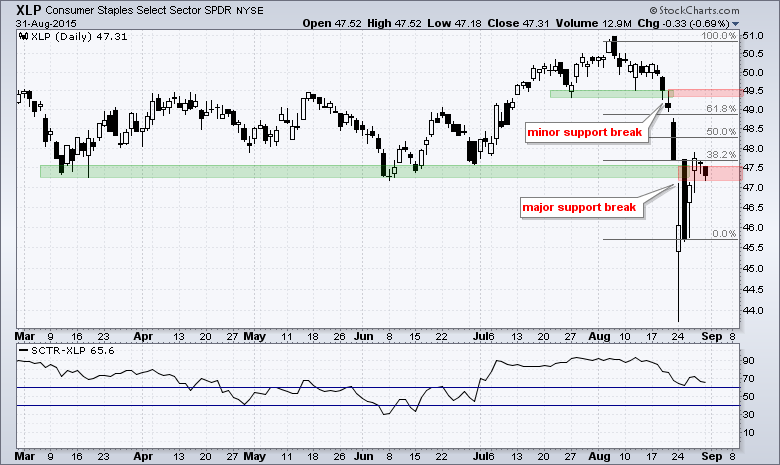
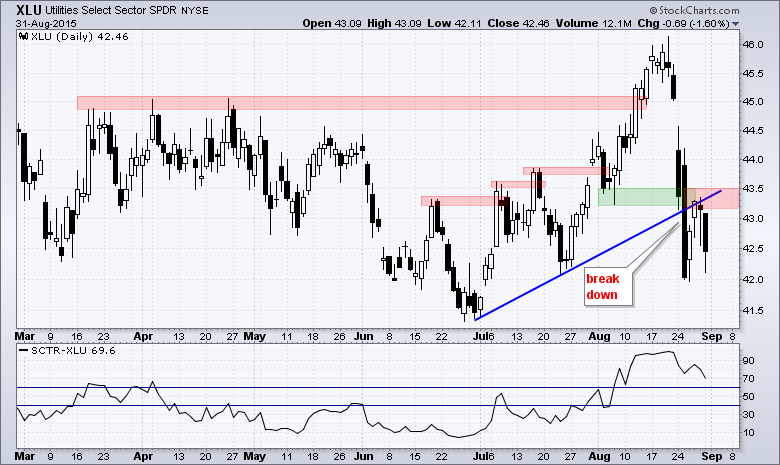
The table below shows the nine sector SPDRs and the nine equal-weight sectors sorted by the StockCharts Technical Rank (SCTR). With the exception of XLY, the top ranked sectors are all defensive (consumer staples, healthcare and utilities). Even though these three sectors are holding up the best, they are clearly not immune to selling pressure and all six declined rather sharply in August. This is perhaps the most disconcerting development in August: all sectors declined and none were spared. The energy sector held up relatively well in August, but that was because XLE and RYE surged over the last three days. Both remain in downtrends and their SCTRs are below 20.
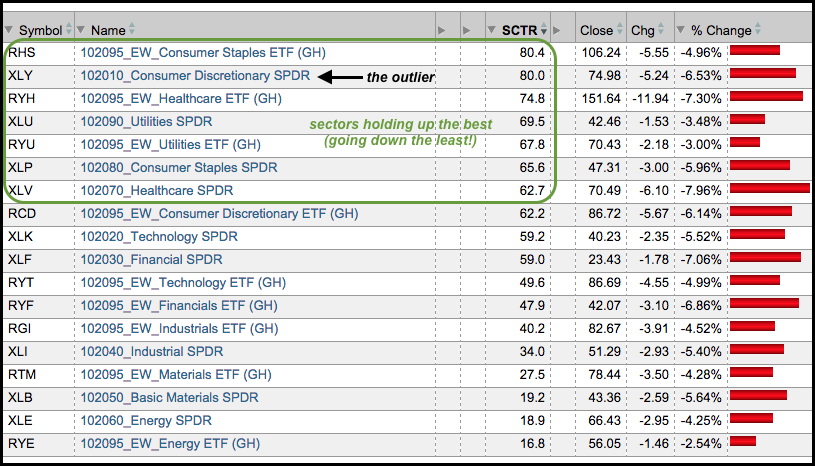
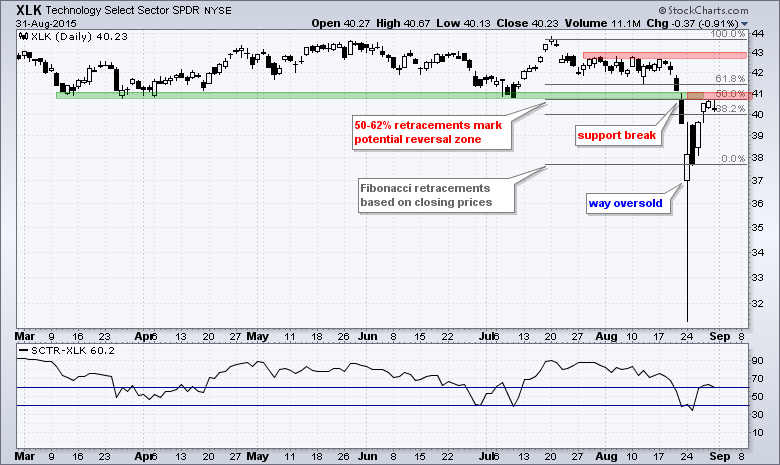
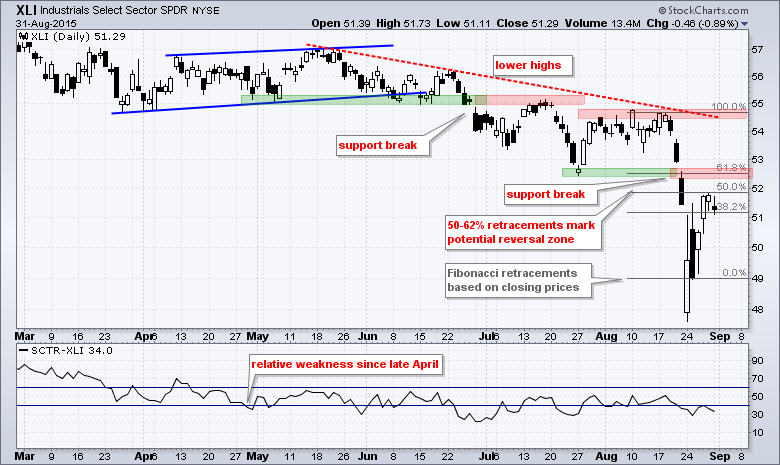
As the charts below show, all nine sector SPDRs broke key supports in August and all are in downtrends. There were oversold bounces last week, but these are already hitting their first Fibonacci retracements and stalling below broken support. The August support breaks are the dominant chart features and they are bearish until proven otherwise.
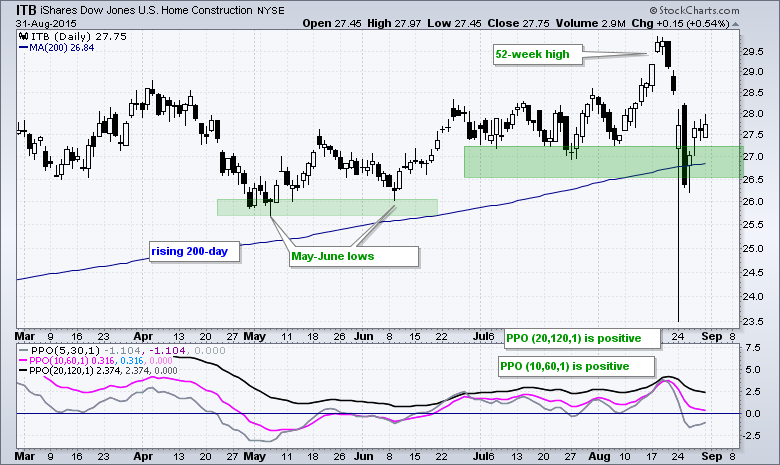
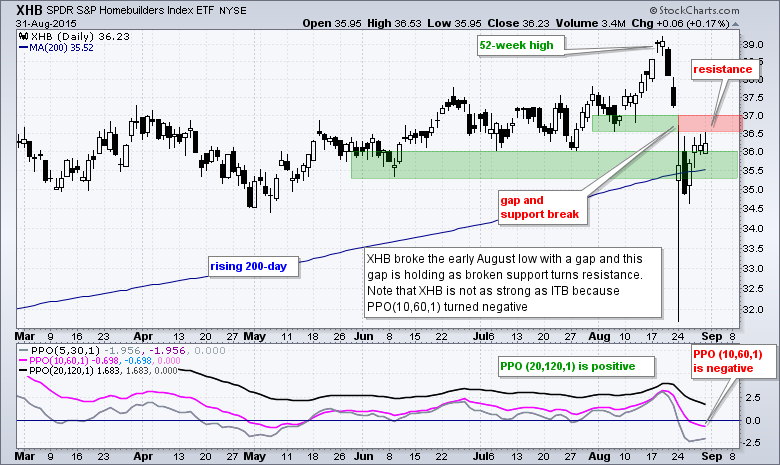
Can Housing Hold Up?
The Home Construction iShares (ITB) is holding up relatively well, but the broader market and the sector are not. ITB found support near the rising 200-day moving average and the July lows, and remains in an uptrend overall. However, weakness in the broader market and the sector could ultimately prevail here. I am marking a support zone in the 26.5-27 area. A close below this level would likely turn the tide for ITB.
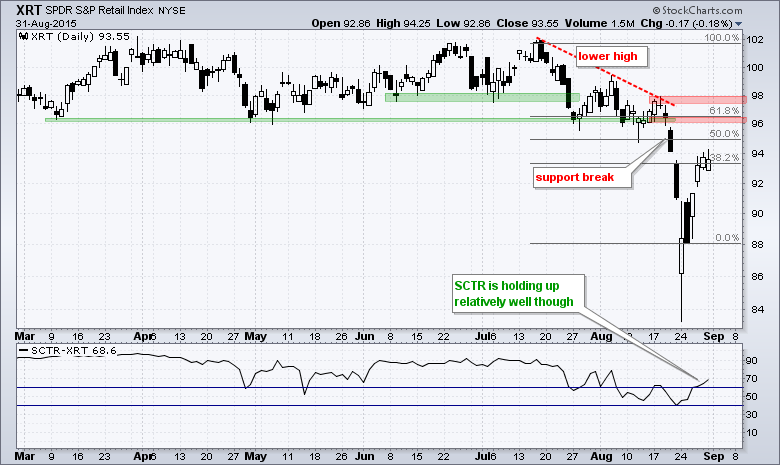
Retail Breakdown Remains
The Retail SPDR (XRT) broke down in August and then retraced around 38% with the bounce back to 94. The break down rules the roost right now and it is bearish. Broken support turns first resistance in the 96 area. Even though this chart is bearish overall, the StockCharts Technical Rank (SCTR) is holding up relatively well. Note that I use 40 for my relative weakness threshold and 60 for my relative strength threshold. A break above 60 shows relative strength and this remains until negated with a break below 40. The SCTR did not break below 40 in mid August and is already back near 70. This may be one to watch if-when the broader market and sector improve.
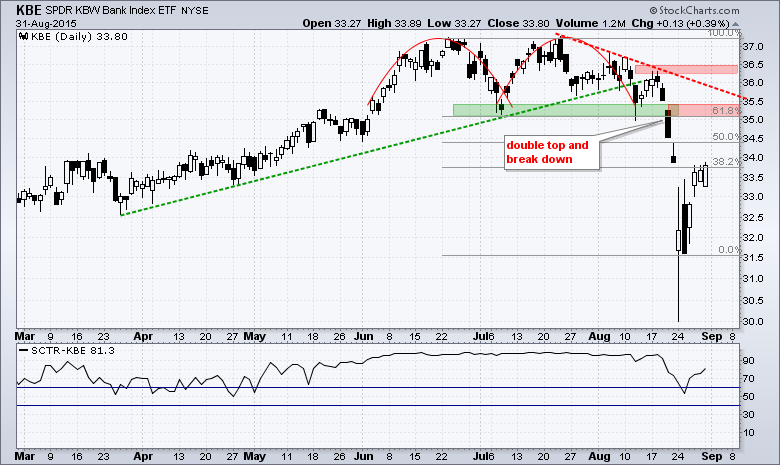
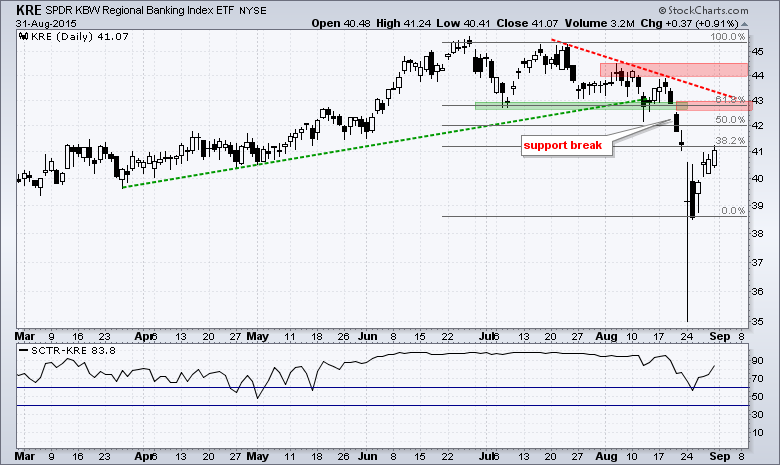
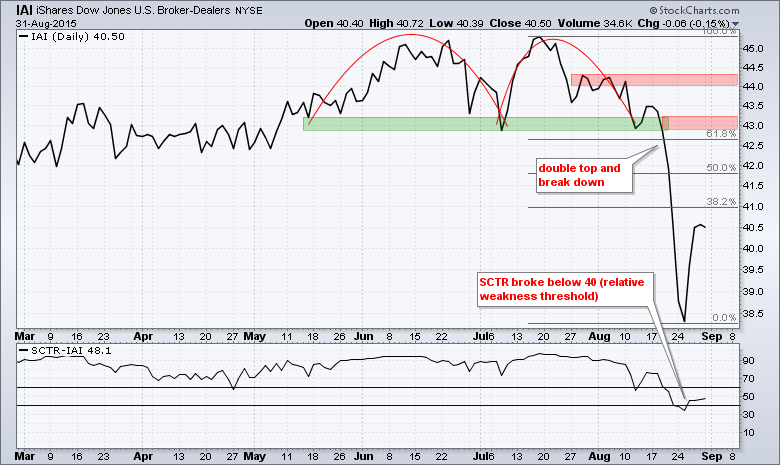
IAI Leads Banking-Related ETFs Lower
The break down in banking-related ETFs is another bearish development for the broader market. These ETFs were leading the market in June-July and have clearly broken down. This is negative for the finance sector and the finance sector is still the second biggest sector in the S&P 500 and the biggest sector in the Russell 2000. The Bank SPDR (KBE) broke double top support with the August decline and broken support turns first resistance. The 62% retracement zone also resides in this area, but it looks like KBE will not make it that high because stock futures are down sharply this morning.
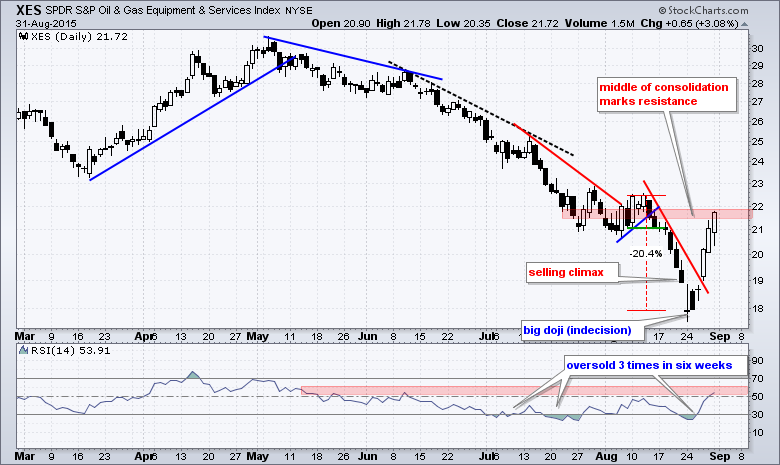
XES Hits First Resistance
The Oil & Gas Equip & Services SPDR (XES) led the market higher the last five days with a 20% surge. In fact, the ETF closed positive for the month of August. Despite relative strength over the past week and past month, the overall trend remains down and short-term resistance is nigh. The middle of the consolidation from mid July to mid August marks resistance in the 21.5-22 area. Also notice that RSI moved into its resistance zone (50-60).
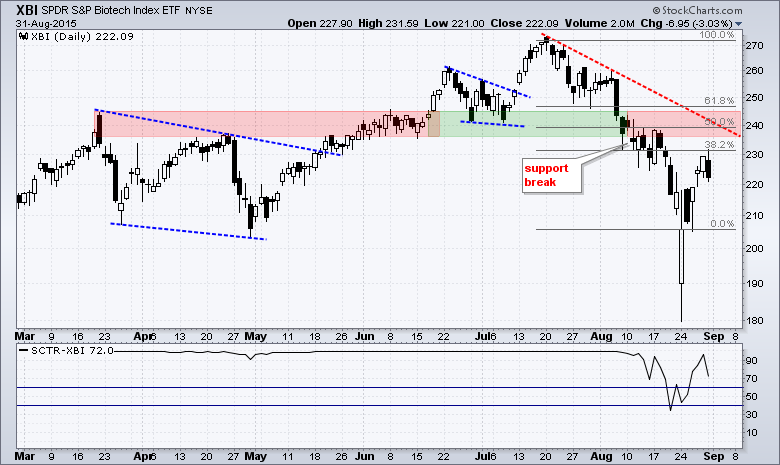
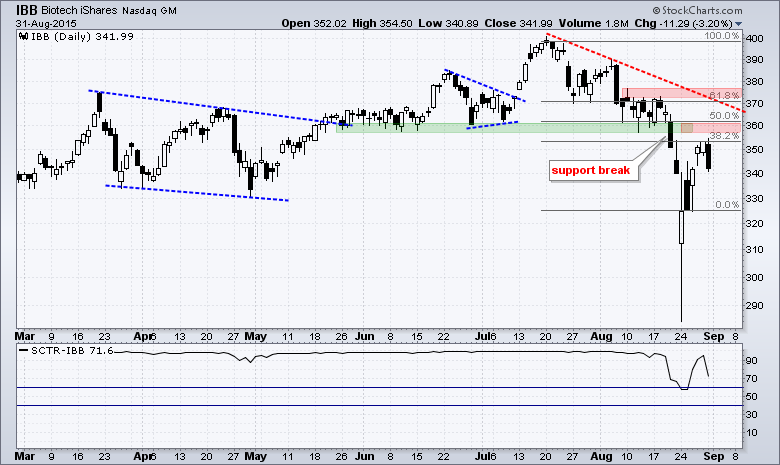
IBB and XBI remain Broken
Biotechs were also leading the market in July and they also broke down in August. XBI broke support the second week of August and fell to a six month low on August 24th. As with the rest of the market, the ETF got an oversold bounce last week and retraced a portion of the prior decline. This is clearly not enough to negate the support break, which turns first resistance in the 240 area.
Asset Class Symbols and ETFs
Here is a list of symbols and asset class ETFs. The name is preceded with asset_ and the type asset (asset_stocks_).
SPY,asset_stocks_S&P 500 SPDR
IWM,asset_stocks_Russell 2000 (iShares)
EEM,asset_stocks_Emerging Markets (iShares)
VPL,asset_stocks_Pacific VIPERS (Vanguard)
VGK,asset_stocks_European VIPERS (Vanguard)
ILF,asset_stocks_Latin America 40 (iShares)
AGG,asset_bonds_Aggregate Bond ETF (AGG)
LQD,asset_bonds_Investment Grade Bond ETF (LQD)
TLT,asset_bonds_20+ YR T-Bond ETF (TLT)
TIP,asset_bonds_TIPS Bond Fund (iShares)
EMB,asset_bonds_Emerging Markets Bond Fund (iShares)
MUB,asset_bonds_S&P National Municiple Bond Fund (iShares)
DJP,asset_comm_Commodity Index ETN (DJP)
GLD,asset_comm_Gold SPDR (GLD)
DBB,asset_comm_Base Metals ETF (DBB)
USO,asset_comm_USO Oil Fund (USO)
DBA,asset_comm_Agriculture ETF (DBA)
UUP,asset_curr_US Dollar Bullish ETF (UUP)
FXE,asset_curr_Euro ETF (FXE)
FXY,asset_curr_Yen ETF (FXY)
FXA,asset_curr_Australian Dollar ETF (FXA)
FXF,asset_curr_Swiss Franc ETF (FXF)
VNQ,asset _reits_REIT VIPERS (VG)
VNQI,asset _reits_Globalex-US REIT (VNQI)
PSP,asset_alt_Global Listed Private Equity (PS)
WDTI,asset_alt_Managed Futures Strategy Fund (WT)
QAI,asset_alt_Hedge Multi-Strategy Tracker (IQ)
HYLS,asset_alt_High Yield Long/Short ETF (FT)
**********************************************
Plan your Trade and Trade your Plan!
--Arthur Hill CMT


