Setting Upside Targets for the Big 3
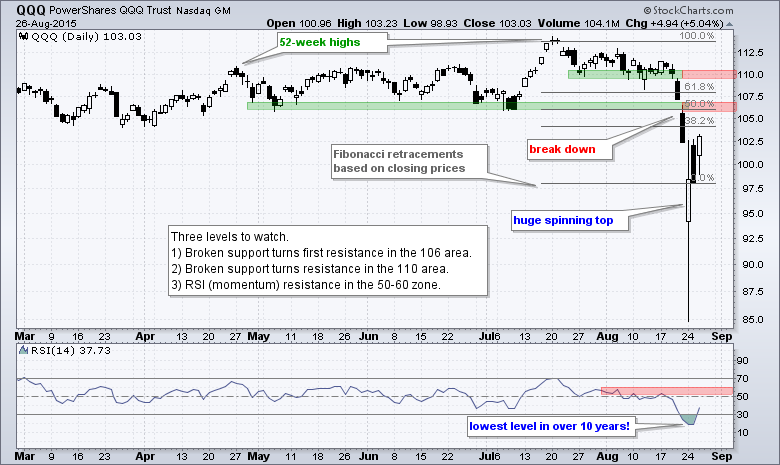
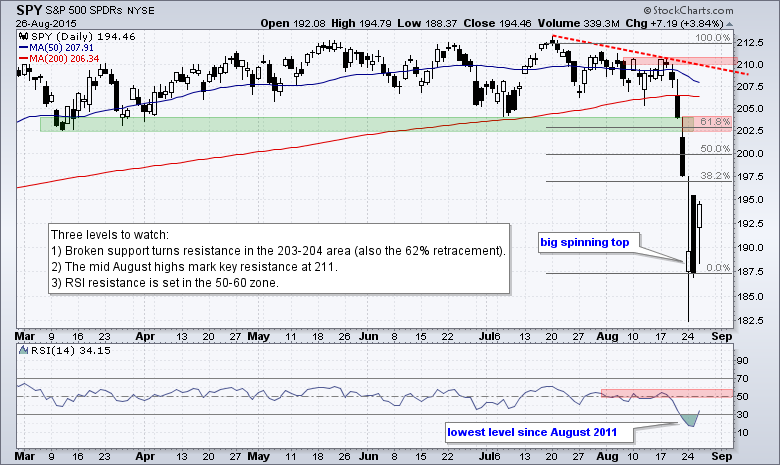
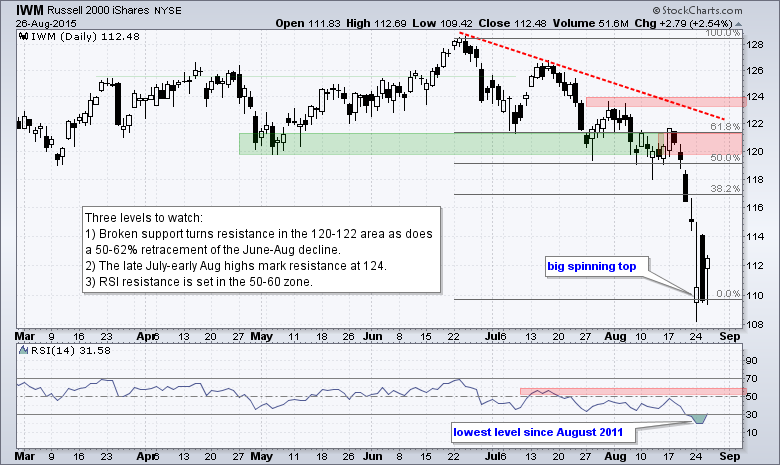
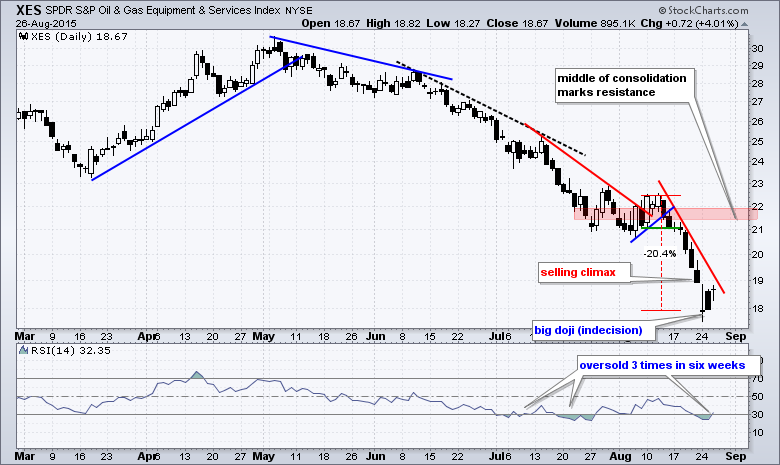
We are going to start with some candlestick charts so chartists can see the volatility of the last few days. There are few things to note overall. First, stocks became very oversold after sharp declines from August 18th to August 24th (five trading days). Second, these declines were broad-based and triggered significant support breaks in the major index ETFs. Third, big spinning top candlesticks formed with high volume on Monday and these argue for some sort of support. The high volume suggests that weak hands were flushed out and this represents some sort of selling climax. Fourth, stocks did the old pop and drop on Tuesday, but then popped and closed strong on Wednesday. This means we are in the midst of an oversold bounce within a bigger downtrend. The following charts mark the resistance zones to watch in the coming days.
A Word on RSI
In addition to the usual suspects, such as broken support turning resistance and the 50-62% retracement zones, I am also adding RSI resistance in the 50-60 zone. Andrew Cardwell introduced the idea of bull and bear ranges for RSI during trends. RSI ranges from 10 to 60 during a downtrend and from 40 to 90 during an uptrend. This means that the 50-60 zone becomes resistance in a downtrend and the 40-50 zone becomes support in an uptrend. As with all technical analysis, these levels are not an exact science and there is a bit of "art" involved in the interpretation. IWM, and other more volatile securities, may need broader ranges or perhaps different RSI settings (20 instead of 14).
A Selling Climax in XLE?
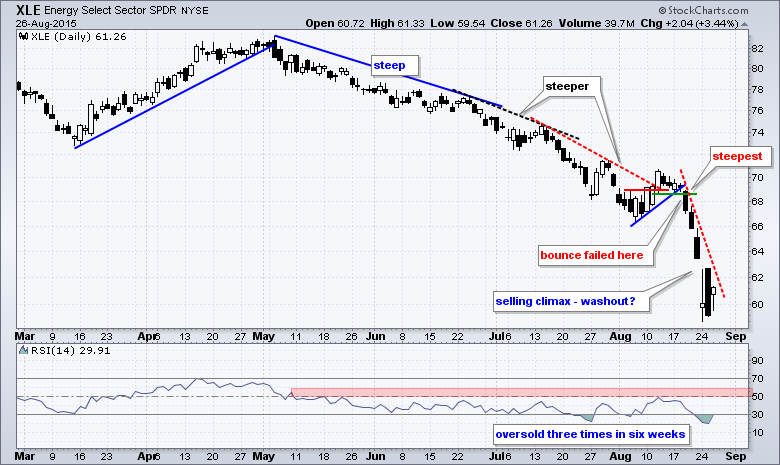
The Energy SPDR (XLE) is showing signs of firmness after a selling climax in mid August. XLE peaked in early May and fell into mid August with declines that became steeper and steeper. The most recent decline saw XLE fall from 69 to 59 in five days. This smacks of a selling climax. The ETF firmed with a long spinning top on Monday, and the candlesticks over the last two days formed a harami. Notice how the smaller white candlestick is completely within the larger black candlestick (inside day). The spinning top and harami signal indecision that could give way to an oversold bounce. Should XLE gap up today, the gap zone is the first area to watch for failure. A move below 60 would negate the bounce.
Oil forms Two Inside Days
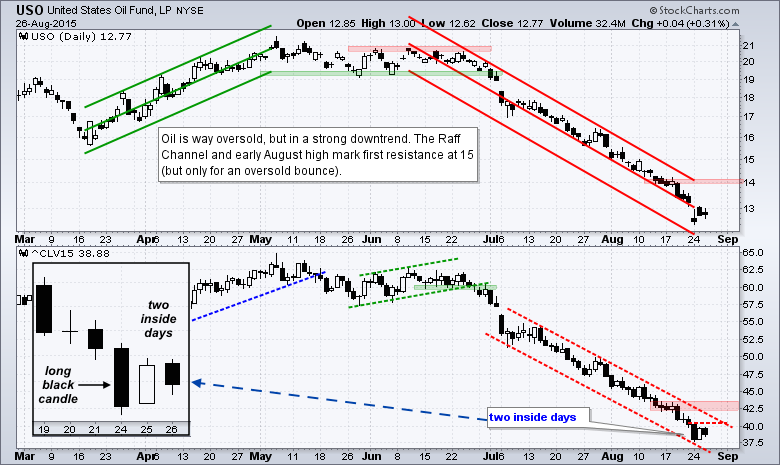
XLE and XES, of course, are not going far without a little help from oil. Before going any further, chartists should keep in mind that the trends for XLE, XES and oil are down, down and down. There are no uptrends on these charts. At all. This is just playing for an oversold bounce and such plays carry above average risk. The chart below shows the USO Oil Fund (USO) in the top window and October Light Crude (^CLV15) in the lower window. I noticed that the latter formed two inside days, which shows indecision after Monday's sharp decline. A move above 40.50 would break Monday's high and produce a small breakout from these inside days. This in turn could give way to an oversold bounce. Should crude get a mini-breakout at 40.5 today, a quick move back below 39.5 would negate the breakout.
ITB Tests Support Zone
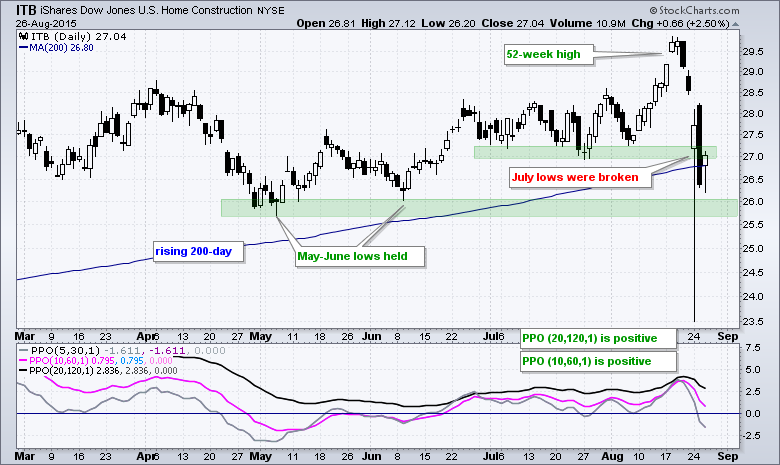
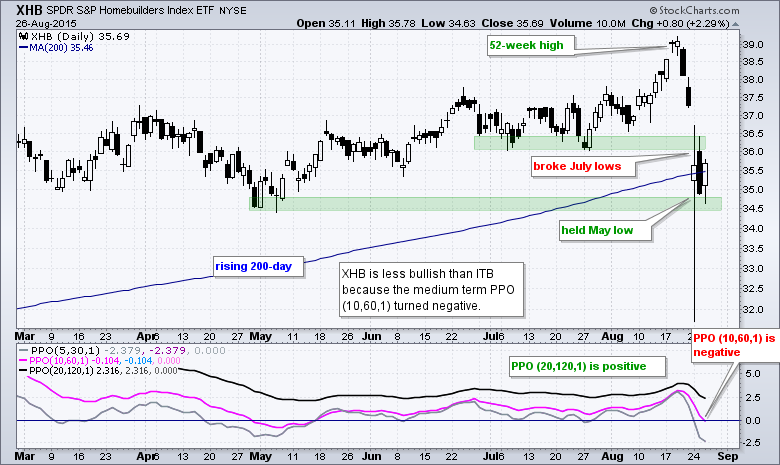
The Home Construction iShares (ITB) was hit hard over the last five trading days, but it remains one of the leading industry group ETFs and in an uptrend overall. ITB surged to new highs in mid August and then fell around 10% with a sharp decline below 26.50. This move was exacerbated by the broad market sell off and I am making some volatility adjustments for support. ITB broke below the July lows, which marked support, but managed to hold the May-June lows, which also mark support. In addition, the ETF is battling the rising 200-day moving average around 26.80. At this point, I would treat this decline as a sharp pullback within an uptrend because the May-June lows held, the medium-term and long-term PPOs are positive, and the overall trajectory is still up. Note that ITB stands in stark contrast to the broader market ETFs, the sector ETFs and many other industry group ETFs because most ETFs broke their May-June lows.
Four ETFs Showing Some Relative Strength
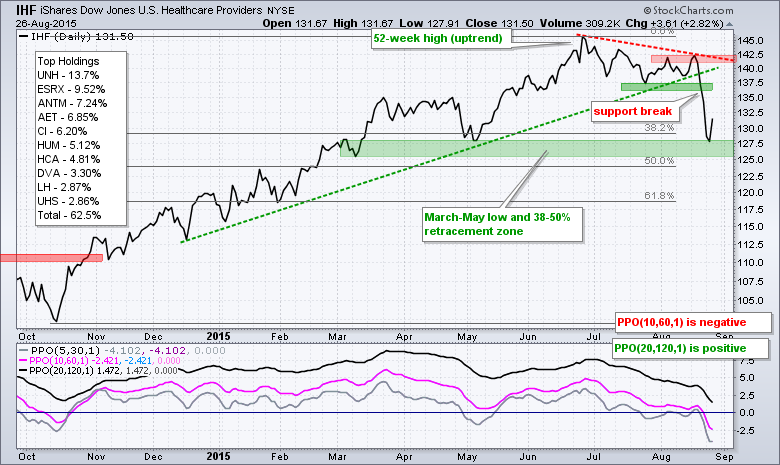
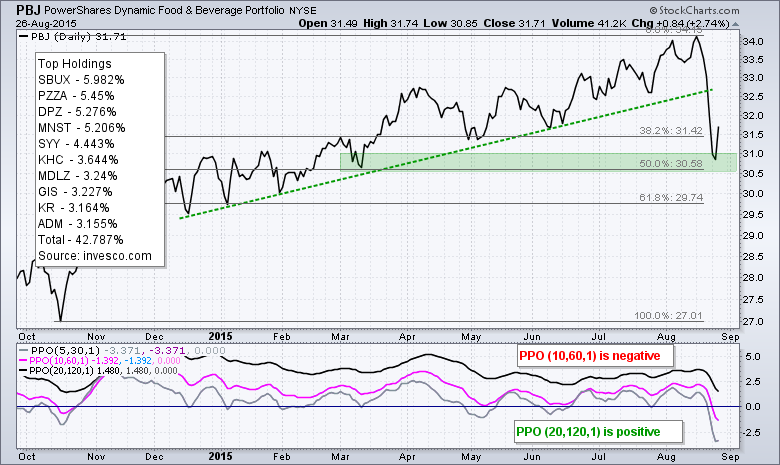
I like to use "chart" strength as a measure of relative performance. There are important lows on most charts and chartists can use these to gauge relative chart strength. Right now the March low appears to be the line in the sand. Stocks and ETFs that held their March lows are holding up better than stocks and ETFs that clearly broke their March lows. It is not much consolation after such a broad decline, but relative strength is something to consider when the market is weak overall. Note that utilities broke down on Tuesday, gold is still in a downtrend and bonds are on the blink (see below). Simply put, there are not many places to hide right now. Here is a short list of ETFs that are holding up relatively well: ITB, FDN, IHF, and PBJ.
Bond Update
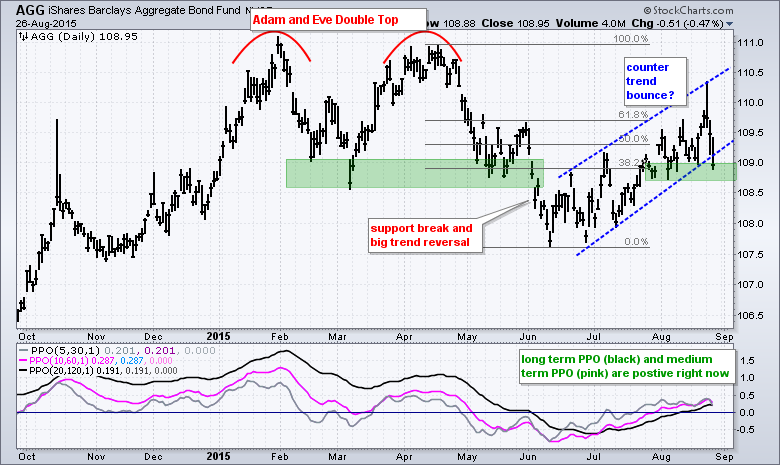
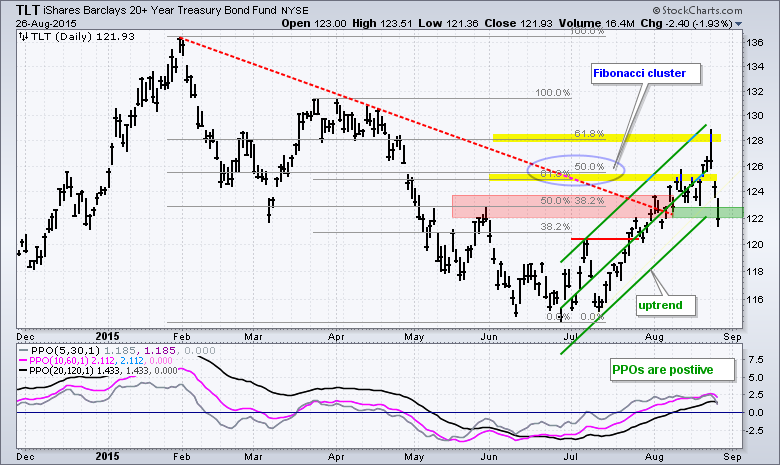
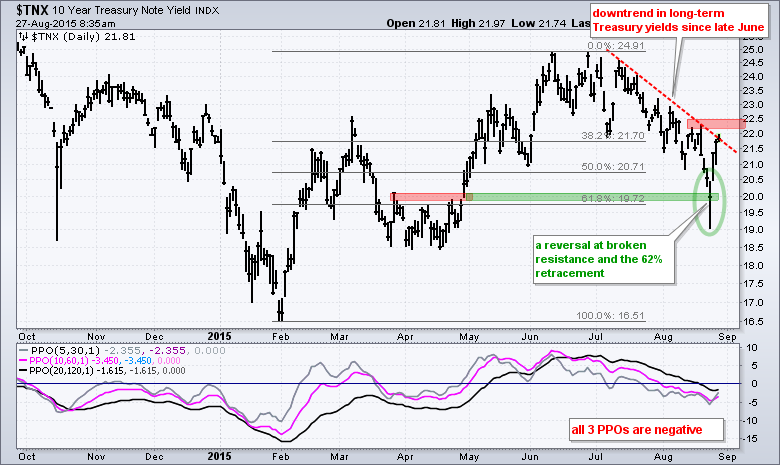
There are three things to watch for clues on the bond market: the Aggregate Bond ETF (AGG), the 20+ YR T-Bond ETF (TLT) and the 10-YR Treasury Yield ($TNX). Downside breaks in AGG and TLT would be bearish for bonds, as would an upside breakout in $TNX. TLT broke support with a sharp decline on Wednesday, AGG is still holding support and $TNX has yet to reverse its two month slide.
Precious Metals Continue to Dim
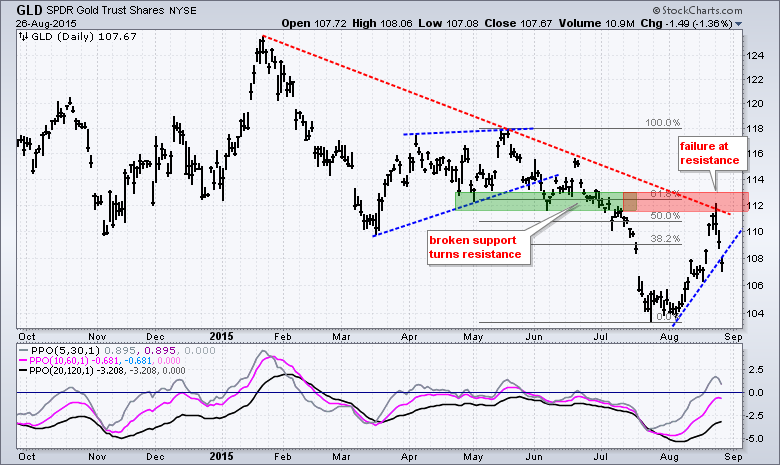
Even though gold is still trading above its July lows, a number of other precious metals moved to new lows this week. The Silver ETF (SLV), the Platinum ETF (PLTM) and the Palladium ETF (PALL) all sunk to fresh 52-week lows. The chart below shows the Gold SPDR (GLD) hitting resistance in the 112 area and breaking the August trend line with a sharp decline on Wednesday. The August high affirms resistance in the 112-113 area.
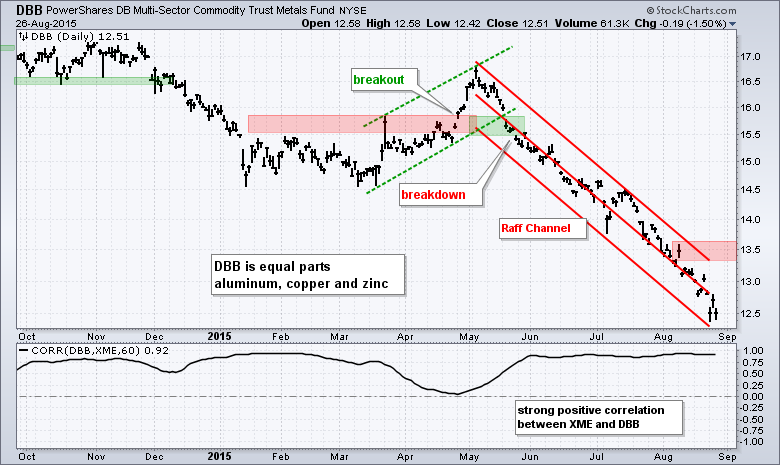
Base Metals Extend Downtrend
It is not looking any brighter for industrial metals either. The Aluminum ETN (JJU), Base Metals ETF (DBB), the Nickel ETN (JJN) and Copper ETN (JJC) moved to new lows this week as well. All three have been in long-term downtrends for years and short-term downtrends since break downs in late May. They are oversold, but showing no signs of support or buying pressure. A bounce from current levels would be just an oversold bounce at this stage.
******************************************
Thanks for tuning in and have a great day!
--Arthur Hill CMT


