Wedges are Still Rising - Despite the Noise
The stock market has certainly seen its fair share of noise in September. This noise includes the usual chatter from the talking heads and the Fed, as well as some volatile price action. Over the last 13 trading days, SPY gapped down twice, gapped up once, formed a big bearish engulfing and formed a shooting star (Thursday). The ETF fell after this shooting star with a sharp decline on Friday. Despite several bearish days, SPY has yet to fill the 8-Sept gap and the wedge is still rising for a short-term uptrend.
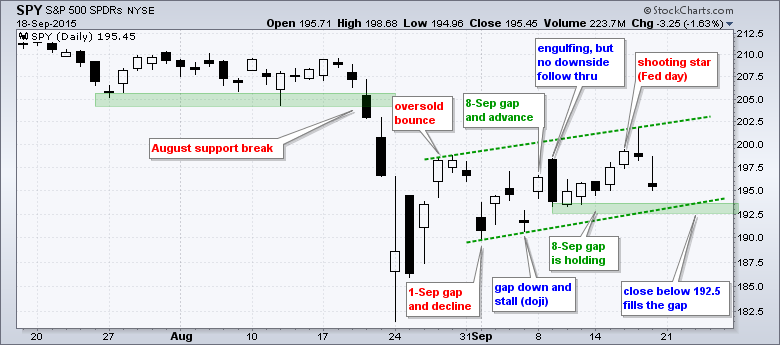
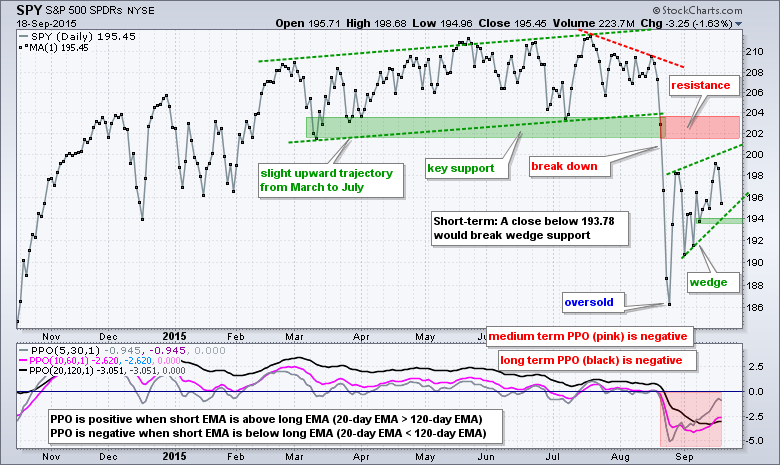
I am trying to ignore day-to-day noise and focus on the short-term trend. As Meghan Trainor might sing: because I'm all about that TREND, 'bout that trend, no noises. The medium-term trend is indeed down after the August support break, but the short-term trend is still up because the wedge is still rising. In my opinion, this week is really the crucial week because the Fed noise has cleared. At this point, I need an actual signal to tell me the short-term trend has reversed. Sorry, but Thursday's Fed-day shooting star and Friday's post-Fed decline do not count. The next chart shows a close-only chart for SPY and I am marking closing support at 193.78. A close below this level would break the wedge trend line and forge a close below the 9-Sept close. This would reverse the short-term uptrend and argue for a continuation of the bigger downtrend.
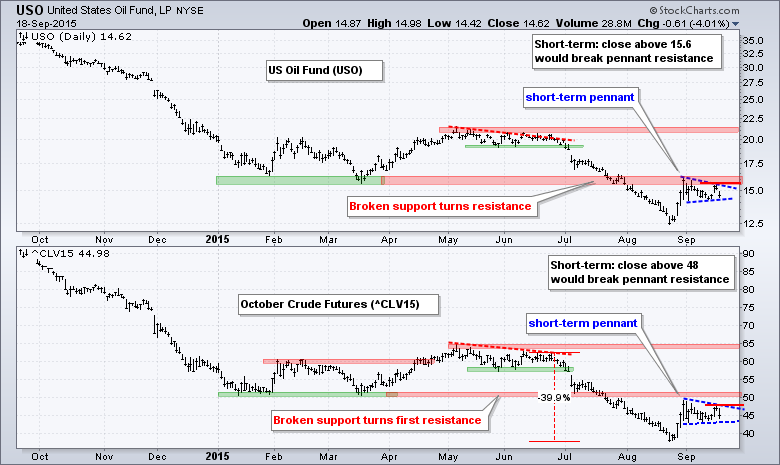
Range Narrows as USO Forms Pennant
Oil is still in a long-term downtrend, but I am watching a short-term pennant taking shape for a possible upside breakout. The chart below shows the USO Oil Fund (USO) in the top window and October Crude Futures (^CLV15) in the lower window. Oil surged at the end of August and then consolidated into September with a small triangle (pennant). A pennant after a sharp advance is usually a bullish continuation pattern and a break above last week's high would be short-term bullish. At this point, even a pennant breakout and a move above broken support in the $50 area would not be enough to reverse the bigger downtrend. In other words, any bullish thoughts on oil are still short-term plays for now and should be watched closely.
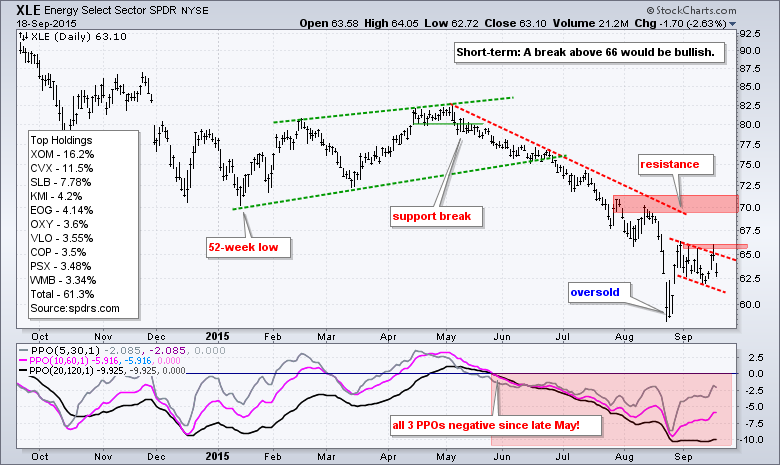
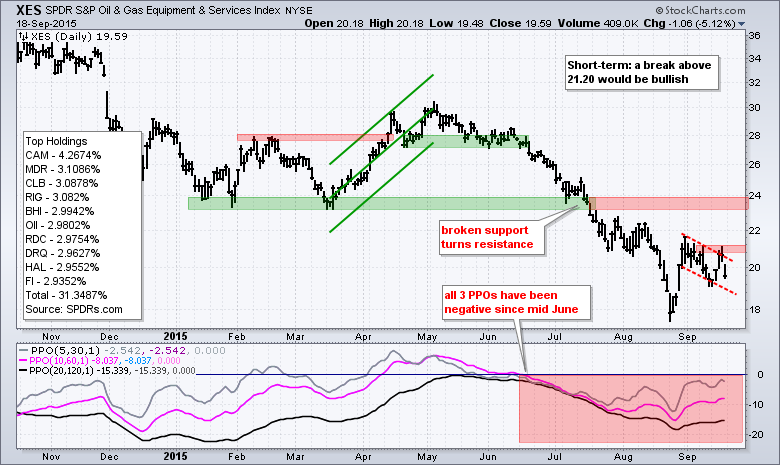
Watching Falling Flags for XLE and XES
The Energy SPDR (XLE) and the Oil & Gas Equip & Services SPDR (XES) will likely move in unison with oil. Both remain in downtrends overall, but potentially bullish flags are taking shape short-term. A bullish flag forms after a sharp advance and slopes down. A break above flag resistance signals an end to the pullback and a resumption of the prior move. Again, this is a play for an oversold bounce or a counter-trend bounce. The bigger trends are clearly down for XLE and XES. XLE broke above the flag trend line with a move above 65 on Thursday, but could not hold this breakout and settled back below the flag trend line. Look for a move above 66 to break flag resistance.
******************************************
Thanks for tuning in and have a great day!
--Arthur Hill CMT
Plan your Trade and Trade your Plan
******************************************


