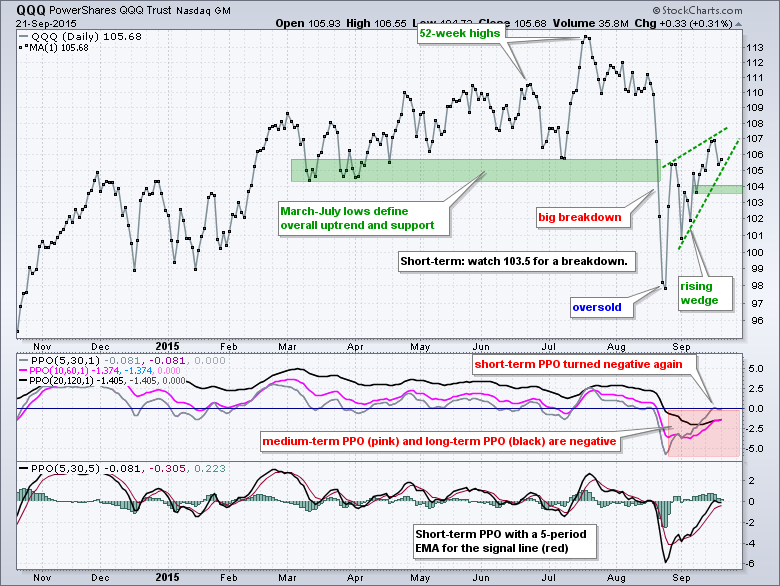
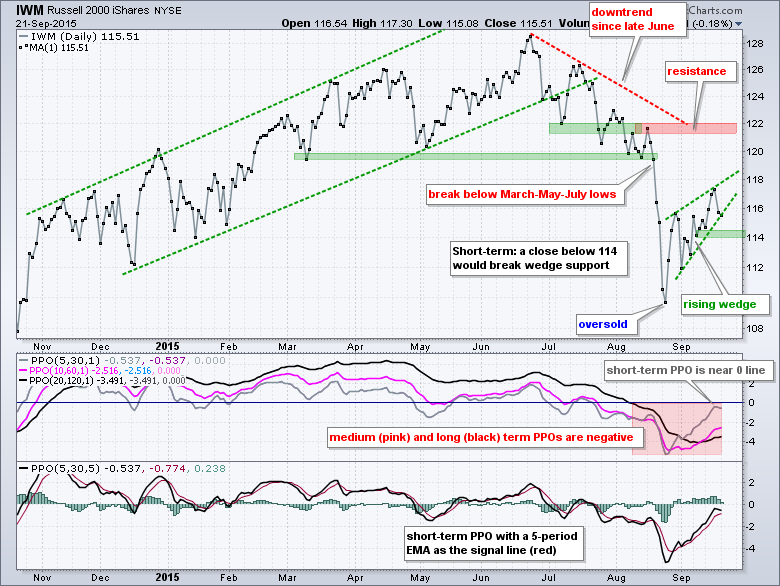
With the Fed noise behind us, for the most part at least, we can now focus on some untainted price action to define trends in the stock market. I view this week as important because there is less noise and chartists should watch for a decisive move - one way of the other. The wedges in SPY, QQQ and IWM are still rising, but some short-term indicators are turning negative already.
First, note that the medium-term trends have been down since the August support breaks and this suggests that the rising wedges are counter-trend moves. Also note that the PPO (20,120,1) and PPO (10,60,1) are negative for IWM, SPY and QQQ. These negative PPOs confirm that the overall trend is down. The short-term PPO (5,30,1) is now used to generate bearish signals. I am not interested in short-term bullish signals when the bigger trend is down.
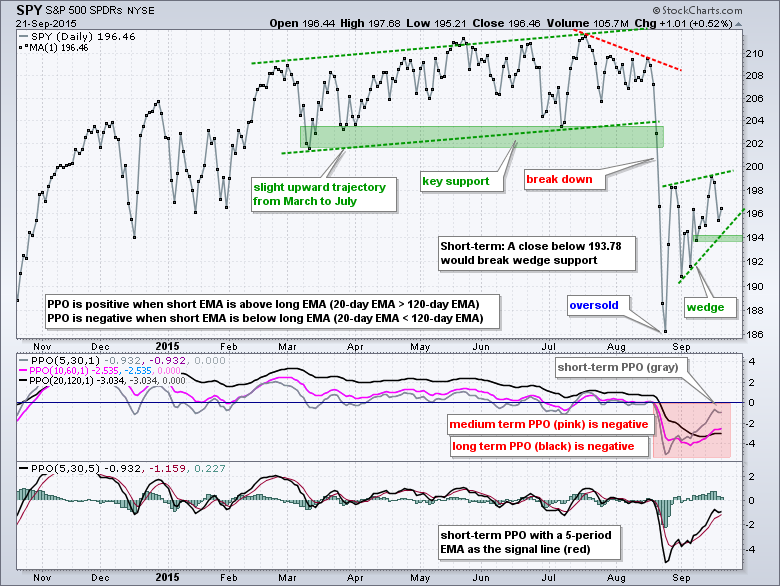
Sometimes the PPO (5,30,1) makes it back above the zero line and then turns down. Sometimes it doesn't so I added an indicator window at the bottom of the SPY chart to focus on PPO direction with a signal line, which is a 5-period EMA of the actual PPO. The PPO is rising as long as it remains above its signal line. A move below the signal line signals a downturn and indicates that momentum is moving down again.
Short-term Breadth Indicators Turn Down
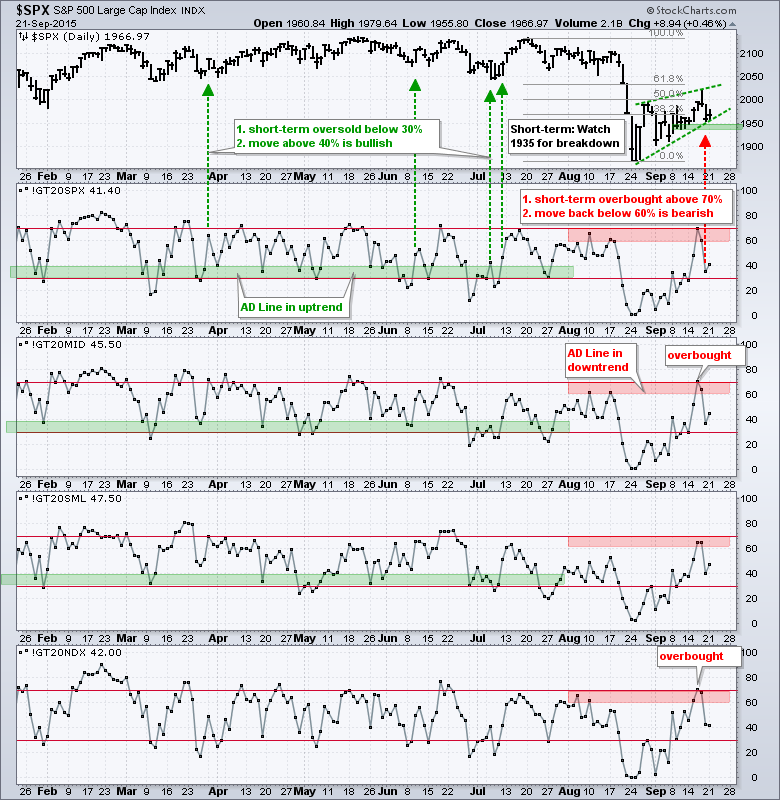
Last week I showed this chart with some short-term breadth indicators becoming short-term overbought. First note that the AD Lines for the Nasdaq 100 and S&P 500 broke down in late June and the AD Line for the S&P Small-Cap 600 and S&P MidCap 400 broke down in late July. As with the underlying indices, these breadth indicators are in downtrends overall. This means short-term breadth bounces should be put in the context of bigger downtrends. The S&P 500 %Above 20-day EMA (!GT20SPX), the MidCap %Above 20-day EMA (!GT20MID) and the Nasdaq 100 %Above 20-day EMA (!GT20NDX) became short-term overbought with surges above 70% and then turned back down with a move below 60% on Thursday. All three are below 50% right now and this means more than half the stocks in these indices are below their 20-day EMAs (short-term downtrends).
All Nine Sector SPDRs in Downtrends Overall
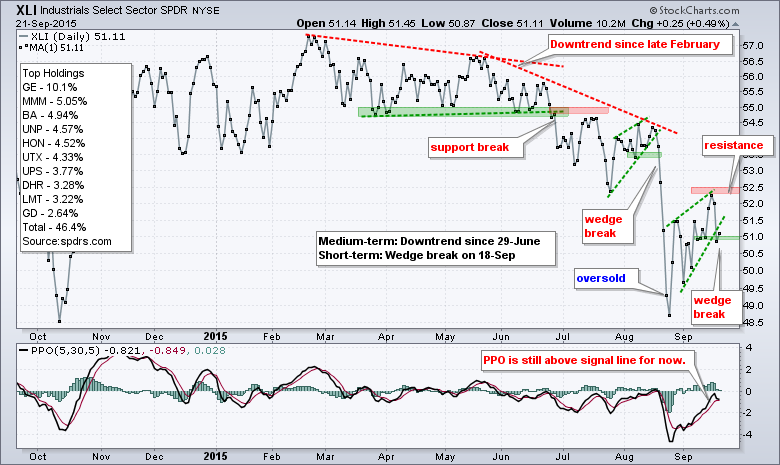
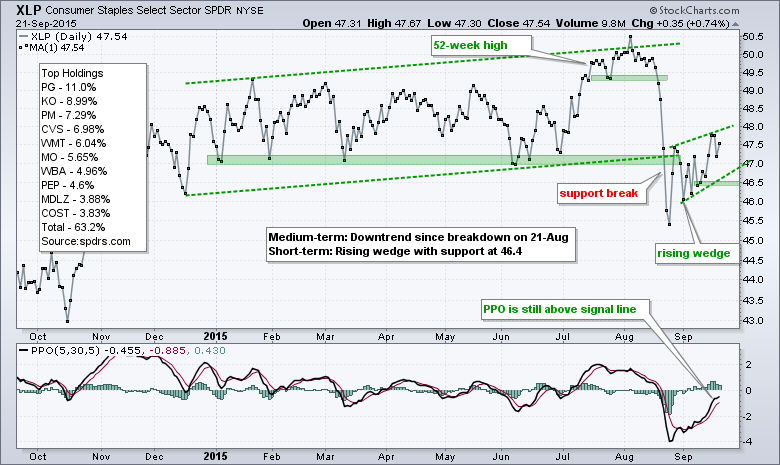
The next group of charts shows the nine sector SPDRs with the PPO (5,30,5). I do not need to show the PPO (20,120,1) and PPO (10,60,1) because these indicators are negative for all nine sector SPDRs, which means the bigger trends are down for all nine. Negative PPO (20,120,1) means the 20-day EMA is below the 120-day EMA and negative PPO (10,60,1) means the 10-day EMA is below the 60-day EMA.
As of Monday's close, the short-term PPO (5,30,5) was above its signal line for all nine sector SPDRs, which means all nine are in the midst of a short-term bounce or consolidation. Bearish signal line crossovers would signal a downturn in momentum and this would be short-term bearish. Such signals would also suggest that the bigger downtrend is resuming.
Finance Leads Offensive Sectors Lower
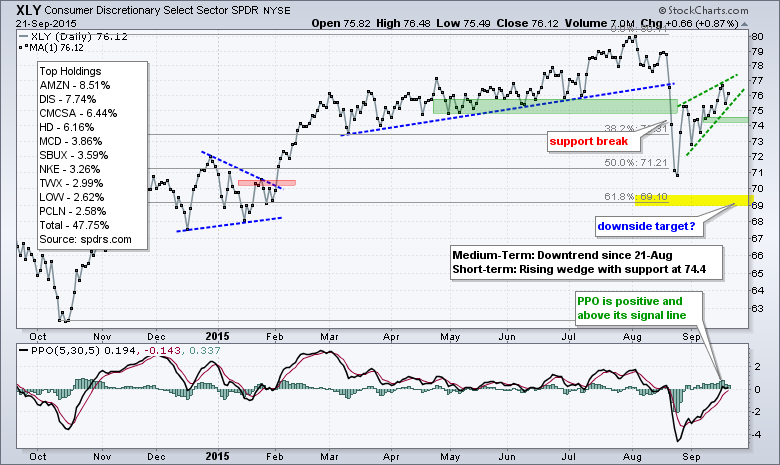
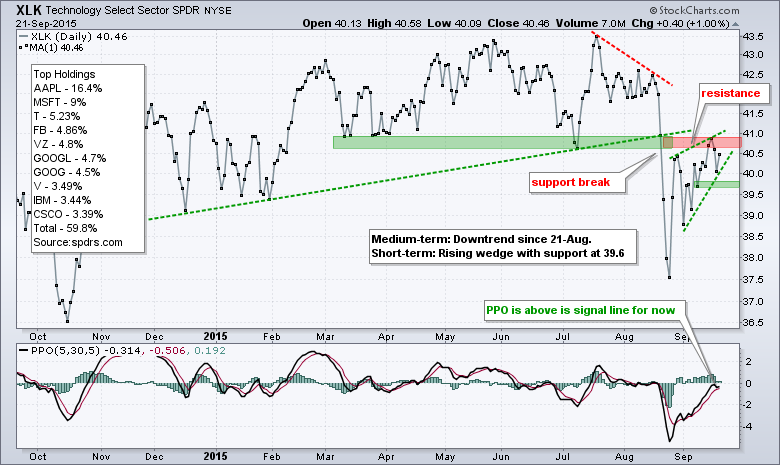
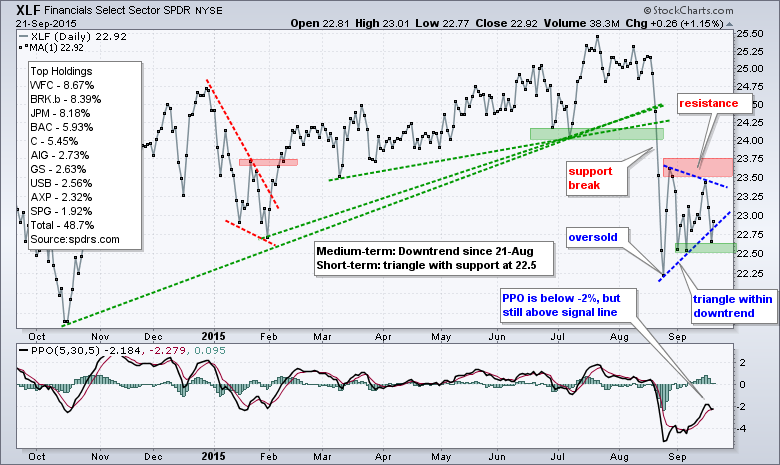
I am starting with the four offensive sectors: consumer discretionary, technology, finance and industrials. XLY and XLK are holding up the best. Both charts show rising wedges the last few weeks and XLK is hitting resistance from broken support. XLF is the weakest of the group because it formed a lower high from late August to mid September and broke the triangle trend line. XLI is also showing weakness because it closed below its 9-Sep low (support) on Thursday and broke the wedge trend line.
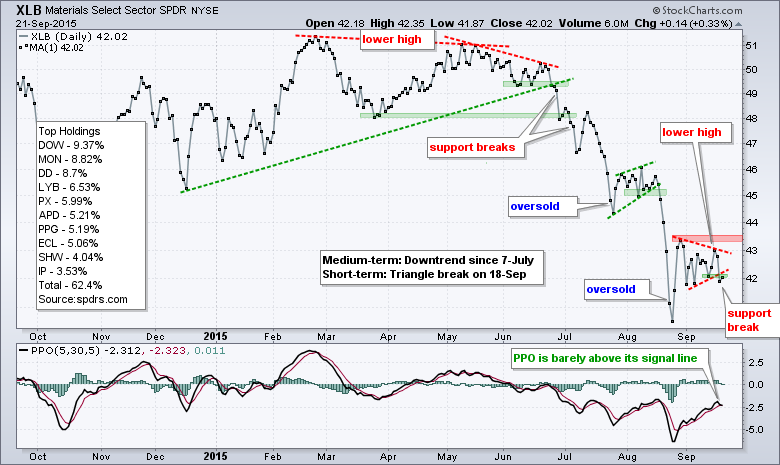
The next two SPDRs represent materials (XLB) and energy (XLE). XLB also shows relative weakness because it formed a lower high from late August to mid September. A triangle formed in September and the ETF broke support with a close below 42 on Thursday.
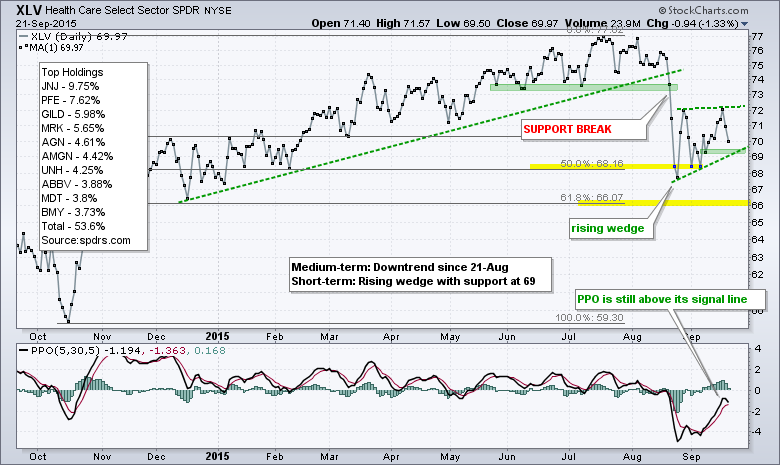
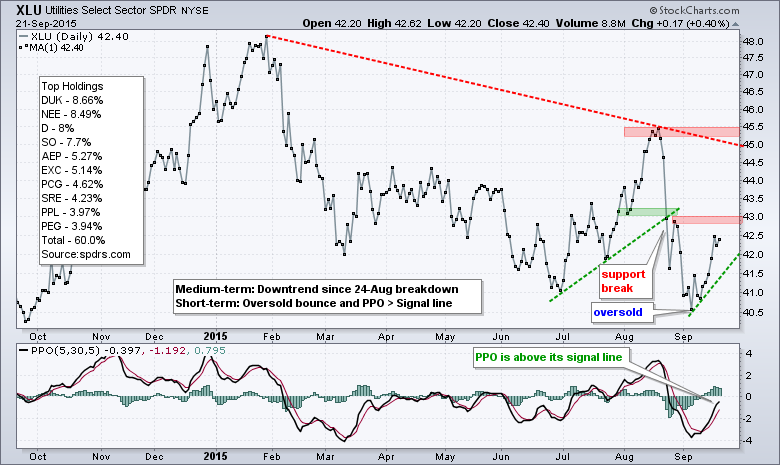
The next three SPDRs represent the defensive sectors: healthcare, consumer staples and utilities. Note that all three are in medium-term downtrends and this means there are not many places to dodge the broad market downtrend. They may be going down less than the broad market indices, but that is of little consolation if they are in downtrends overall. Short-term, XLV and XLP have rising wedges and could test support today. XLU got a nice oversold bounce the last six days, but remains well below its late August high and remains in a downtrend overall.
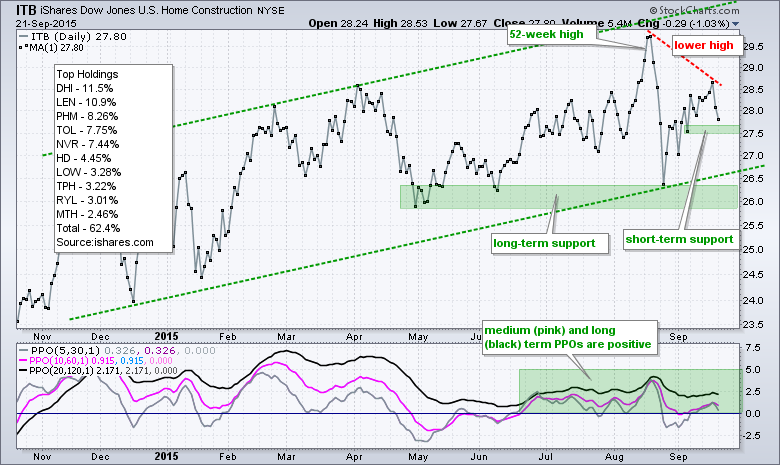
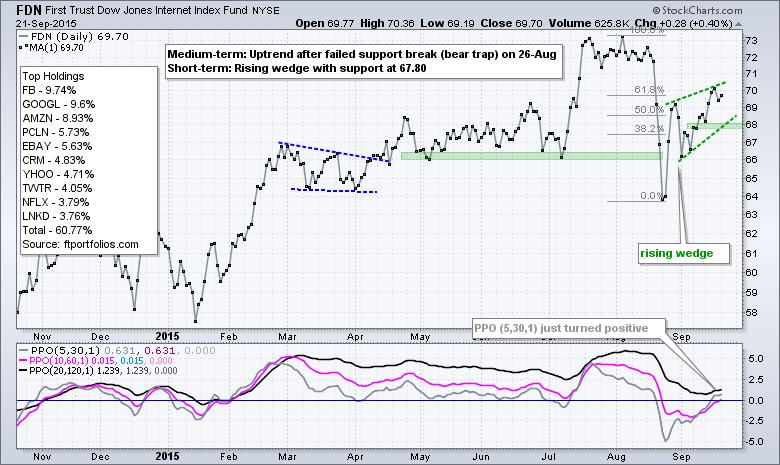
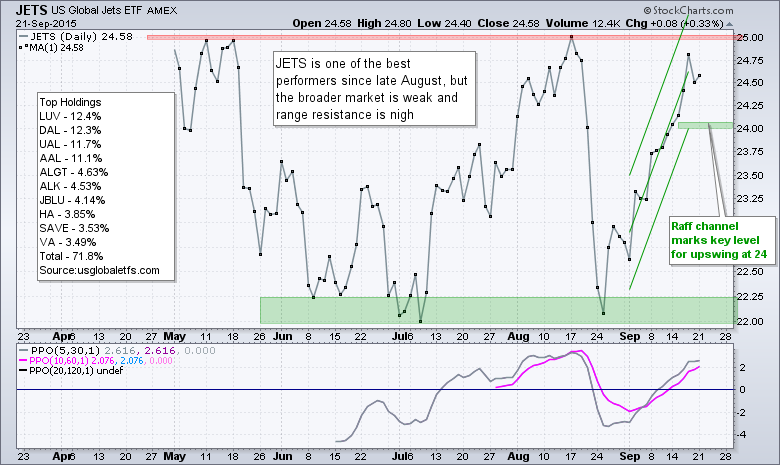
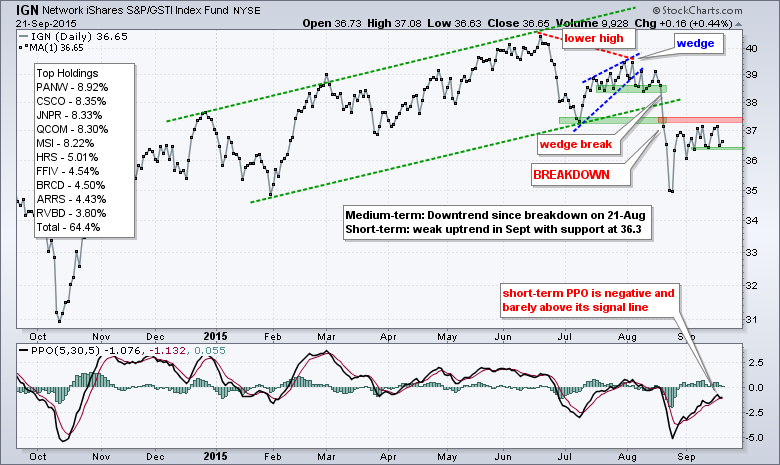
There is concern that broad market weakness will eventually weigh on the leading industry group ETFs, such as the Home Construction iShares (ITB), Internet ETF (FDN) and Airline ETF (JETS). ITB formed a lower high with a decline the last two days and a support break at 27.5 would reverse the short-term uptrend. The long-term trend remains up with support in the 26 area.
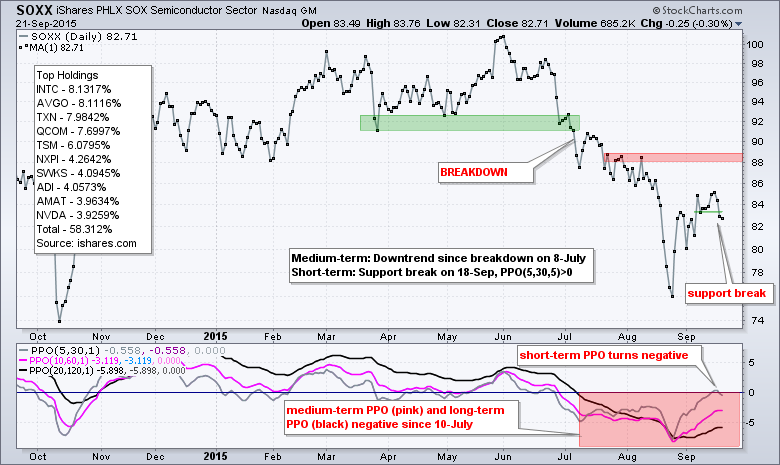
Semis Weaken
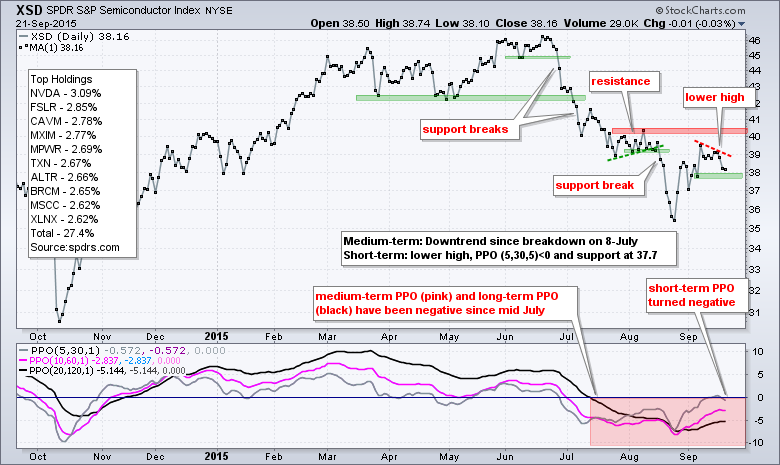
The Semiconductor SPDR (XSD) was showing some leadership with the surge in late August and early September, but stumbled last week and formed a lower high. The bigger trend has been down since early July and the short-term PPO (5,30,1) just triggered a bearish signal with a move into negative territory. Short-term support is set at 37.70 and a break here would complete the short-term trend reversal.
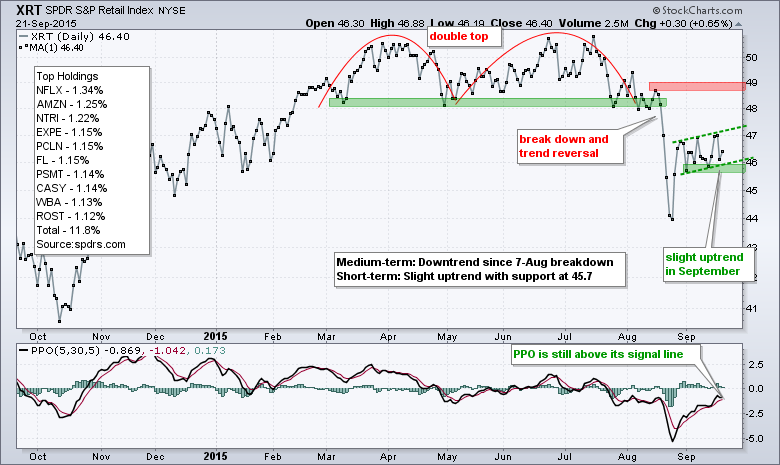
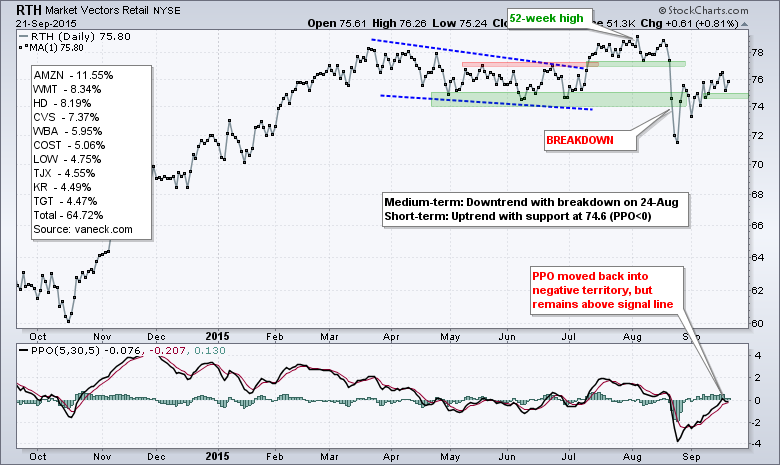
The retail ETFs are holding up short-term, but support is likely to be challenged with selling pressure on Tuesday.
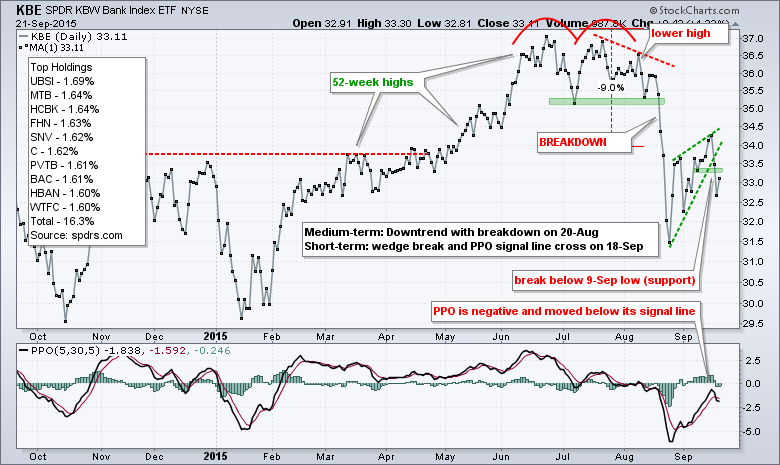
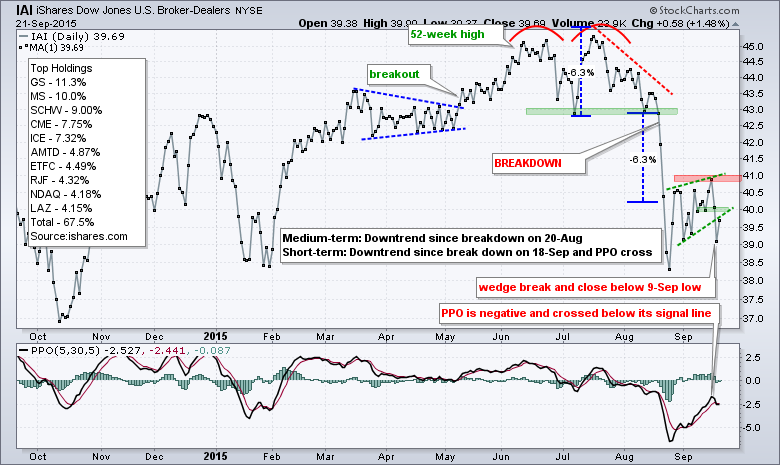
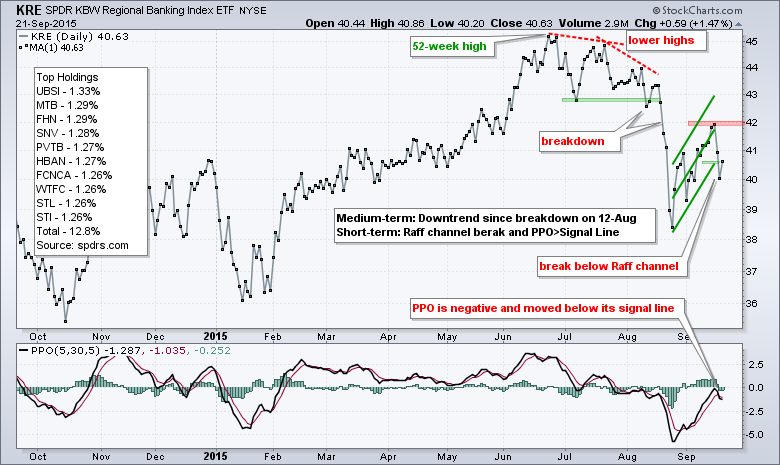
The bank-related ETFs broke down last week and their short-term PPOs moved below their signal lines for short-term bearish signals.
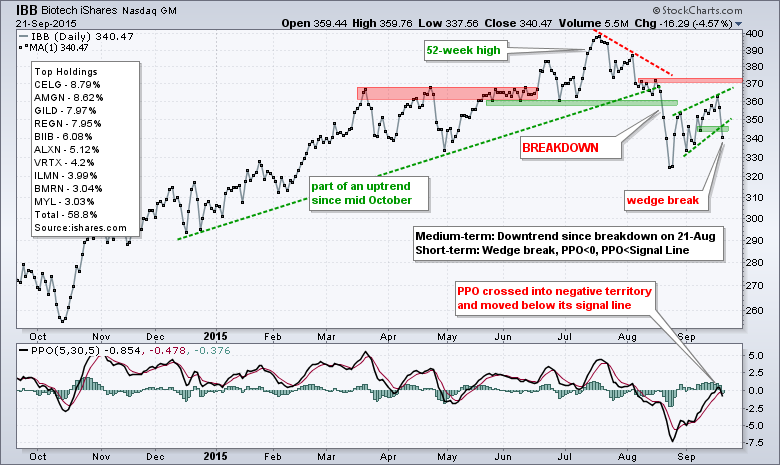
The biotech ETFs are split as the Biotech iShares (IBB) broke short-term support and its PPO moved back into negative territory, but the Biotech SPDR (XBI) closed above support and its PPO remains positive. Today is a big test for XBI. Also notice that a big head-and-shoulders pattern could be taking shape in XBI.

Follow Up
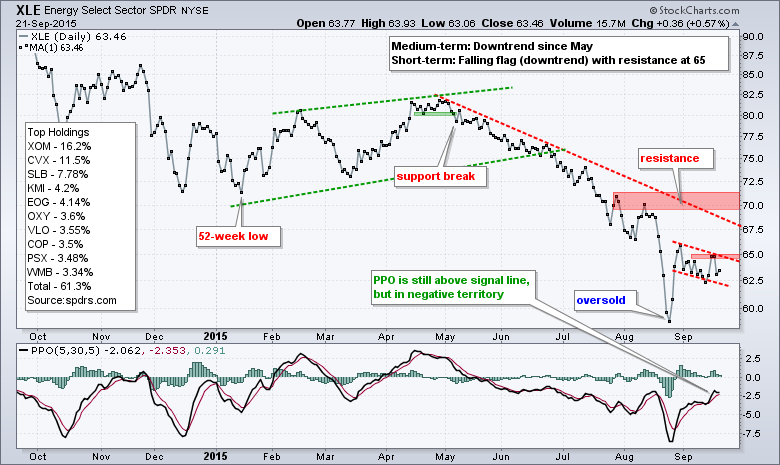
The USO Oil Fund (USO) and October Crude Futures did not break out of their pennant formations to trigger short-term bullish signals. Watch 15.6 for USO and 48 for ^CLV15. Similarly, the flags in XLE and XES continue to fall and have yet to reverse course. This means the long-term and short-term trends are down. Short-term, watch 66 for XLE and 21.2 for XES.
PPO Scan Code
Here is the code for a bearish PPO scan. This scan looks for S&P 500 stocks with negative PPO (20,120,1), negative PPO (20,120,1) and cross below zero in PPO (5,30,5). Note that [0 x PPO Line(5,30,5) means zero crossed above the PPO Line (5,30,5), which is the same as the PPO Line crossing below zero. This code can be copied and pasted into the advanced scan workbench.
PPO Zero Line Cross (bearish)
[group is SP500]
and [PPO Line(20,120,1) < 0.0]
and [PPO Line(10,60,1) < 0.0]
and [0 x PPO Line(5,30,5)]
Rank by PPO Line(5,30,5)
PPO Signal Line Cross (bearish)
[group is SP500]
and [PPO Line(20,120,1) < 0.0]
and [PPO Line(10,60,1) < 0.0]
and [PPO Signal (5,30,5) x PPO Line(5,30,5)]
Rank by PPO Line(5,30,5)
*****************************************
Thanks for tuning in and have a great day!
--Arthur Hill CMT
Plan your Trade and Trade your Plan
*****************************************


