Using Volatility-Adjusted Channels
Note that I will be making a second post today with some individual stock charts (AMZN, AAPL, FB, NFLX, PANW, TASR, TSLA, UA, XOM and more). If you would like to receive email notifications when I post, check out the "yes" button at the bottom of this commentary.
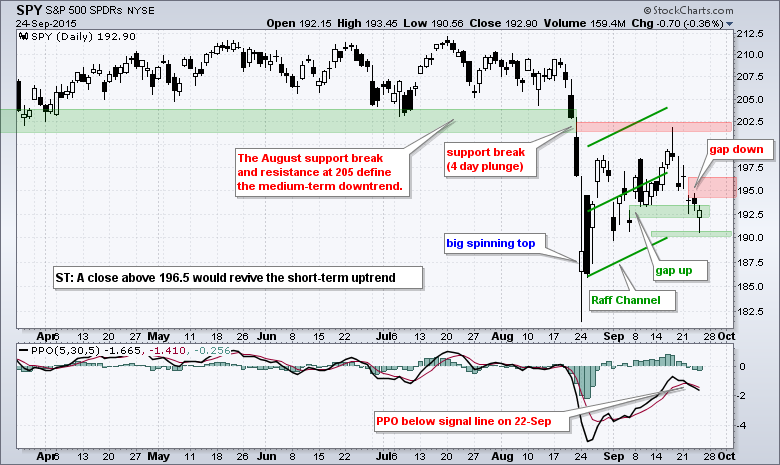
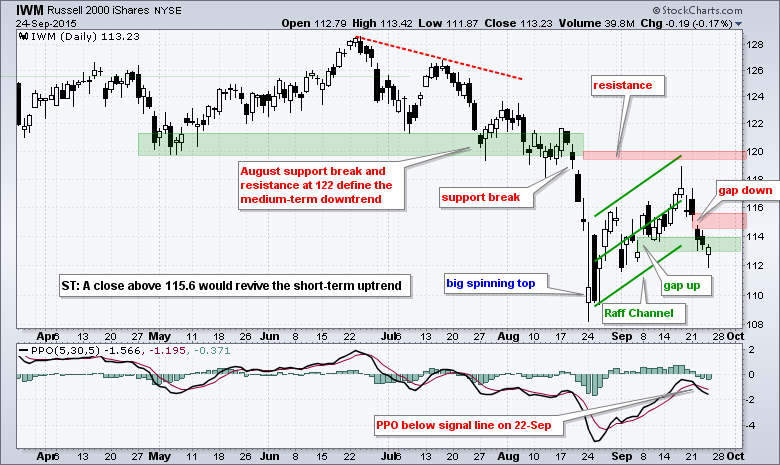
Once a signal triggers and I change my trading stance, I immediately start looking for what would negate this signal and prove me wrong. For the major index ETFs, the medium-term trends are down and the short-term trends turned down this week with gaps down on Tuesday and bearish signal line crossovers in the Percentage Price Oscillators (5,30,5). Despite bearish signals on Tuesday, the major index ETFs did not decline much after Tuesday's gap and even closed near the high-of-the-day on Thursday. The bulls are not going quietly.
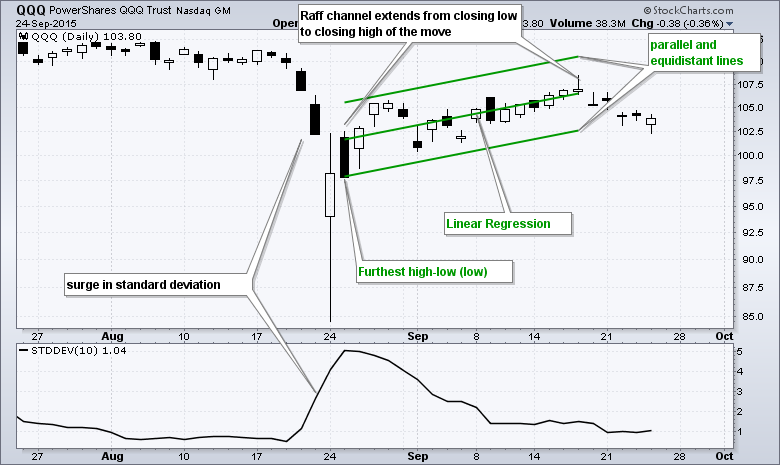
I drew rising wedge patterns to define the advance from 25-Aug to 17-September, but I do not like the look of the lower trend lines because they are too steep and do not account for recent volatility. Trend lines are quite subjective anyway and the angle simply represents the rate of ascent. A trend line break signals a change in the rate of ascent, but it is not a hard support level based on supply-demand dynamics (actual buying and selling at a specific level). Price troughs and consolidation lows, on the other hand, represent hard support based on a supply-demand dynamic.
I am now drawing Raff Regression Channels from the August 24th closing low to the mid September closing high to account for recent volatility. Note that I am ignoring August 24th because of the spike low in many ETFs. The middle line is a linear regression, which is the line of best fit for the move. The outer lines are parallel and equidistant from the furthest high or low of the move. The further the high or low, the greater the distance for the outer lines. This is how the Raff Regression Channel accounts for volatility and gives us a volatility-adjusted channel to define the trend.
QQQ-SPY-IWM Firm in Gap Zone
Now back to the bearish signals at hand. The PPO (5,30,5) moved below its signal line for QQQ, SPY and IWM on Tuesday. The PPO is also negative for all three and all three gapped down on Tuesday. These are the most recent signals and they have yet to be negated. Tuesday's gap holds the first key. A close above Tuesday's close would fill the gap and clearly negate the signal.
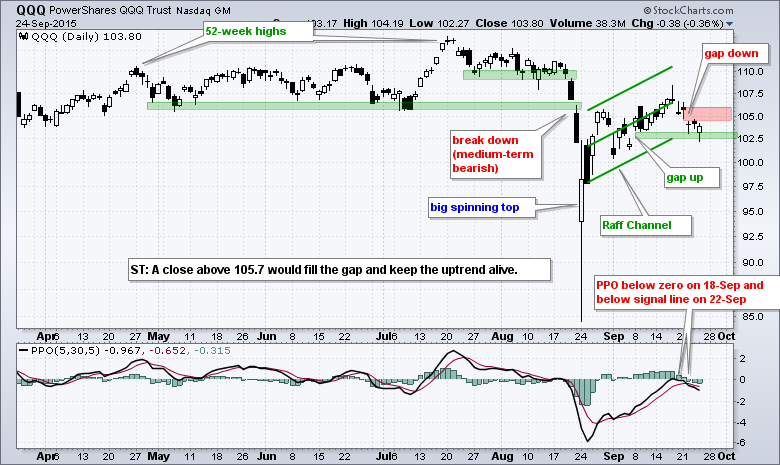
The futures are pointing sharply high in early trading and it is vitally important what happens after the gap. The lower trend line of the Raff Regression Channel and the 8-Sept gaps mark a support zone on all three charts. Notice that SPY, QQQ and IWM closed in this gap zone the last three days. A gap off this support zone and strong close would be enough to reconsider bearish positions. Again, the gap is not what is important today. What is important is what happens after the gap.
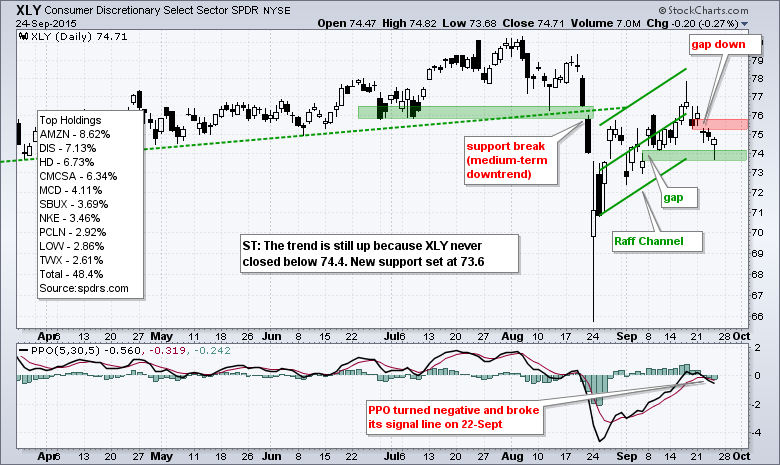
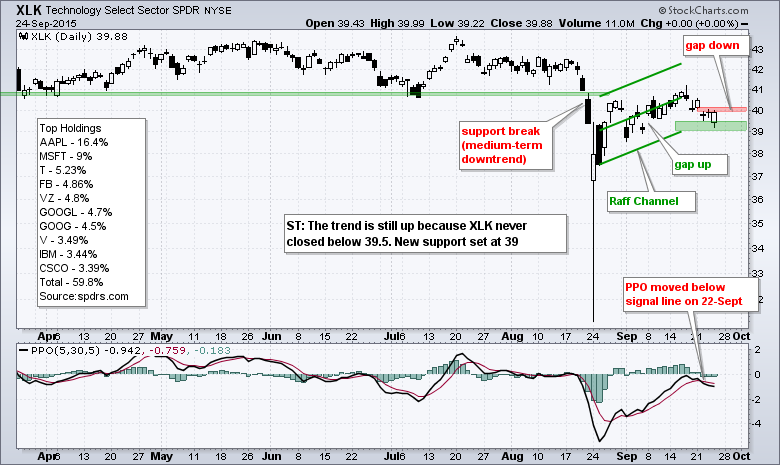
XLK and XLY Never Fully Broke Down
I am not going to show all sector SPDR charts today and will instead focus on the two strongest: XLY and XLK. Note that neither closed below the support levels laid out on Tuesday and Thursday. I updated the charts with Raff Regression Channel and reset support based on these channels.
Economic Data Stays Bullish
A reader asked for an update to the economic indicator table so I will provide it one more time as a courtesy. Even though I enjoy following these indicators for a long-term perspective, they are not really actionable and Mr. Market often has a mind of his own. In addition, we do not get paid for the trend in economic indicators. We make (or lose) money based on trends and signals in stock indices, ETFs and individual stocks. As we all know, the markets can remain irrational a lot longer than we can remain solvent.
As a side note, this quote is widely attributed to Lord John Maynard Keynes, but nobody seems to be able to prove that he actually said it. Nevertheless, it is a great quote worth remembering. If Keynes were a technical analyst, he would probably say "price is the only thing that matters".
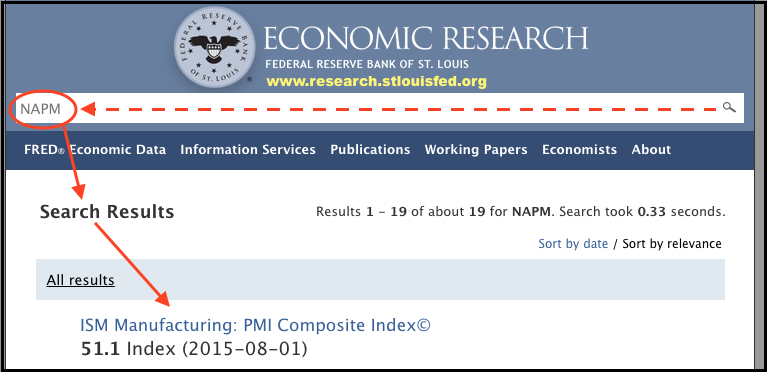
The table below is just screenshot from a simple spreadsheet with numbers and colored boxes. The data can be found at the St Louis Fed website (www.research.stlouisfed.org). The table below shows the symbols for each indicator. Simply enter the Fed symbol in the search box to find the indicator value. This website also provides some basic charts.
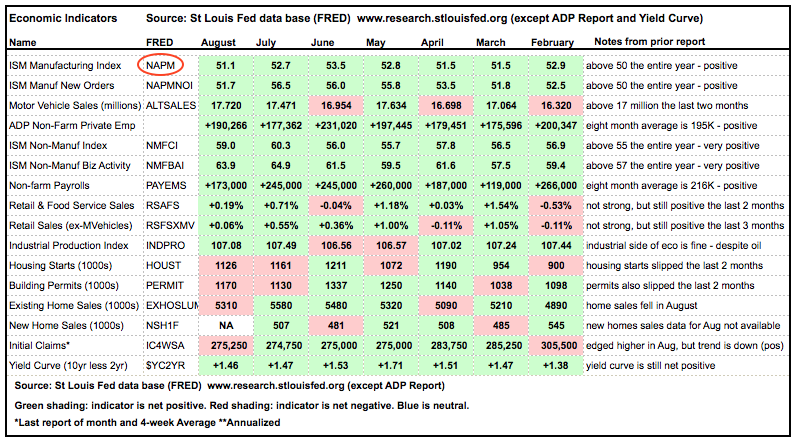
The economic indicator table is mostly green for the last two reporting months (July-August). In fact, the table is very green the entire year and this is positive for the economy. The ISM indices are very strong and show no signs of letting up. Auto-truck sales are strong, the employment numbers are clearly positive and industrial production is holding up. Retail sales are anemic, but not contracting. Housing is the only weak spot over the last two months.
Economic Indicators at StockCharts
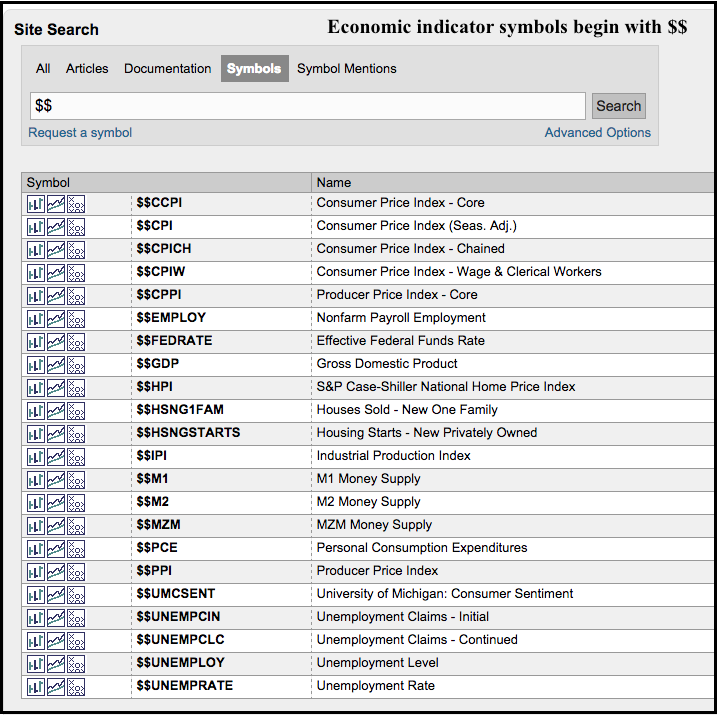
StockCharts also carries a number of economic indicators for charting. All begin with $$ and chartists can find these by searching in the symbol catalog. The screen shot below shows a current list of available economic indicators.
*****************************************
Thanks for tuning in and have a great weekend!
--Arthur Hill CMT
Plan your Trade and Trade your Plan
*****************************************


