Medium-term (MT), the major index ETFs are in downtrends after the August support breaks. In addition, the PPO (20,120,1) and PPO (10,60,1) are in negative territory to confirm these downtrends. Short-term (ST), the major index ETFs are mixed. IWM and SPY broke down this week and are in short-term downtrends, but QQQ held support and has yet to reverse its short-term uptrend. On balance, two of the three are in short-term downtrends and this is short-term bearish for stocks overall. Also notice that the PPO (5,30,5) moved below its signal line and remains in negative territory for all three ETFs. Thus, momentum has turned bearish again this week. QQQ could follow suit with a close below support today.
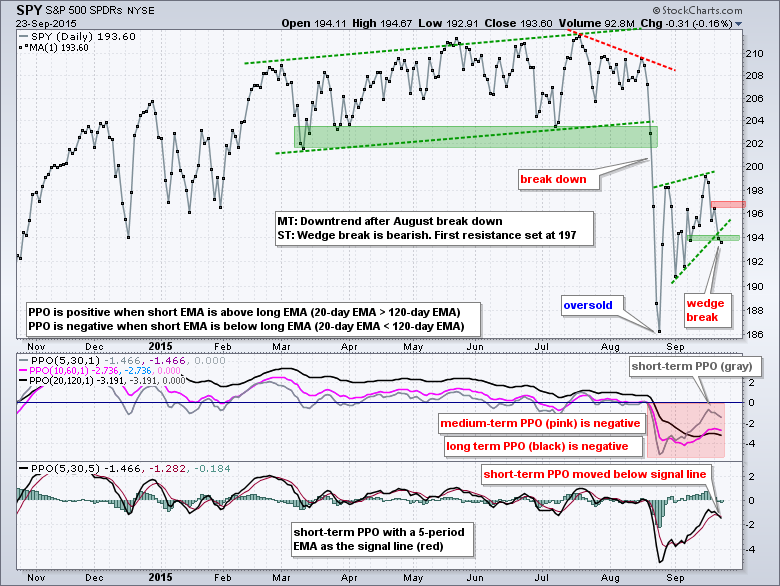
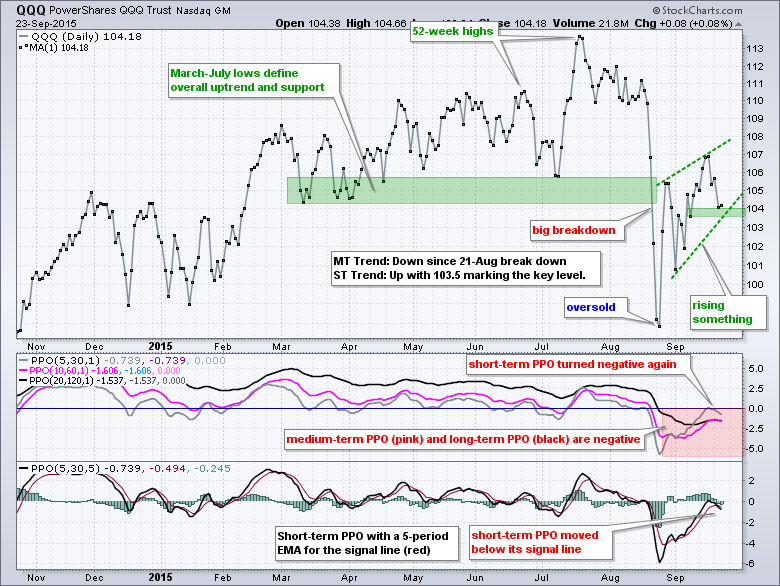
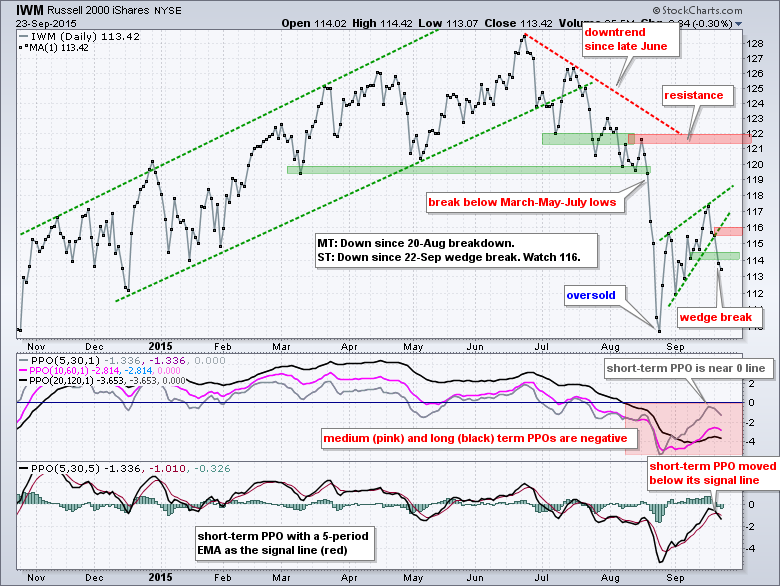
Chart Annotations: MT refers to medium-term and ST refers to short-term. Red annotations are bearish, green annotations are bullish and blue annotations reference a condition (overbought, oversold or neutral). The black text is used for descriptions. Look to the right side of the chart and count the red-green annotations for an overall bias (bullish or bearish).
Sectors Overwhelmingly Bearish
As the scan results below show, the medium-term and long-term PPOs are in negative territory for all 18 sectors (9 sector SPDRs and 9 equal-weight sector ETFs). This means the bigger trends are down for all 18 and there are few places to hide.
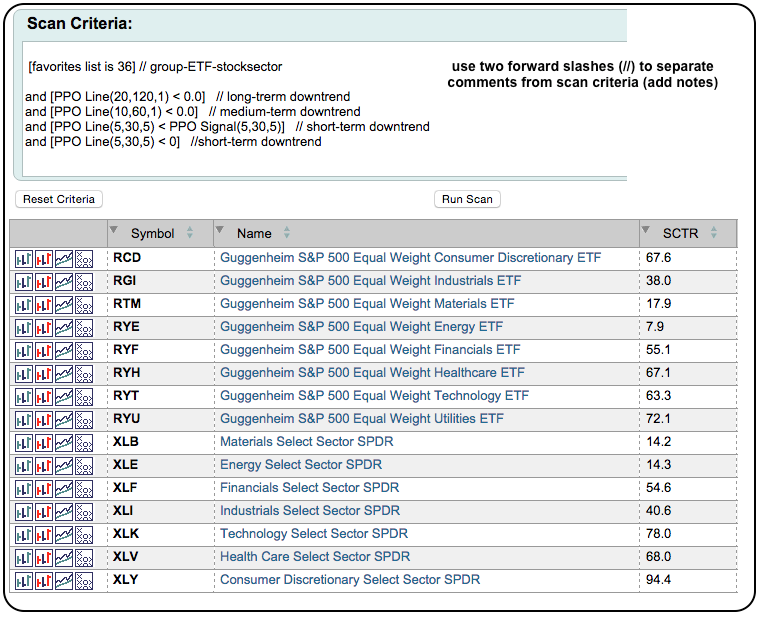
Short-term, note that the short-term PPO (5,30,1) is in negative territory for all 18 sector ETFs and the short-term PPO is below its signal line for seven of the nine sector SPDRs. XLP and XLU are the only two with rising short-term PPOs. This means that short-term momentum is bearish for 16 of the 18 sector ETFs. Sounds like an overwhelming majority.
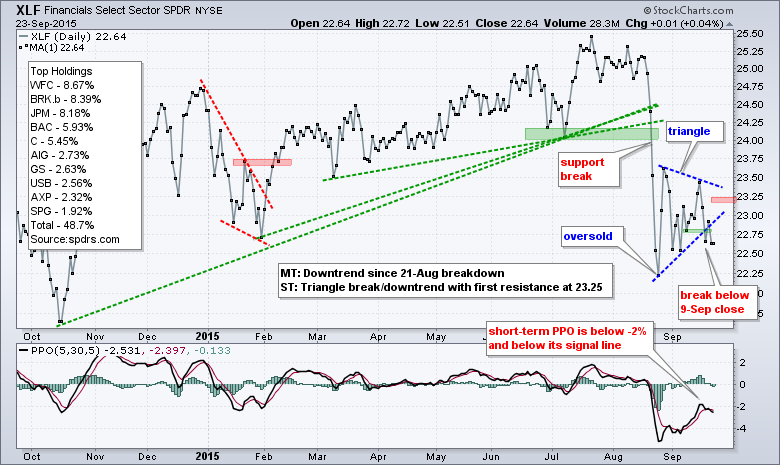
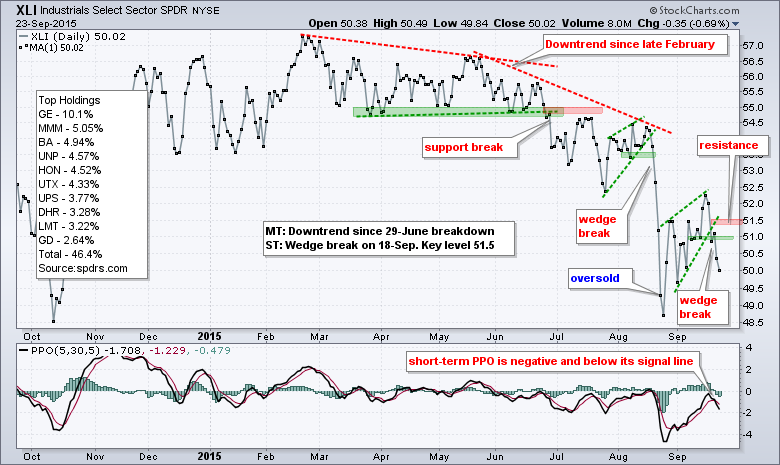
XLI and XLF Lead Offensive Sectors Lower
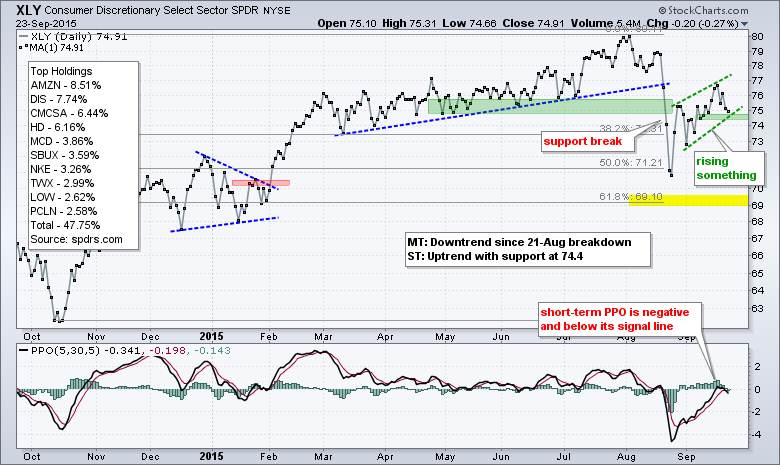
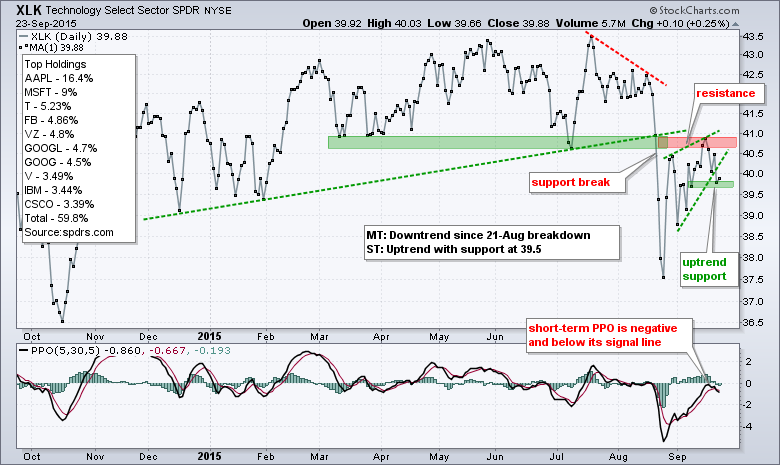
The Technology SPDR (XLK) and Consumer Discretionary SPDR (XLY) are holding up the best because they have yet to close below their 9-Sept close (as of Wednesday's close). This is my short-term line in the sand. ETFs and stocks that closed below their 9-Sep low recently show short-term weakness and short-term downtrends. ETFs and stocks that held above this low show short-term trend and remain in short-term uptrends. Note, however, that XLK and XLY are very close to breaking short-term support and short-term momentum is bearish. Also note that XLF and XLI already broke down and are clearly in short-term downtrends - to go along with their medium-term downtrends.
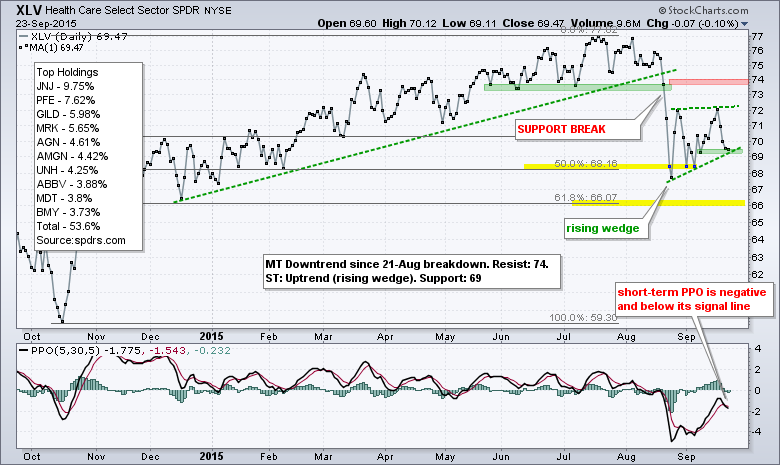
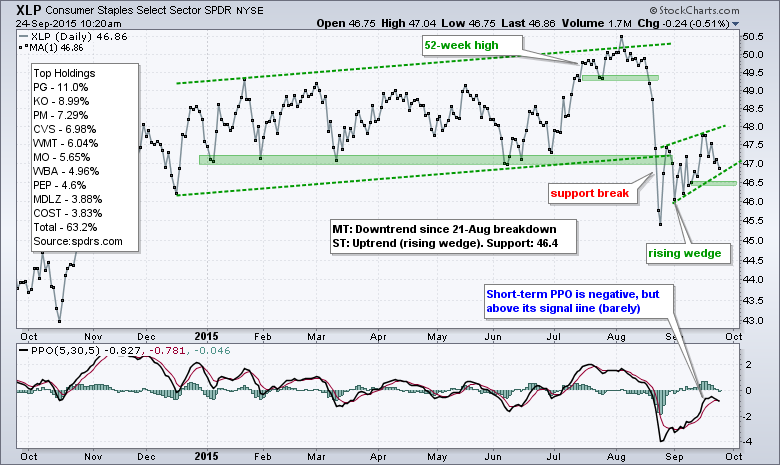
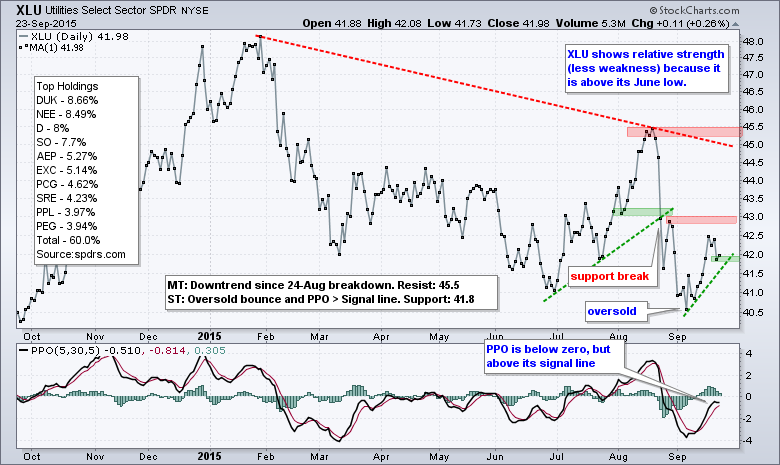
Defensive Sectors Offer Some Shelter
The three defensive sector SPDRs are holding up better than the broader market, but all three are in downtrends overall and these downtrends trump relative performance. XLU and XLP show some relative strength because they closed above their June (closing) low and these two are the only two sectors that can make that claim. They are also the only two sectors where the PPO (5,30,5) is still above its signal line.
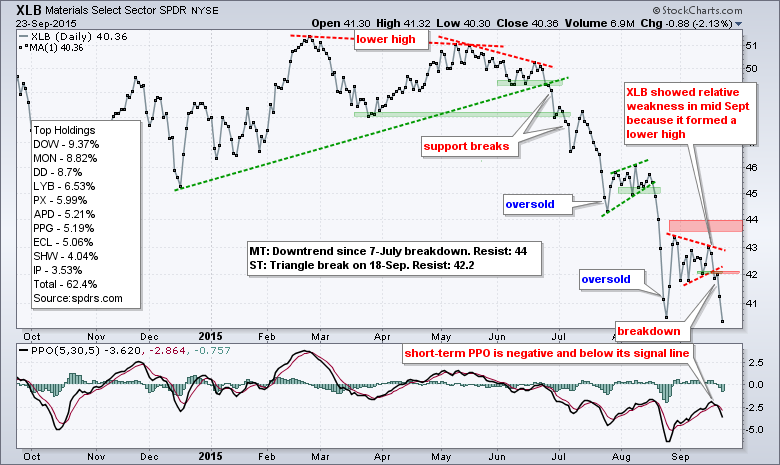
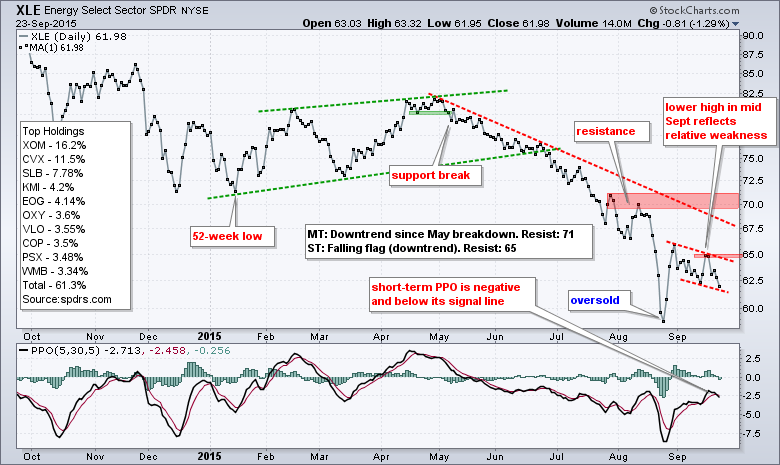
XLE and XLB are Still the Weakest
The Energy SPDR (XLE) and the Materials SPDR (XLB) were the weakest sector SPDRs throughout much of 2015 and they returned to their weak ways in September. While SPY moved higher the first two weeks of September, XLE and XLB formed lower highs from late August to mid September and underperformed. XLB broke down last week and XLE remains in a short-term downtrend after its PPO turned back down.
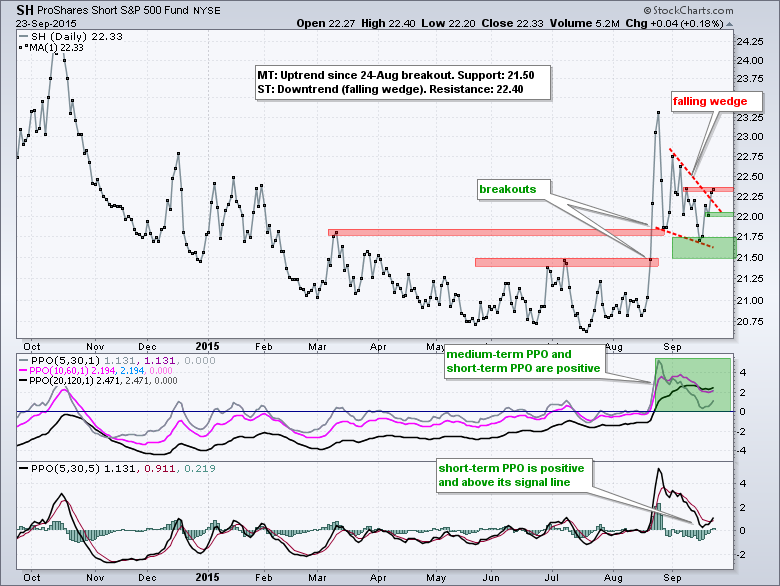
Short S&P 500 ETF on Verge of Breakout
With the major index ETFs in downtrends, all sector ETFs in downtrends and most industry-group ETFs in downtrends, the alternatives are short equity ETFs or non-equity ETFs. Bearish signals in SPY translate into bullish signals for the ProShares Short S&P 500 ETF (SH) because SH is NOT leveraged. Note, however, that there are only five short non-leveraged ETFs with any real liquidity (SH, DOG, EUM, RWM and PSQ). The rest average less than 50,000 shares volume per days.
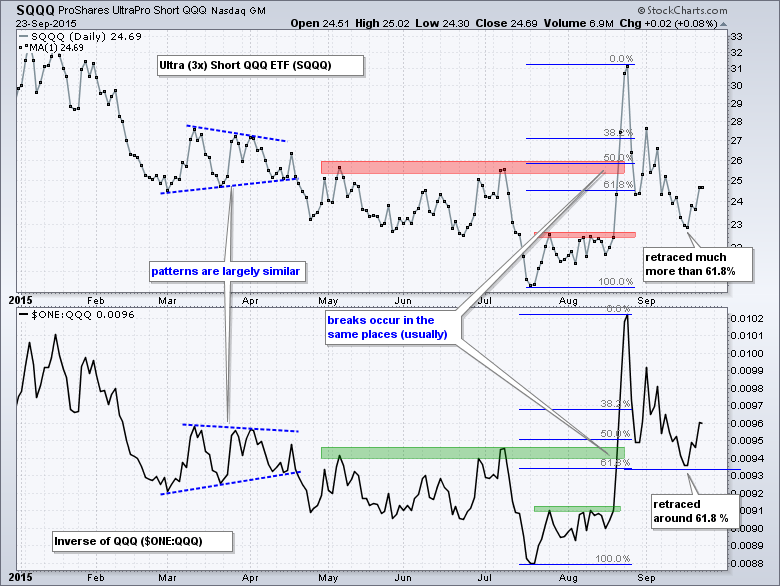
Leveraged-Short QQQ Skews Price Chart
Leveraged-short ETFs offer more liquidity and more choice, but this is a different ball game because extra volatility creates outsized moves that can distort the chart. Note that leveraged-short ETFs use options to generate returns and these options need to be rolled over periodically. This means performance will not be exactly as expected. Note that QQQ was up 1.6% year-to-date as of Wednesday's close. One would expect the ProShares Ultra (3x) Short QQQ ETF to be down as well over this timeframe, but not to the tune of -17.26%. Keep this performance discrepancy in mind when using leveraged-short ETFs.
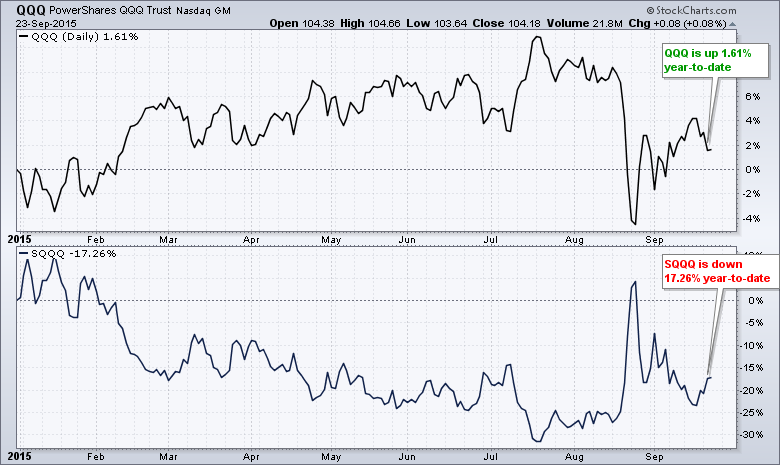
I think the chart for the long-only non-leveraged ETF should be used as the basis for trading decisions in short-leveraged ETFs. WARNING! Be careful playing the short side because counter-trend rallies can be swift and sharp - like a guillotine. The chart below shows QQQ in the top window and SQQQ in the bottom window to highlight technical differences. First, notice that QQQ exceeded its January low in August, but SQQQ did not conform and exceed its January high. Second, notice that QQQ retraced less than 61.8% on the September bounce, but SQQQ retraced much more than 61.8% with the September correction. These irregular moves in SQQQ mean QQQ should be the basis for analysis.
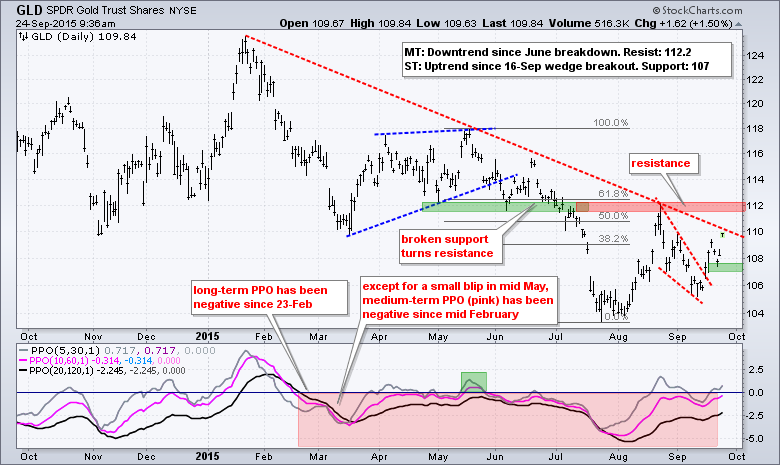
Gold Extends Short-term Breakout
The Gold SPDR (GLD) offers an alternative to equities and money is moving into this precious metal ETF. I still consider the medium-term trend down for GLD, but the short-term trend is up and the ETF looks ripe for a resistance challenge. GLD broke falling wedge resistance with a surge last week and extended this breakout with further gains this week. Short-term, I am marking support at 107 and will consider the short-term trend up as long as this level holds. Medium-term, I am marking resistance in the 112 area and will consider the trend down until a break above this level.
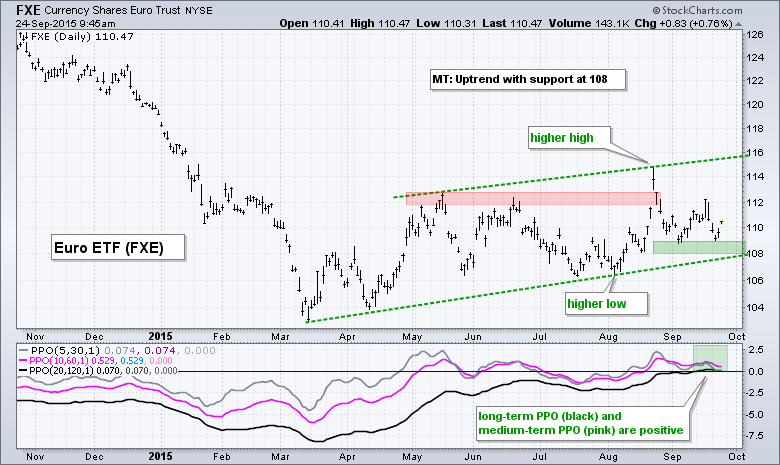
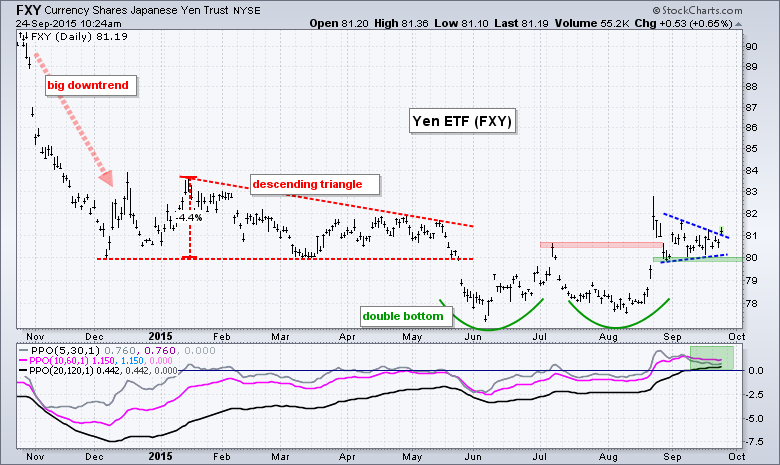
Euro and Yen Maintain Uptrends
The Dollar is also coming under pressure as the Yen ETF (FXY) and Euro ETF (FXE) surge on Thursday. FXE is in an uptrend because of the higher high, rising channel and positive PPOs. I am marking support at 108. FXY broke out in late August, fell back with a pennant and broke pennant resistance today. Notice that the PPOs are also positive. Strength in the Yen is wreaking havoc on the Nikkei 225 ($NIKK), which was down 2.75% today.
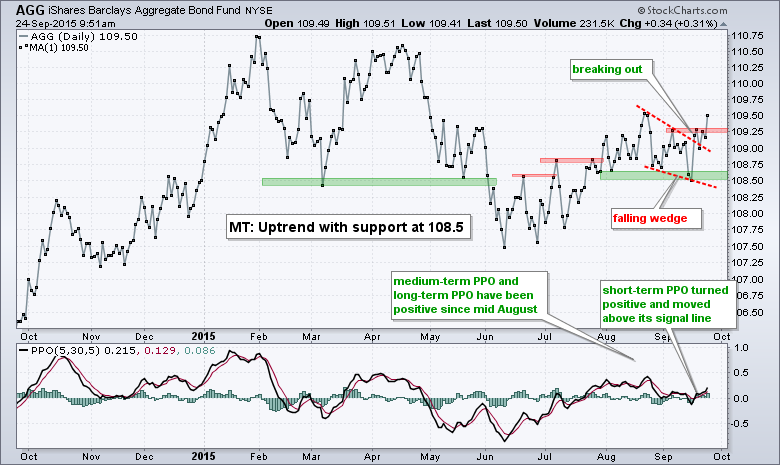
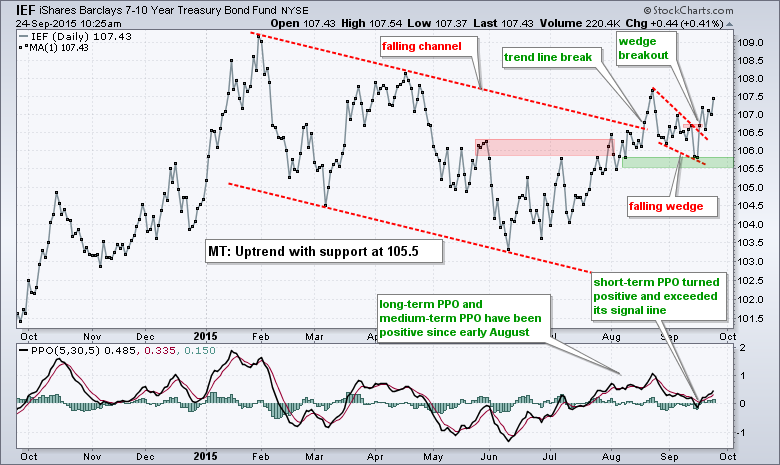
Bonds Extend on Breakout
The Aggregate Bond ETF (AGG) and the 7-10 YR T-Bond ETF (IEF) are also strengthening as money moving out of stocks. This relationship makes sense because bonds are the natural alternative to stocks and bonds are also a relative safe-haven. AGG broke wedge resistance last week and surged to 109.5 today. IEF also broke out last week and remains in an uptrend overall.
*****************************************
Thanks for tuning in and have a great day!
--Arthur Hill CMT
Plan your Trade and Trade your Plan
*****************************************


