Note that I will add a video around 11AM ET. Stock futures were higher before the employment report and then moved sharply lower after non-farm payrolls came in below expectations. Bonds are moving higher and the 10-YR Treasury Yield ($TNX) fell below 2%. The decline in stocks and rise in bonds is nothing new. Stocks broke down in late August as the major index ETFs broke important support levels. Bonds broke out in mid August and reversed their medium-term downtrends. That is about all we need to know right now. Stocks are not the place to be and bonds are the place to be.
Stock Correlations are on the Rise
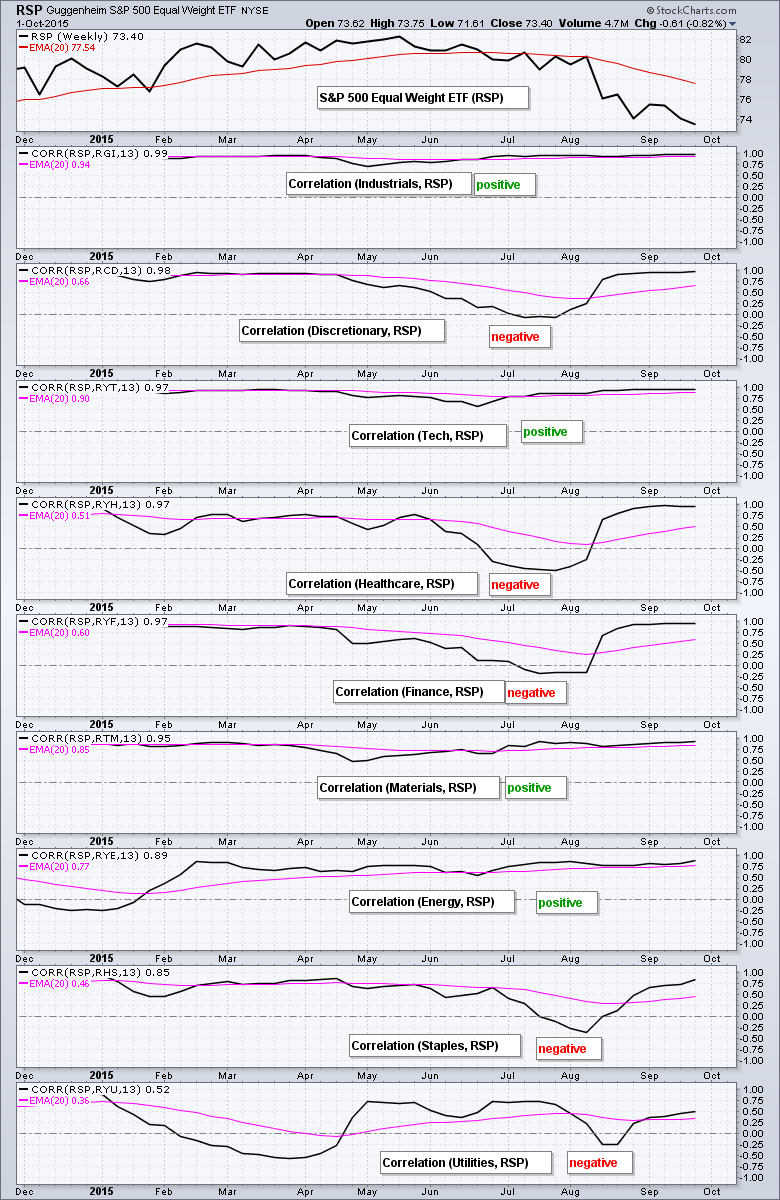
Keep in mind that stocks are a highly correlated asset class and this correlation rises during broad market declines. The chart below shows the Equal-Weight S&P 500 ETF (RSP) and the Correlation Coefficients for RSP and the nine equal-weight sector ETFs. These correlations are ranked from high to low. First, notice that four sectors were negatively correlated with RSP in July (consumer discretionary, healthcare, finance and consumer staples). This suddenly changed in August when the market broke down and all sectors became positively correlated by the end of August. Currently, six of the nine sectors have Correlation Coefficients greater than .90 and eight of the nine are greater than .80. The Equal-weight Utilities ETF (RYU) has the lowest correlation at .52, but it is still positive overall. This tells us that there are few places to hide when the broad market trend turns down.
Trend is Clear for SPY
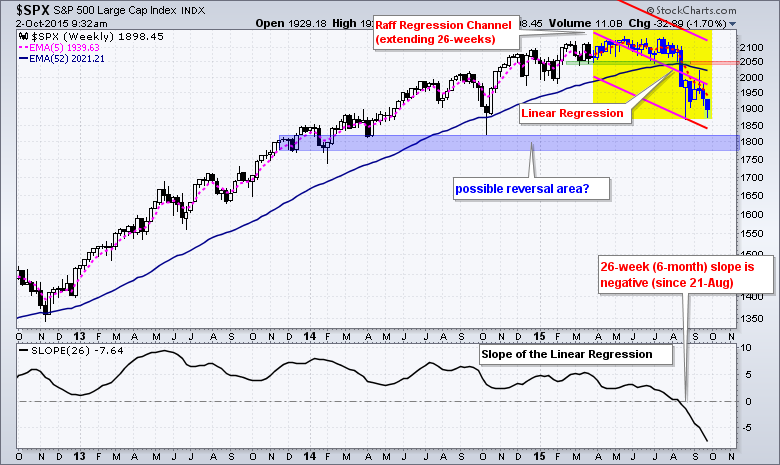
I am going to show with some weekly charts of SPY, QQQ and IWM for some perspective. I call these the big three because they represent large-caps, large-cap techs and small-caps. We don't need to follow 10 broad index ETFs because they are all highly correlated. The first chart shows SPY with the 5-week EMA in pink, the 52-week EMA in blue and the 26-week Aroon brothers in the indicator window. The bulk of the evidence is bearish and the trend is down. SPY broke support on August 21st, Aroon Down hit 100 on August 21st and the 5-week EMA crossed below the 52-week EMA on September 4th. Note that these dates refer to the Friday close of each week. At this point, broken support turns first resistance and a close above 202 is needed to get the uptrend back on track.
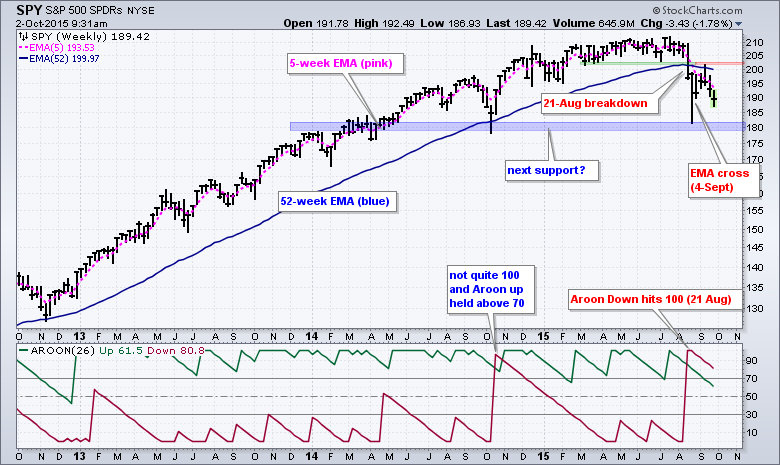
Why these indicators and these settings? First, I am using these indicators in conjunction with basic chart analysis (patterns, support-resistance breaks, peaks and troughs). Second, I am looking for more than one piece of evidence to substantiate trend changes. A 5-week EMA is around one month and a 52-week EMA is a year. This combination mimics the price action of a monthly chart and a 12-month moving average. A close below the 12-month EMA is bearish and so is a close below the 52-week EMA. I added the 5-week EMA to smooth out the weekly fluctuations and reduce whipsaws. 26-period Aroon covers six months. An uptrend signals when Aroon Up hits 100 and this signal remains valid until Aroon Down hits 100.
4th Quarter Seasonal Patterns Come into Play
The trend is down and this means support levels really don't matter. In other words, the downtrend is the dominant feature and support levels are not expected to hold. That is why I generally refrain from showing supports in a downtrend and instead focus on resistance.
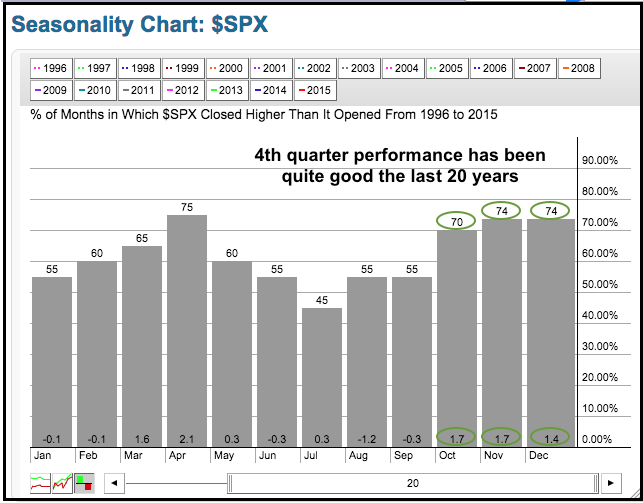
Having said that, it is October and most of us are aware that the seasonal patterns will soon be turning bullish. The chart below shows the 20-year seasonal pattern for the S&P 500. October has been higher 70% of the time with an average gain of 1.7%. November and December show an even stronger bullish tendency.
And Now for some Pure Speculation
October, of course, has only just started and Wall Street is prepared for a volatile ride as earnings season gets underway next week. So what might happen if the market turns volatile and then bottoms in October? We could see a spike below the October 2014 low and a bearish feeding frenzy in the financial media. Sentiment would turn very bearish and the S&P 500 Volatility Index ($VIX) would likely spike. Such a move would set up a bottom picking opportunity in the 175-180 area for SPY and the 1800 area for the S&P 500. This is pure speculation to take with a handful of salt.
And Now Back to Reality (the Actual Trend)
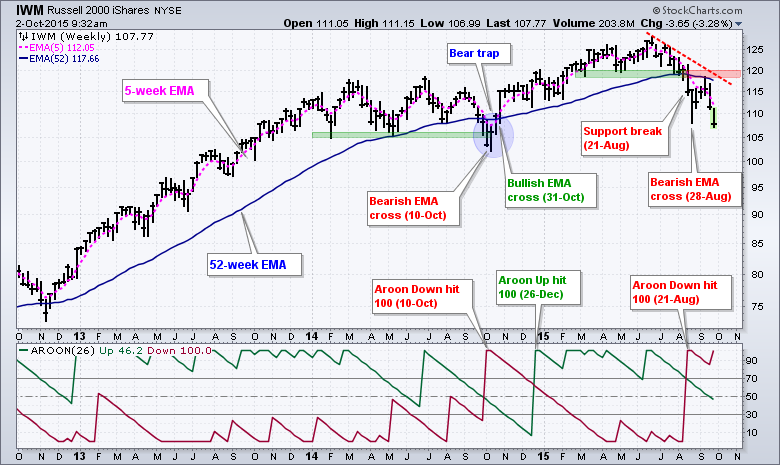
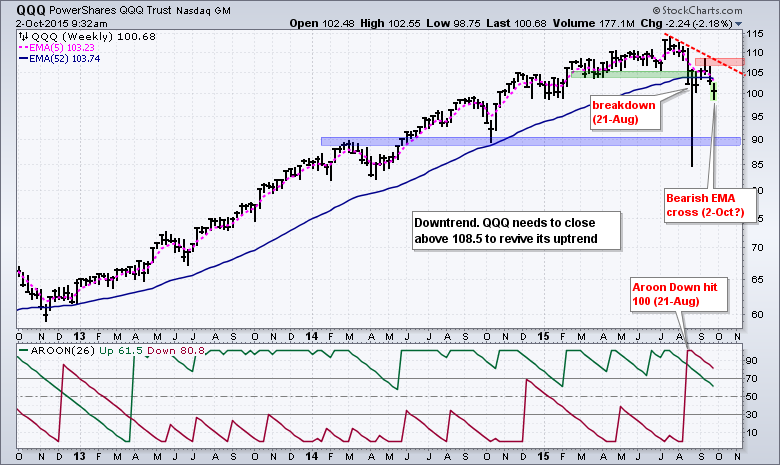
Small-caps and large-cap techs are also in downtrends. Throw in SPY and this means three of three are in downtrends. The evidence turned bearish for IWM on August 21st as the ETF broke support and Aroon Down hit 100. A bearish EMA crossover followed on August 28th. Broken support turns first resistance at 120. A move above this level would put IWM back above the 52-week EMA and negate the August support break. The evidence for QQQ is also bearish overall the ETF breaking support and Aroon Down hitting 100 on August 21st. A bearish EMA cross is in the making this week. QQQ needs to break resistance at 108.5 to revive the uptrend.
Broad Market Breadth Remains Bearish
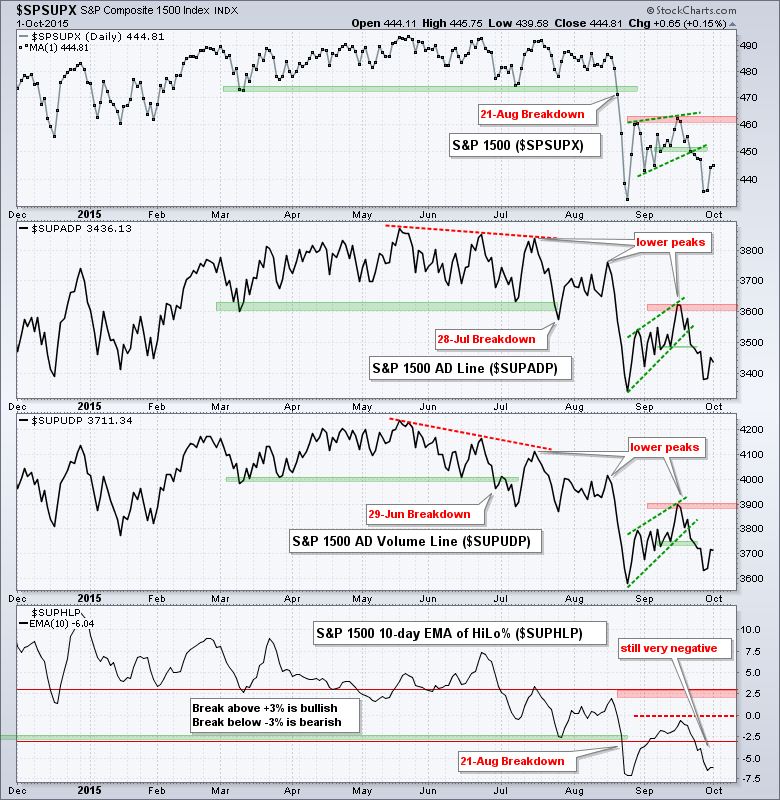
The next chart shows the S&P 1500, the AD Line, the AD Volume Line and the 10-day EMA of High-Low Percent. The AD Line and AD Volume Line turned bearish in late June and late July, respectively. Both bounced from their August lows and then resumed their downtrends with a move lower over the last two weeks. Chartists can now use the mid September highs to define the downtrends in these two indicators. A break above these highs is needed to reverse the current downtrends and turn breadth bullish again. The 10-day EMA for High-Low Percent moved back below -5% as new lows expanded again over the last two weeks. At the very least, this indicator is bearish as long as it remains below zero (which it is). It would have to break above +3% to show material strength and argue for an uptrend in the broader market.
Treasury Bonds Continue to Lead Stocks
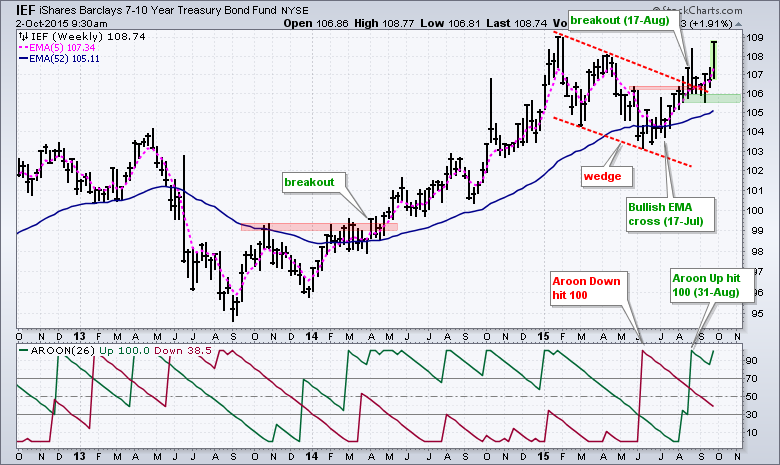
Money continues to prefer bonds (safety) over stocks (risk). The 7-10 YR T-Bond ETF (IEF) is holding its wedge breakout and its uptrend. IEF broke out on August 17th and the 5-week EMA moved above the 52-week EMA this very same week. The combination was enough to tilt the balance in favor of the bulls and this breakout is holding. Broken resistance and the early September low combine to mark first support in the 105.5-106 area. A close below 105.5 would negate the wedge breakout and call for a reassessment.
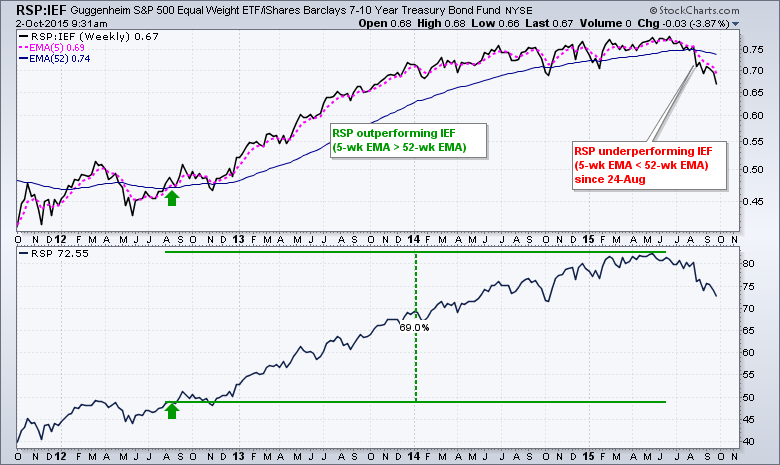
Chartists can compare the performance of stocks versus bonds by creating a ratio chart, which is also known as a price relative. The RSP:IEF ratio shows the performance of the Equal-Weight S&P 500 ETF (RSP) relative to the 7-10 YR T-Bond ETF (IEF). Risk is ON when this ratio rises because stocks are outperforming bonds. Risk is OFF when this ratio falls because stocks are underperforming bonds. The RSP:IEF ratio has been falling for over a month as the 5-week EMA broke below the 52-week EMA on August 24th. This means money is moving out of stocks (bearish) and into Treasuries (bullish).
Gold Bounces within Downtrend
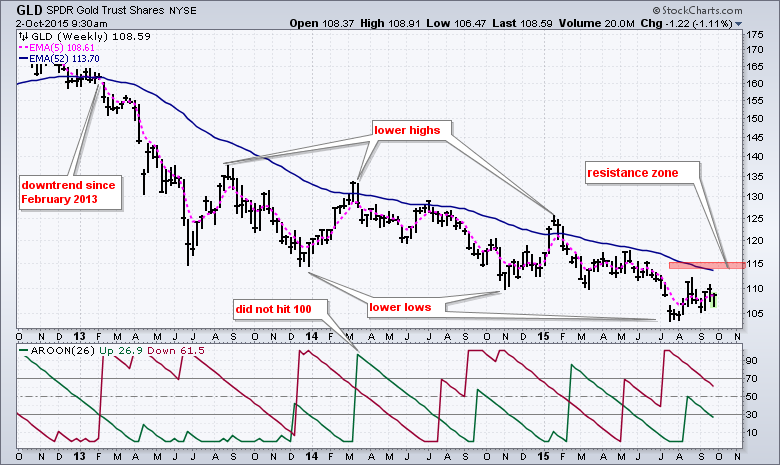
Gold is getting a bounce as the Dollar falls on Friday, but this is not enough to affect the long-term downtrend. The chart below shows the Gold SPDR (GLD) with the 5-week EMA, 52-week EMA and Aroons. Basically, the trend turned down in February 2013 with a bearish EMA cross and Aroon Down surge to 100. Despite some big bounces, GLD has not been able to reverse this downtrend and the ETF hit a new low in July. A lot needs to happen for gold to reverse this downtrend. Aroon Up needs to hit 100 and the 5-week EMA needs to break the 52-week EMA.

****************************************
Thanks for tuning in and have a good day!
--Arthur Hill CMT
Plan your Trade and Trade your Plan
******************************************


