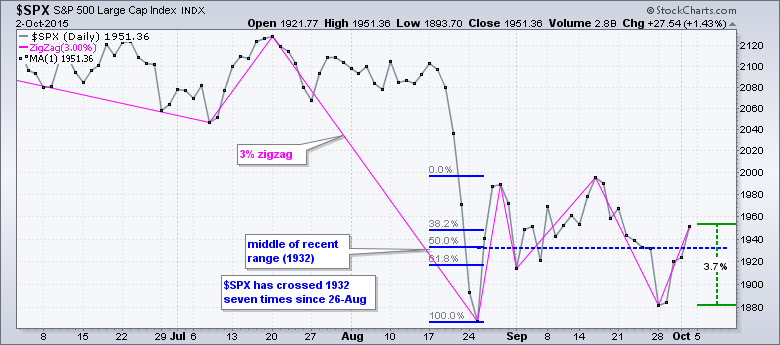
Note that I will post a video around 10AM ET. Volatility is clearly heating up as the S&P 500 completed its fifth 3+ percent swing since the August closing low. That is almost one 3+ percent swing per week (based on closing prices). With a 3.7% surge the last four days, the index is now trading in the upper half of its recent range and chartists could argue that the short-term cup is half full. Also notice that a higher low formed from late August to late September. With a little follow thru, the index could challenge the 2000 area in no time. While I am not ready to turn medium-term bullish, the volatility makes it hard to trade the short side. As noted before, counter-trend rallies can be sharp and profits can turn into losses quite quickly.
Uninspiring Breadth on Friday
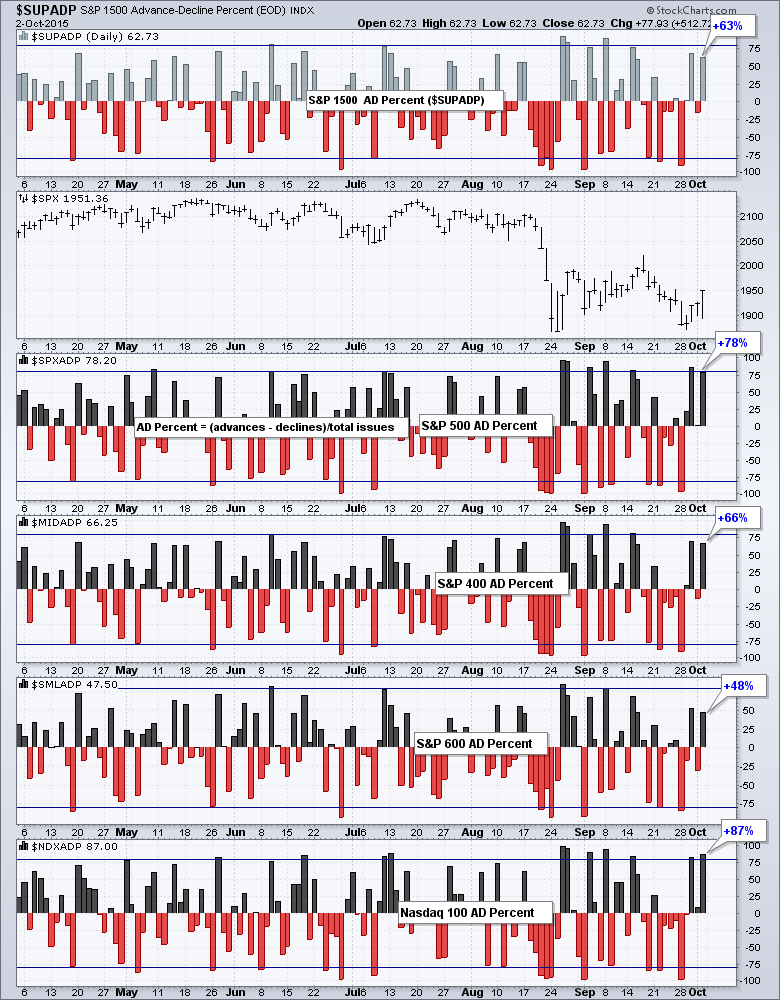
Stocks opened weak and closed strong on Friday, but stock market breadth was not that impressive. The chart below shows AD Percent for the S&P 1500, S&P 500, S&P MidCap 400, S&P Small-Cap 600 and Nasdaq 100. Even though AD Percent finished positive for all indices, small-caps and mid-caps lagged. S&P 1500 AD Percent ($SUPADP) finished at +63%, which is well below the +80% threshold that qualifies as a bullish breadth thrust for a single day. S&P SmallCap AD Percent ($SMLADP) was the weakest and finished below +50%. Nasdaq 100 AD Percent ($NDXADP) was the strongest with a +87% reading. Again, relative weakness in small-caps and mid-caps, which account for at least 1000 of the 1500 stocks in the S&P 1500, detracts from Friday's turnaround.
Large-cap Breadth Outperforms Small-cap Breadth
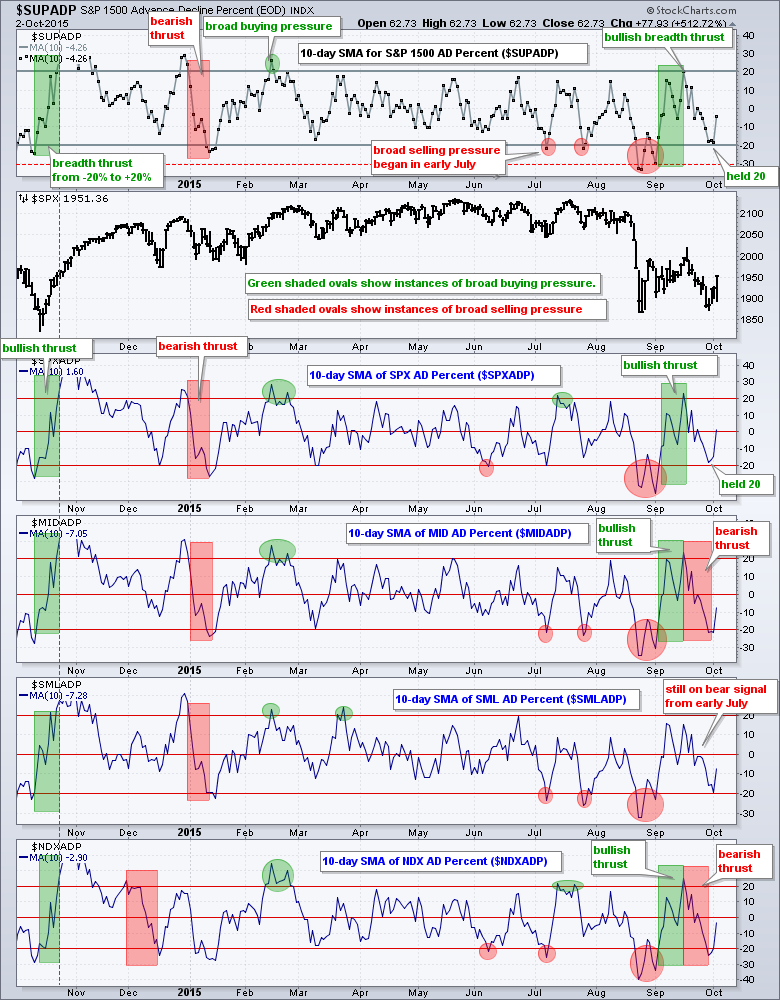
The next chart shows the 10-day SMA for AD Percent for these same indices. A bullish breadth thrust (green rectangles) occurs with a surge from below -20% to above +20% (within three weeks). A bearish breadth thrust (red rectangles) is the opposite. Overall, I view a move above +20% as bullish because it shows broad buying pressure. Similarly, a move below -20% is bearish because it shows broad selling pressure.
Overall, these breadth indicators are mixed. The S&P 1500 and S&P 500 are bullish after breadth thrusts the first half of September. Both indicators fell back, but did not break back below -20% to negate the signals. This means large-caps still have the edge over small-caps and mid-caps.
The bullish breadth thrust in the S&P MidCap 400 was negated with a move below -20% last week and S&P Small-Cap 600 breadth has been bearish since early July. In other words, the 10-day SMA for S&P SmallCap AD Percent ($SMLADP) moved below -20% in early July and has yet to counter this signal with a move above +20%. Nasdaq 100 breadth swung from bullish to bearish again.
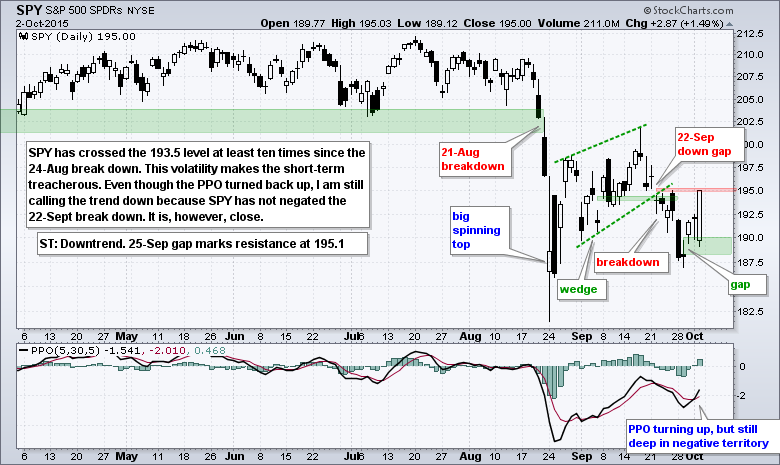
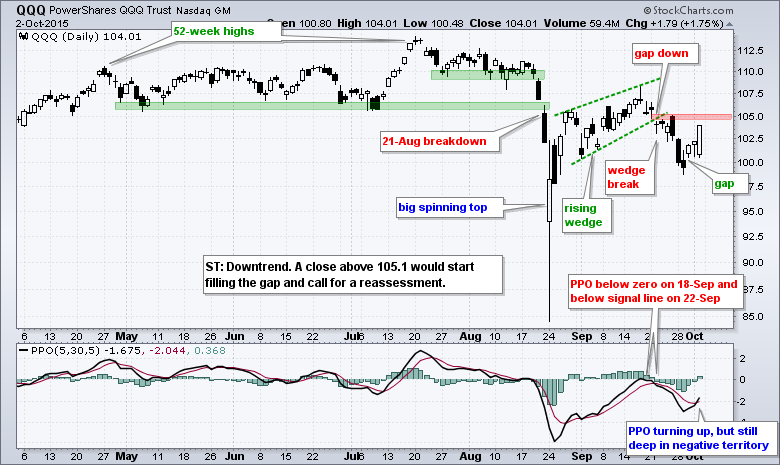
QQQ and SPY Hold Gaps with Friday Follow Thru
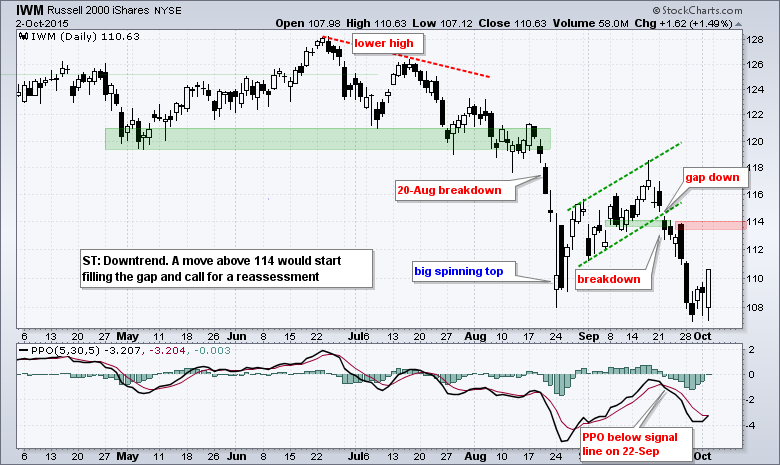
SPY is the strongest of the big three and IWM is the weakest, which fits with the breadth analysis above. Calling the short-term trend is very difficult right now. The 22-September breakdowns triggered bearish signals. SPY is close to negating this signal, but IWM is not even close and QQQ is somewhere in the middle. QQQ and SPY gapped up on Wednesday, closed strong on Thursday and surged on Friday. The gaps are holding the Friday's surge looks like a short-term follow thru day for QQQ and SPY. However, the 22-Sep breakdowns are still there and this means I need to see more follow through before considering a short-term trend change.
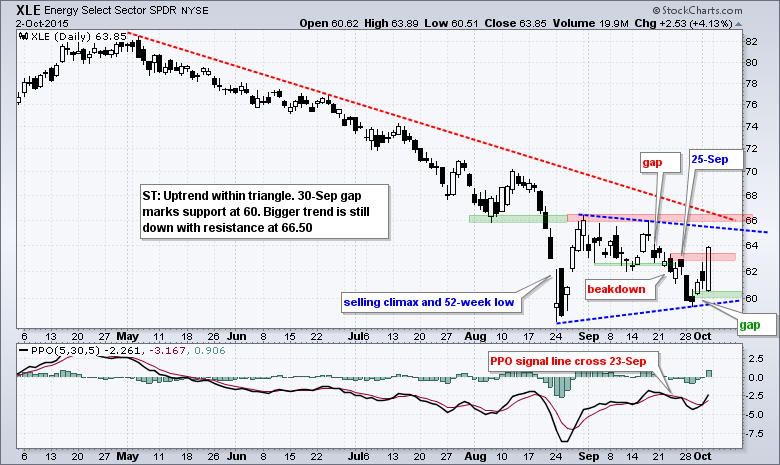
XLE, XLI and XLB Suddenly Lead
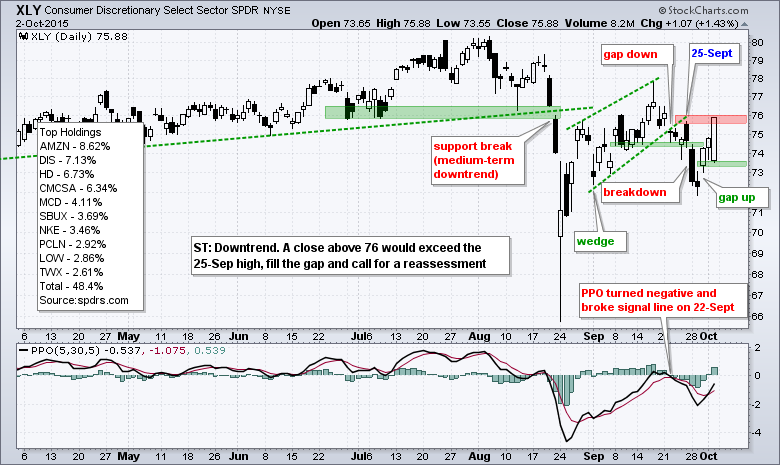
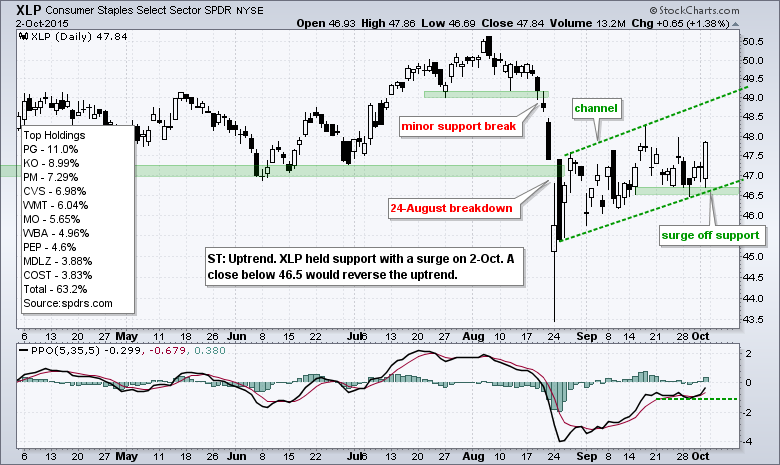
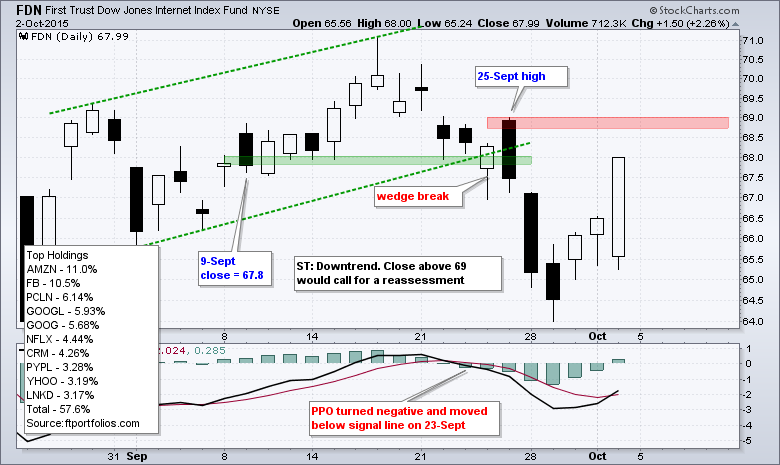
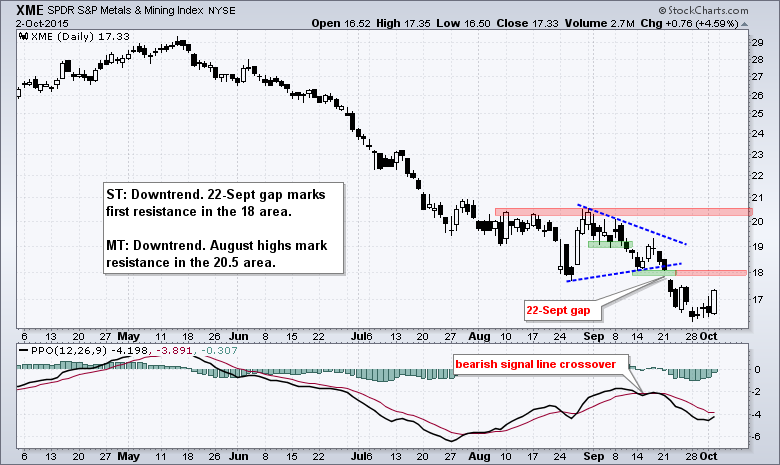
The 25-Sep high has become my short-term line in the sand for many ETFs and stocks. This high formed when stocks opened sharply higher on Friday (25-Sept) and then closed lower after a sell-off. This sell off continued the following Monday and validated the bearish signals seen on 22-Sep. A move above the 25-Sep high would negate some of these bearish signals and call for a reassessment. So far, XLY, XLI, XLE and XLB closed above their 25-Sep highs and this makes them the leaders over the last six trading days. As far as the trends are concerned, XLU and XLP were the only two in short-term uptrends already and remain the only two in short-term uptrends.
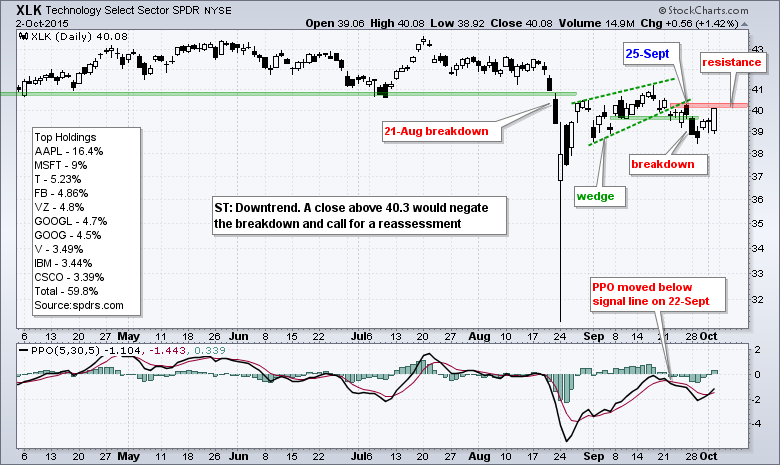
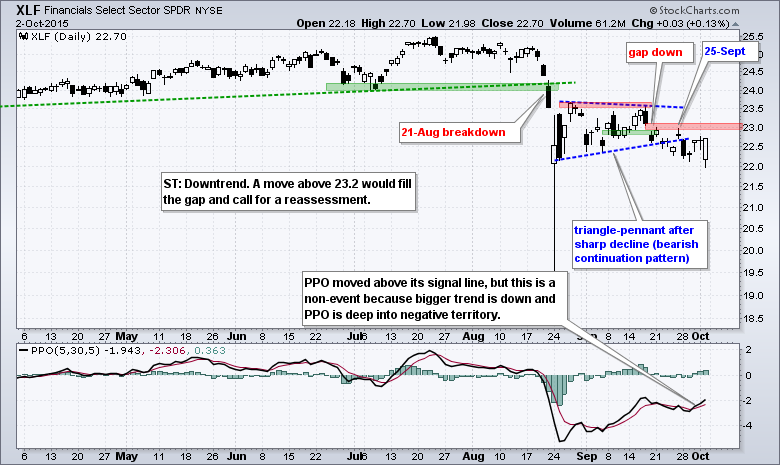
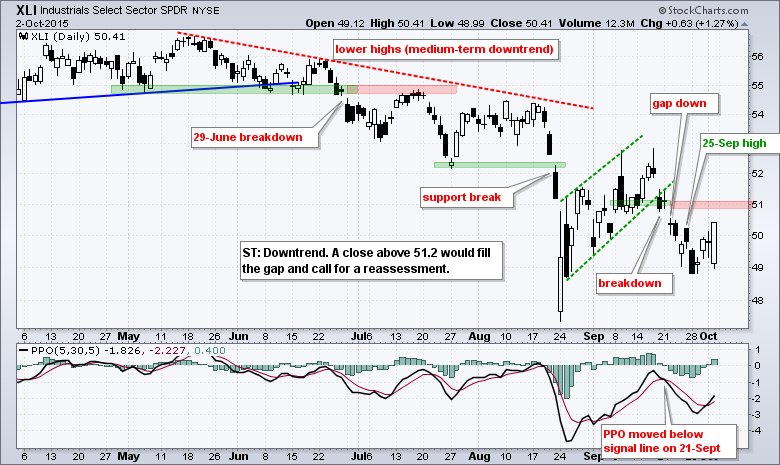

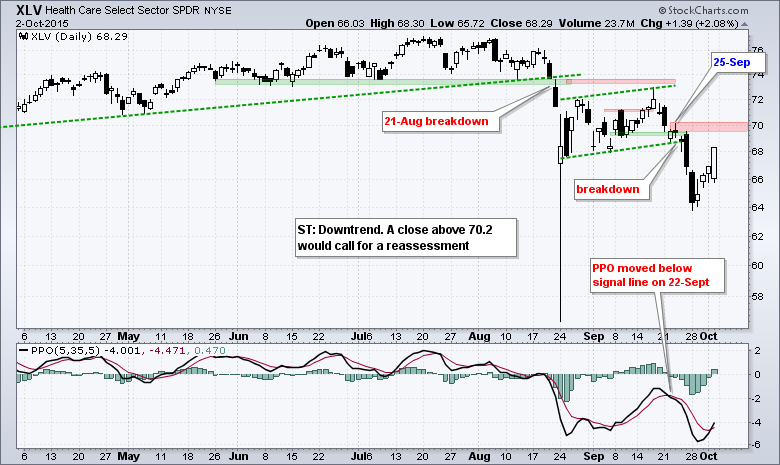
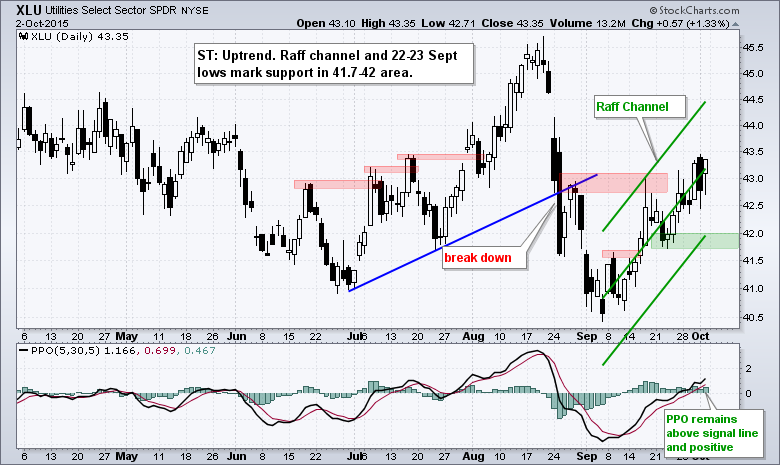
Note that the PPO (5,30,5) moved above its signal line for all nine sectors. Technically, this tells us that short-term momentum turned up. I am, however, not really interested in short-term bullish signals because the bigger trends are still down for all nine sector ETFs. There are too many short-term signals already and I prefer to weed out most short-term signals that go against the bigger trend. Yes, there are always exceptions. Medium-term, the 20-day EMA is below the 120-day EMA for all nine sector SPDRs and the 10-day EMA is below the 60-day EMA for eight of the nine. XLU is the only sector SPDR with a positive PPO (10,60,1).
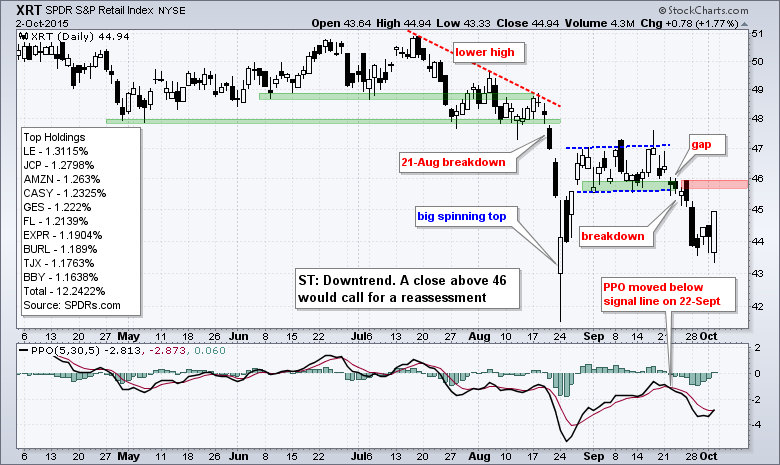
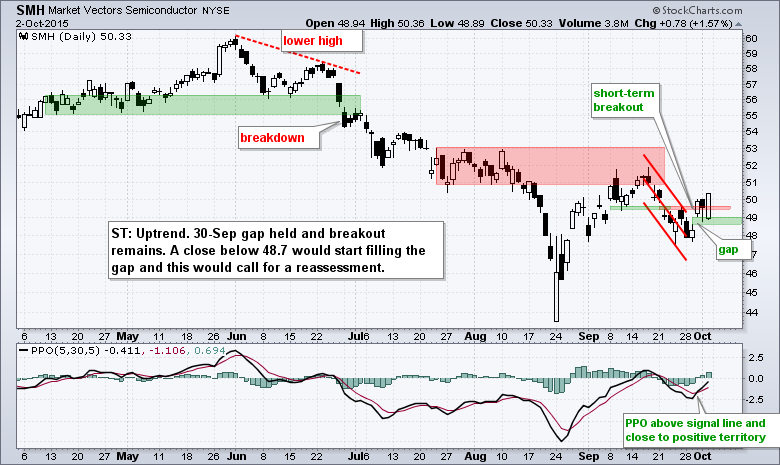
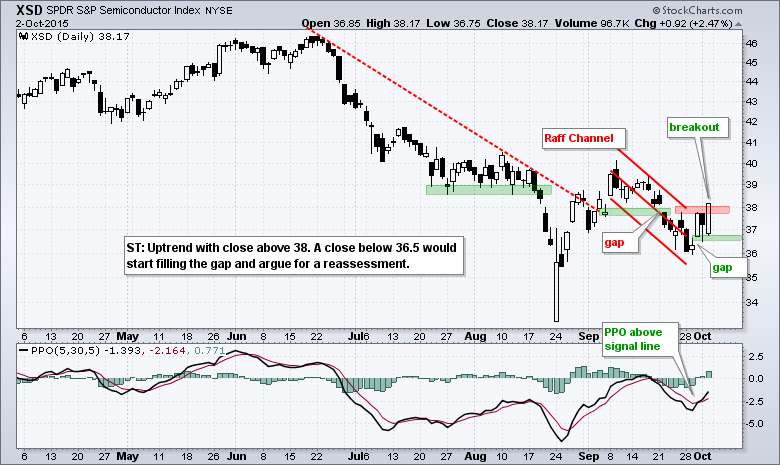
Short-Term Breakouts for SMH, XSD and IYR
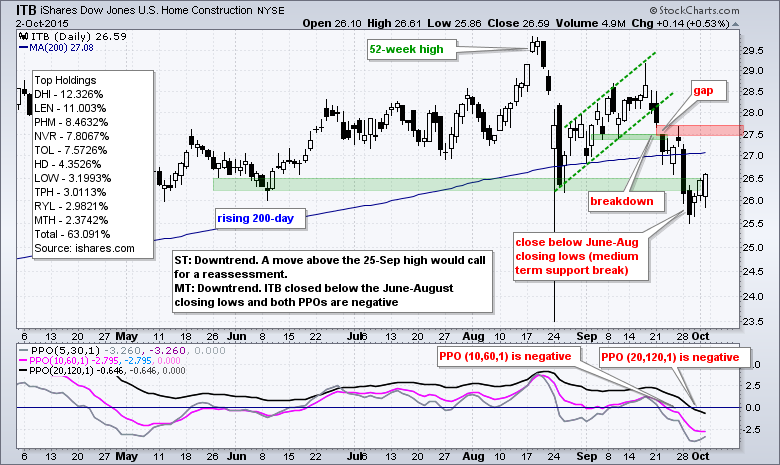
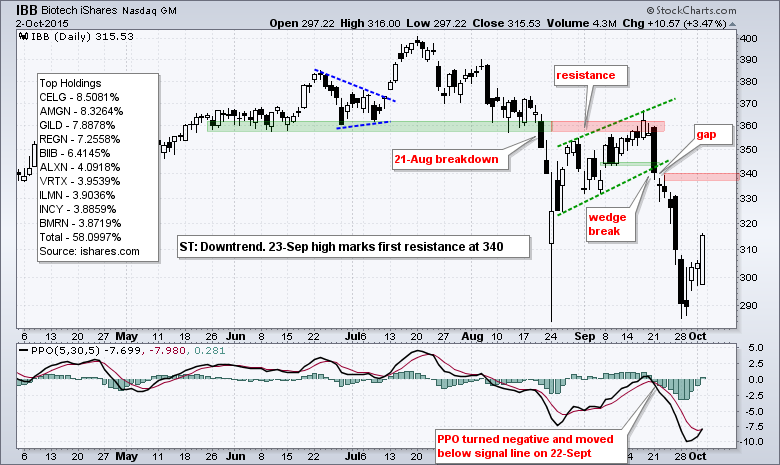
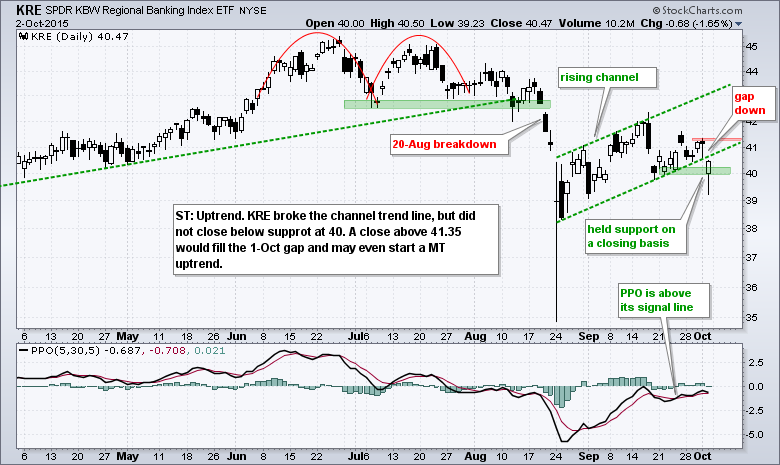
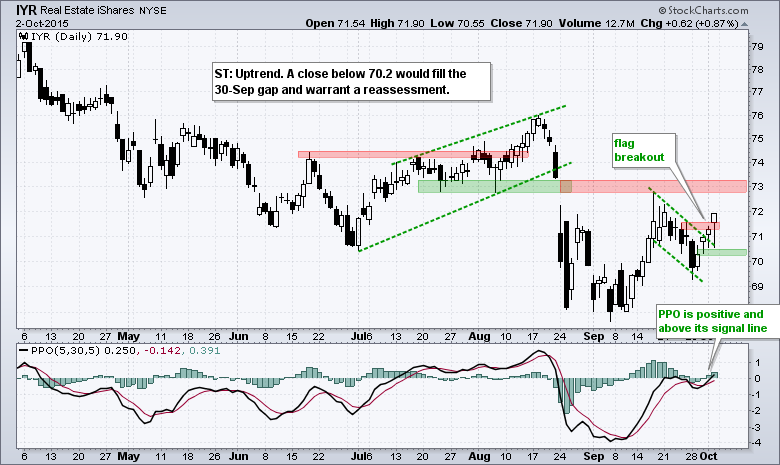
The eleven industry group ETFs featured below are in medium-term downtrends, but I am seeing short-term strength in a few groups. Semiconductors, Regional Banks and REITs held up quite well from late August to early October and showed some relative strength. Even though the bigger trends are down, SMH, XSD and IYR broke out last week and are in short-term uptrends. KRE held short-term support with a strong close on Friday.
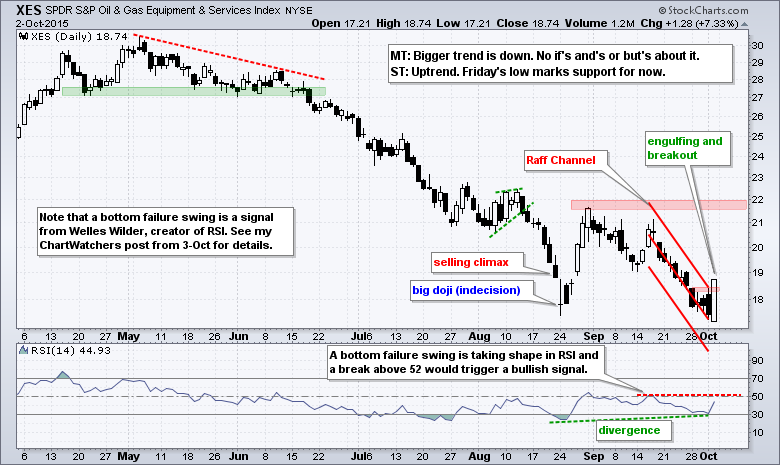
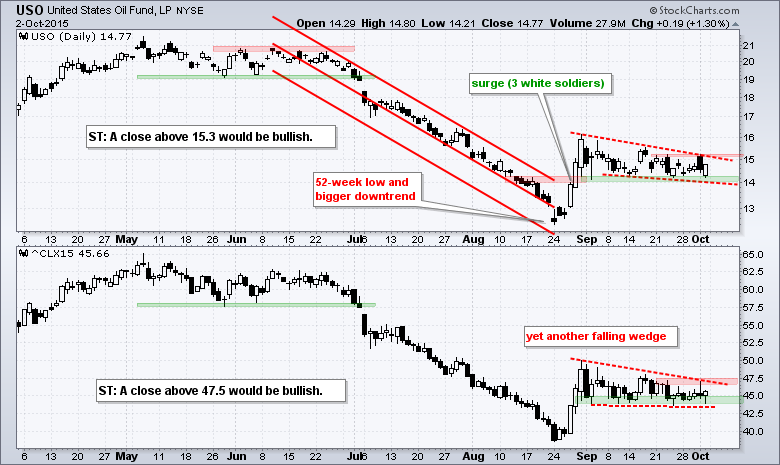
Wedges Continue to Fall for Oil
Before getting too excited about the Energy SPDR (XLE), the Oil & Gas Equip & Services SPDR (XES) and other oil-related securities, note that November Crude (^CLZX15) and the USO Oil Fund (USO) did not break out. Both closed off their intraday low, but neither broke falling wedge resistance. The medium-term trend is down after both hit new lows in August and the short-term trend is down because the wedges are falling. Oil is intriguing because it is holding well above the August low. Intrigue will not translate into a bullish signal until we see November Crude close above 47.5 and USO close above 15.50.

****************************************
Thanks for tuning in and have a good day!
--Arthur Hill CMT
Plan your Trade and Trade your Plan
*****************************************


