Today I will start with weekly charts for the S&P 500, Nasdaq 100 and Russell 2000, or the big three as I call these major stock indices. One remains in an uptrend, one is close to reversing its downtrend and one remains in a clear downtrend. I am using indices because the spike lows on August 24th skewed the ETF charts. I am using three indicators to reduce subjectivity and systematically define the bigger trend. The Slope of MACD(52,0,1), the PPO(5,52,1) and 52-week Price Channels. For those unfamiliar, the indicator details are in the next paragraph. "52" is the key number here because it represents one year and captures the long-term trend quite well. I am not looking for bullish or bearish divergences with these indicators and I not trying to read into the nuances of each squiggle. Instead, I am just trying to define the trend and trade-invest accordingly. As trend indicators, I will NEVER pick a bottom or forecast top using these indicators, but I will have pretty good idea of the current trend and defining the trend is more than half the battle here.
Three Trend Indicators
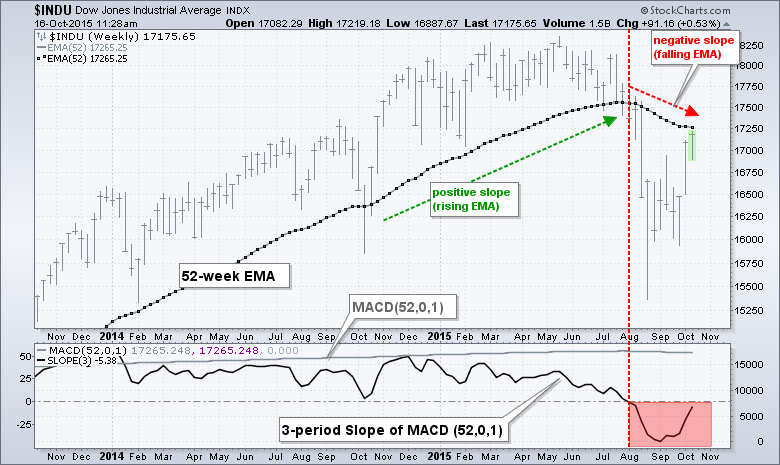
I will describe each of these trend indicators using the Dow Industrials. First, there is the 3-period Slope of the 52-week EMA, which is positive when the EMA is rising and negative when the EMA is falling. This indicator is a hack because I am showing it as the 3-period Slope of MACD(52,0,1), which is the 52-week EMA less Zero. This means MACD(52,0,1) is just the 52-week EMA of the Dow. I added the Slope as an indicator of an indicator using the advanced options. The trend is considered down when the 52-week EMA is falling and up when rising.
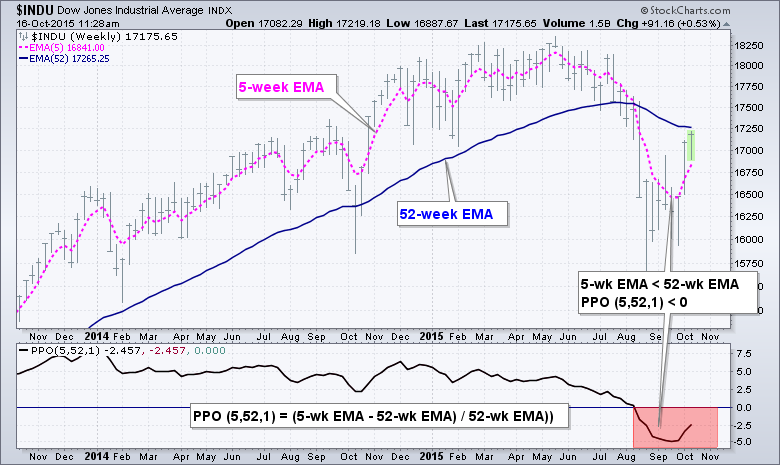
The second indicator is the PPO(5,52,1), which is the difference between the 5-week EMA and the 52-week EMA. The indicator is positive when the 5-week EMA is above the 52-week EMA and negative otherwise. The trend is considered up when the PPO is positive and down when the PPO is negative. These first two indicators are usually the first to change and I use them as a pair to reduce whipsaws. In other words, both must be negative before considering a downtrend.
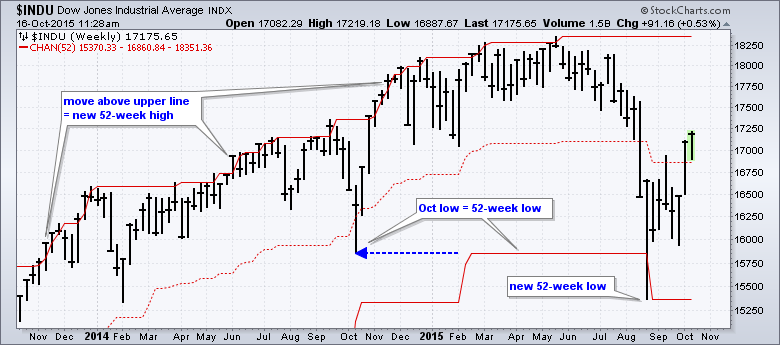
The third indicator is the 52-week Price Channel, which defines the 52-week high-low range. The indicator is considered bullish after a touch of the upper channel (52-week high) and remains bullish until a touch of the lower channel (52-week low). This indicator usually lags the two and triggers after an extended trend move. As you can see, all three indicators for the Dow are bearish. In fact, it is one of the few major indices to hit a 52-week low in August. I am not a big fan of the Dow because it has only 30 stocks and it is a price-weighted average, which means the stocks with the highest price carry the most weight.
Trend Evidence for the S&P 500
Two of three indicators are still bearish for the S&P 500 and this means the bigger trend remains down. The 52-week Price Channel indicator stayed bullish because the S&P 500 held above its October low and did not dip below the lower channel line. This means it will only take one indicator to tilt the balance back to the bulls and the 3-period Slope of the 52-week EMA is very close to turning positive again.
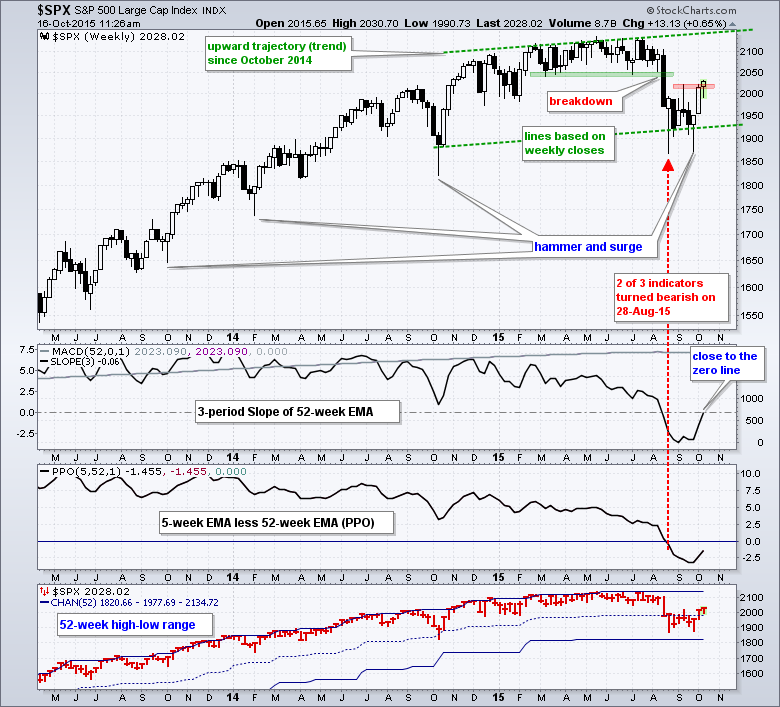
On the price chart, the index formed big hammers in August and September, and followed through on the second hammer with a surge above 2000. Basically, we have seen a big reversal week (hammer) and a big follow through week (close above 2000). Also notice that the index held above the October 2014 low and it is possible that a rising channel is taking shape. At this point, I am waiting for the Slope of the 52-week EMA to turn positive before considering a trend reversal.
Long-term Trend in Nasdaq 100 Never Reversed
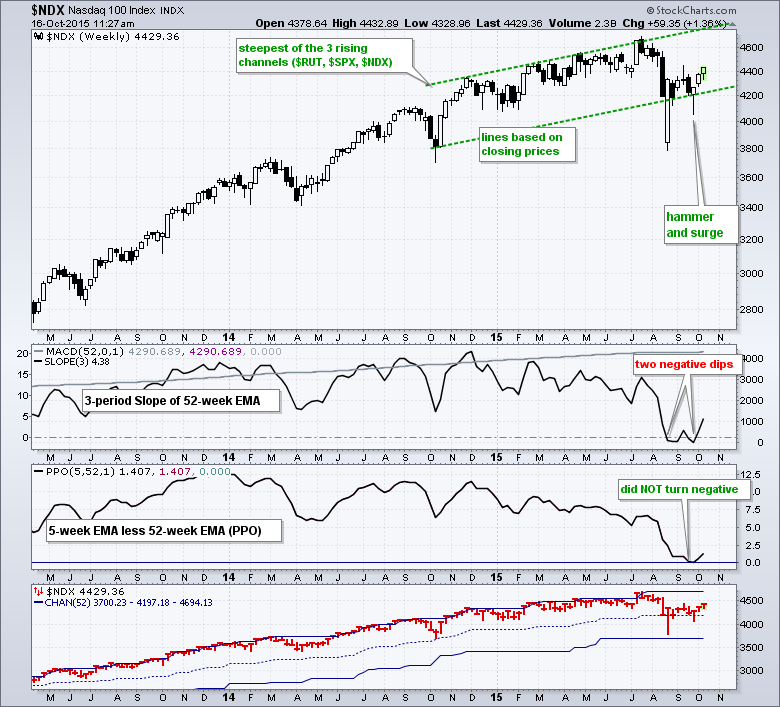
Despite the biotech debacle, a bearish signal never triggered for the Nasdaq 100 and the index remains in a long-term uptrend. The 3-period Slope of the 52-week EMA turned negative twice, but the 5-week EMA never closed below the 52-week EMA and the index did not record a 52-week low. On the price chart, the index formed a hammer in late September and followed through with a surge above 4400. The green trend line extends from the closing low in October 2014 to the closing low in August 2015 and this is the steepest trend line of the three major stock indices. In my opinion, a trend line does not mark a solid support or resistance level. Instead, it reflects the rate of ascent or descent (rise over run) for a price move. A trend line break, therefore, signals a change in momentum, but not necessarily a change in the trend.
Russell 2000 Remains the Big Laggard
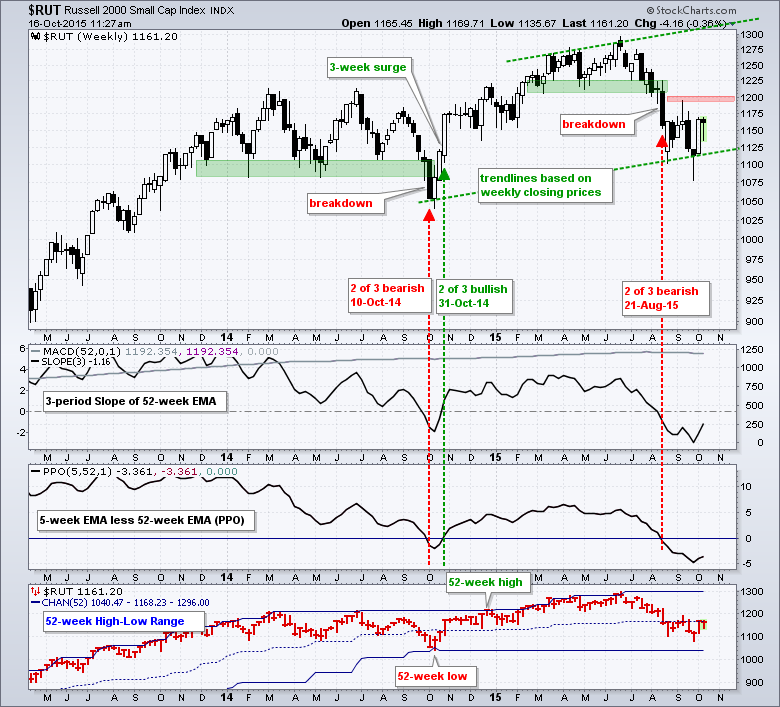
The Russell 2000 suffered the biggest decline of the three from July to September and the long-term trend is down. The 3-period Slope of the 52-week EMA and the PPO(5,52,1) turned negative on August 21st and both remain negative. The index did not hit a 52-week low because it held above its October low. At this point, we need to see one more indicator turn positive to put the uptrend back on track.
Breadth Surges, but is it Enough?
The breadth picture for the S&P 1500 is mixed and I am not ready to call it bullish. The AD Line and AD Volume Line formed higher lows and broke above their mid September highs. Technically, this puts them in uptrends. We even saw a bullish breadth thrust from September 28th to October 8th (green shading). For comparison, the red shading highlights the August plunge in the AD Line and AD Volume Line. I am not ready to turn bullish on these indicators because they have yet to take out their August highs and fully erase this breadth plunge. Yes, I am looking for more follow through.
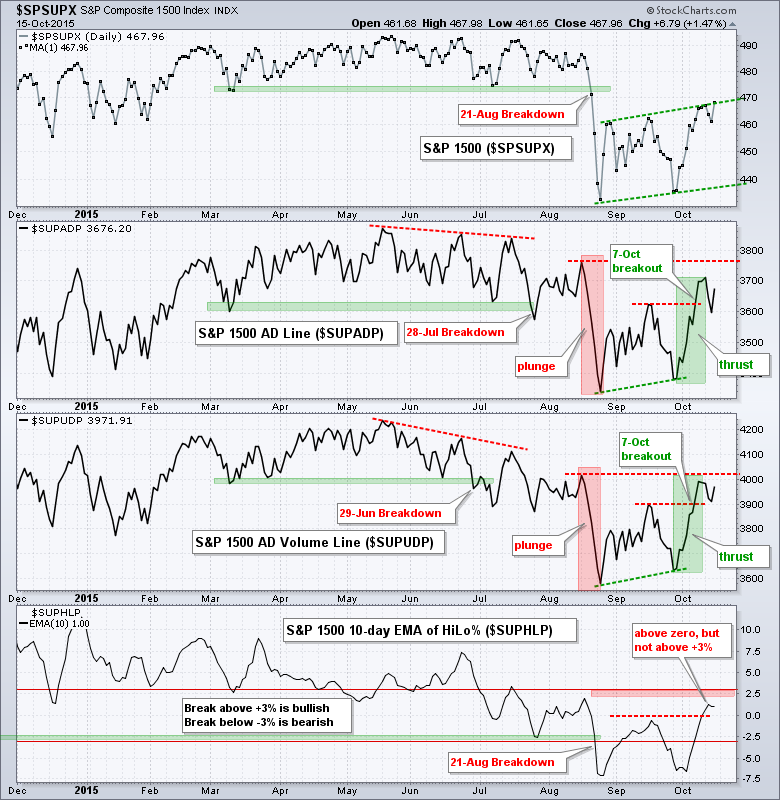
The bottom window shows the 10-day EMA for S&P 1500 High-Low Percent ($SUPHLP). It broke below -3%, which is my bearish threshold, on August 21st and remains bearish. Even though the indicator moved above zero this week, a move above +5%, which is the bullish threshold, is required to reverse the bearish signal.
Hosting ChartWatchers LIVE!
I will be sitting in for Chip this Saturday at 10AM ET and hosting the ChartWatchers LIVE Webinar with Bill Shelby. Including the charts above, I will discuss the following:
- Tips and Tricks: Advanced Indicator Settings (Slope of an EMA)
- Broad Market Overview and Sector Analysis
- Treasuries, Gold, Oil and the Dollar
- 2010 versus 2011 versus 2015
- This Week's Commentary Highlights
- Setting a Trend Filter
- Q&A Session
Bill will also do a segment showing some tips and tricks using the tools here at StockCharts. It promises to be a great webinar.
Click here to register (Saturday, October 17th, 10AM ET).
****************************************
Thanks for tuning in and have a good day!
--Arthur Hill CMT
Plan your Trade and Trade your Plan
*****************************************


