Stalling and not Really Falling (Yet)
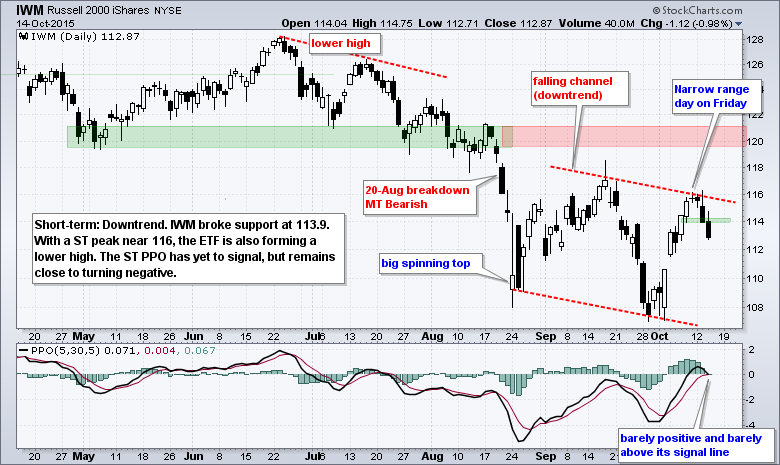
Looking at the big three major index ETFs, two of the three are still short-term bullish and have yet to break down. QQQ stalled with some serious indecision the last four days. SPY is down about 1% the last two days, but remains above support. Furthermore, all three short-term PPOs are in positive territory and above their signal line. The PPO (5,30,5) for IWM is the closest to triggering a bearish signal. My eyes remain on SPY and QQQ for decisive moves that would reverse their short-term uptrends and argue for a continuation of the bigger downtrend.
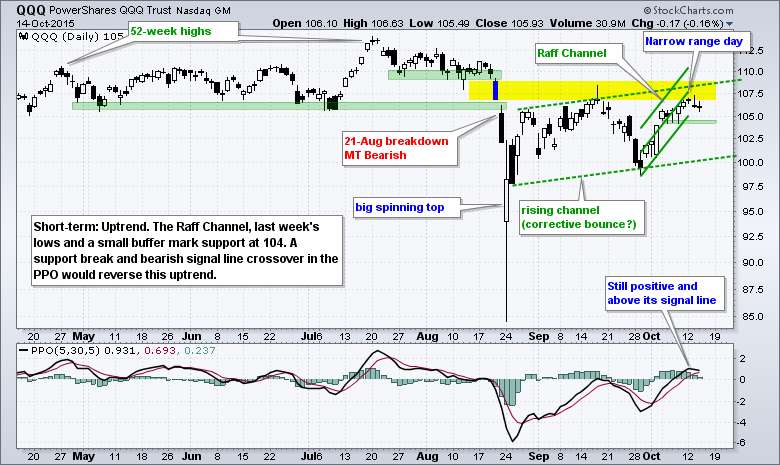
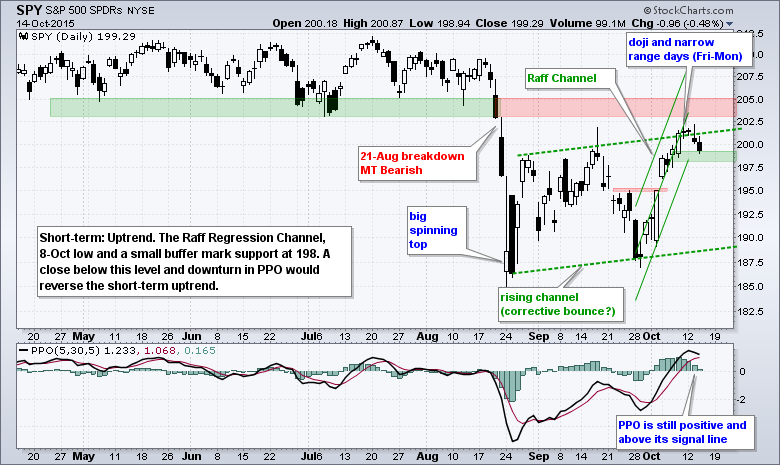
I think this is a very tricky time for the stock market. Heck, trading is always tricky and there is always a key level somewhere. Nevertheless, I think the current environment is especially tricky for three reasons. First, it is earnings season and this can increase volatility. Second, we had a bullish breadth thrust from 30-Sep to 8-Oct. This shows extraordinarily strong buying pressure that can foreshadow further gains. Third, the bigger trend turned down with the August break down and these support breaks have yet to be negated. So we have a conflict with the August breakdown and the breadth thrust, and earnings season is in the middle.
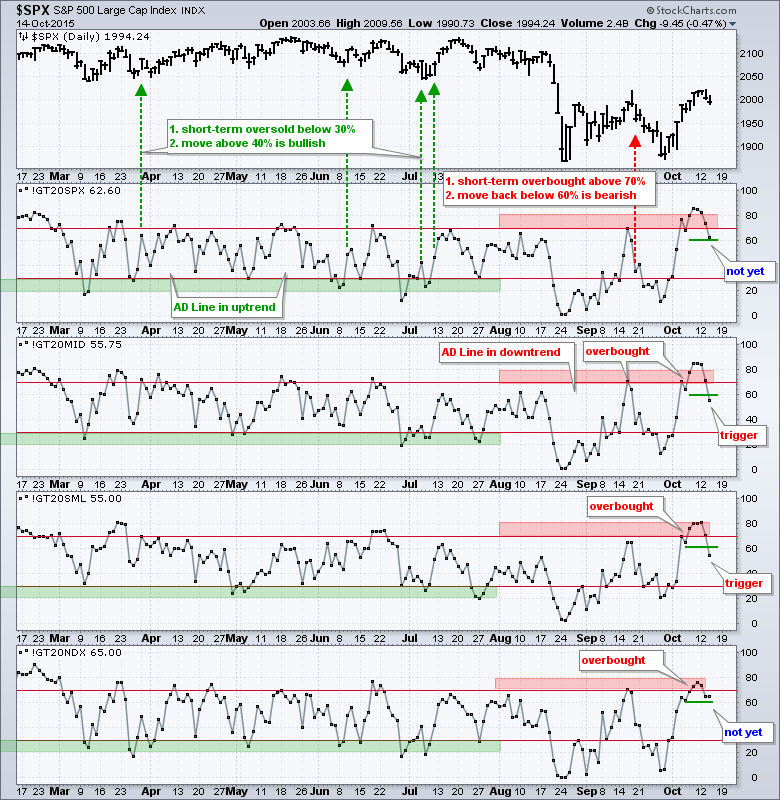
Small and MidCap Breadth Indicators Trigger
We are seeing relative weakness in small and mid cap stocks this week because the MidCap %Above 20-day EMA (!GT20MID) and the Small-Cap %Above 20-day EMA (!GT20SML) both broke below 60%. The S&P 500 %Above 20-day EMA (!GT20SPX) and the Nasdaq 100 %Above 20-day EMA (!GT20NDX) remain above 60% and have yet to trigger. This makes it a split market for the short-term.
A Tale of Two Consumer Discretionary Sectors
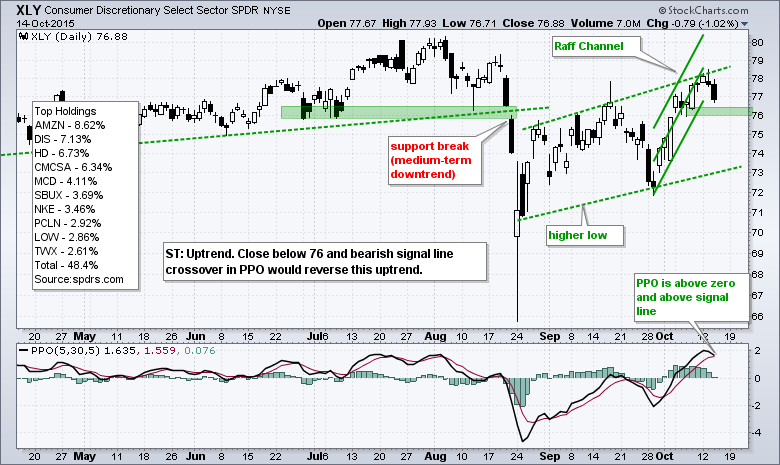
There is a lot of bifurcation in the stock market right now and this is evident when we compare the Consumer Discretionary SPDR (XLY) with the Equal-Weight Consumer Discretionary ETF (RCD). XLY is doing just fine thanks to a few large-caps, namely Amazon (AMZN), Home Depot (HD), McDonalds (MCD), Nike (NKE), PriceLine (PCLN) and Starbucks (SBUX). XLY is down around 2% over the last three months, but these six stocks are up and they account for around 30% of the ETF. On the price chart, XLY sports a rising channel since late August and the swing within this channel is up (Raff Regression Channel). This ETF would not be on my radar for short positions or negative thoughts because it shows relative strength and is one of the strong sector SPDRs. Pick on the weaker candidates if you are interested in short positions or inverse ETFs.
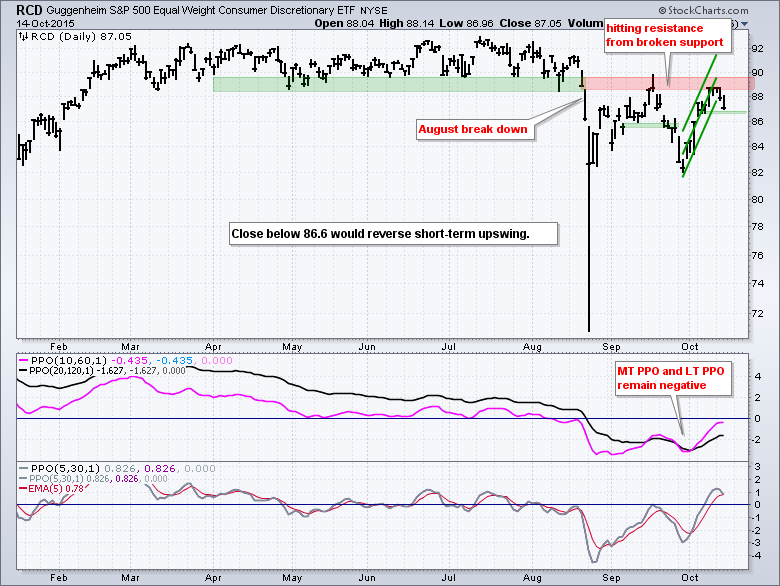
The chart for the EW Consumer Discretionary ETF (RCD) looks a little different, and a little weaker. Notice that RCD did not exceed its mid September high and hit resistance from broken support (twice). The August breakdown is holding for the "average" stock in the consumer discretionary sector. The short-term swing remains up with support marked at 86.6. A close below this level would be bearish for the most economically sensitive sector and such a move would have implications for the broader market.
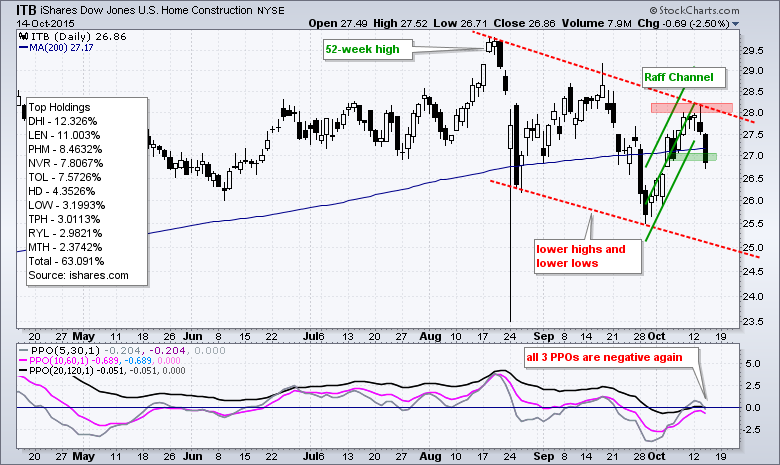
Housing and Retail Weaken
I consider housing and retail the two most important industry groups in the consumer discretionary sector, and these two groups are not performing well. The Home Construction iShares (ITB) hit resistance in the 28 area last week and fell sharply the last two days. Notice that the ETF broke short-term support at 27 and the PPO (5,30,5) moved back below the zero line.
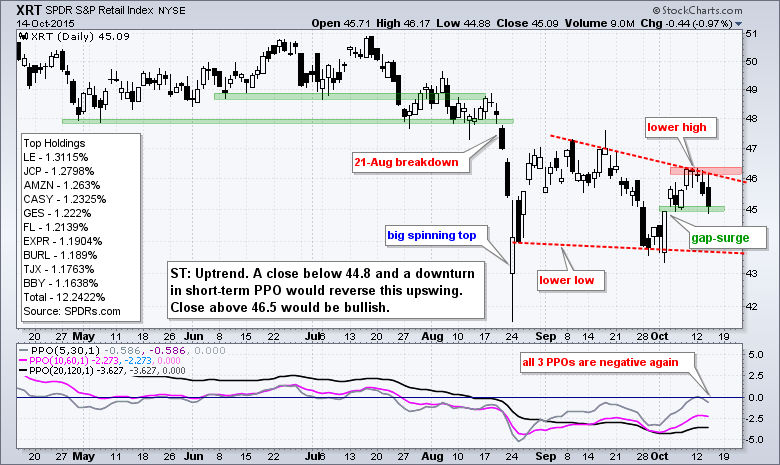
On a closing basis, the Retail SPDR (XRT) formed a lower low in late September and a lower high here in October. The September high is what I call a "benchmark" high. Stocks and ETFs trading above this high show chart strength. Stocks and ETFs trading below this high show chart weakness. XRT clearly show relative chart weakness and clear downtrend since the August breakdown. The ETF turned down rather hard the last three days and I will mark resistance at 46.5.
Brokers and Regional Banks Lead Finance Sector Lower
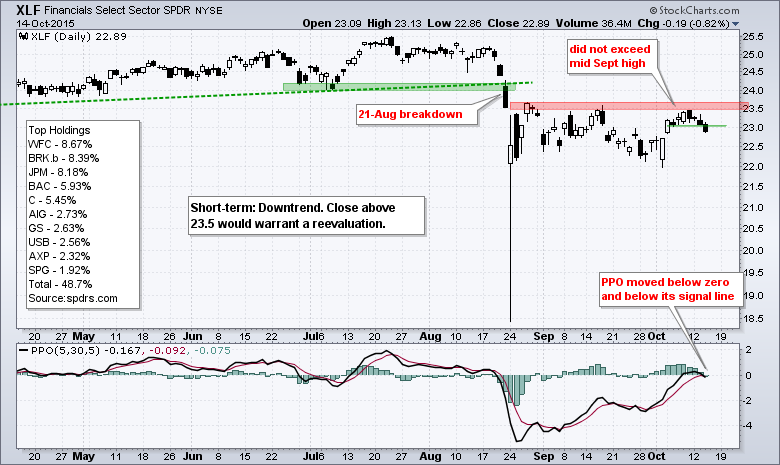
The next three charts focus on the finance sector. The Finance SPDR (XLF) represents the too-big-to-fail banks, the Regional Bank SPDR (KRE) represents the smaller regional banks and the Broker-Dealer iShares (IAI) represents the stockbrokers. XLF is one of the weakest sectors over the last two months. Note that XLF and the HealthCare SPDR (XLV) are the only two sector SPDRs that did not exceed their mid September highs. XLF has simply traded flat since the August breakdown and the ETF reversed its short-term upswing with a break below 23 on Wednesday.
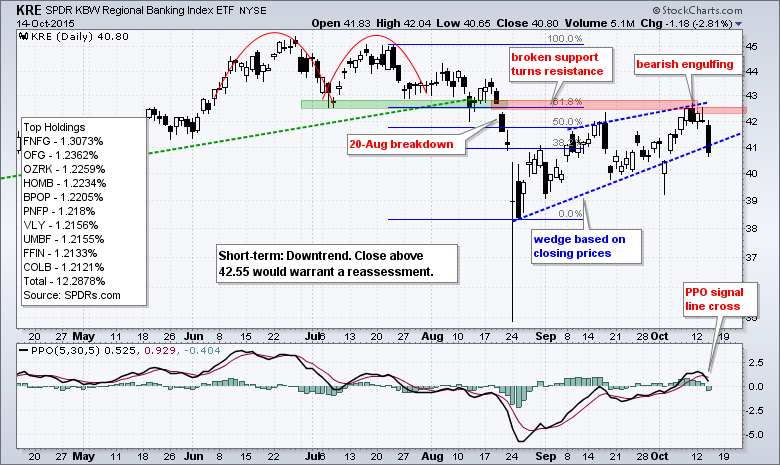
The Regional Bank SPDR (KRE) sports a classic setup with a break down, 62% retracement, rising wedge and bearish engulfing at broken support. This is classic because the wedge is typical for a counter-trend pattern and the retracement is typical for a retracement amount. After a bearish engulfing last week, the ETF followed through with a long black candlestick and wedge break on Wednesday. Note that the wedge lines are based on closing prices.
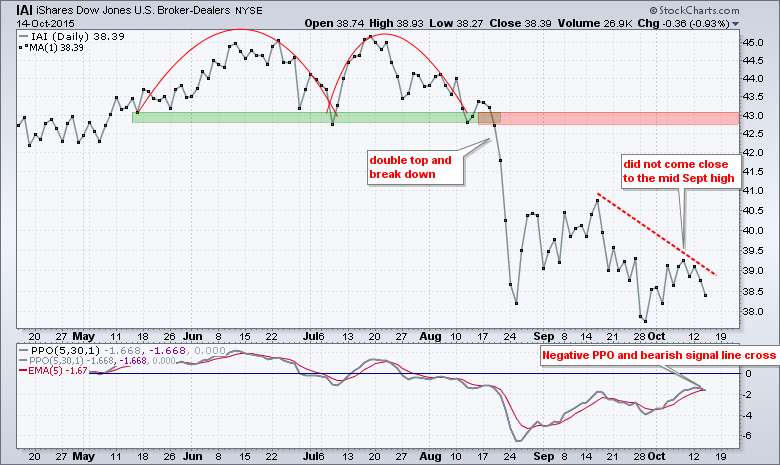
I don’t even know where to begin with the Broker-Dealer iShares (IAI) because this is one of the weakest industry group ETFs within the finance sector. Notice that IAI did not even come close to its mid September high and turned down sharply the last four days.
Semis and Internet Lead Technology Sector
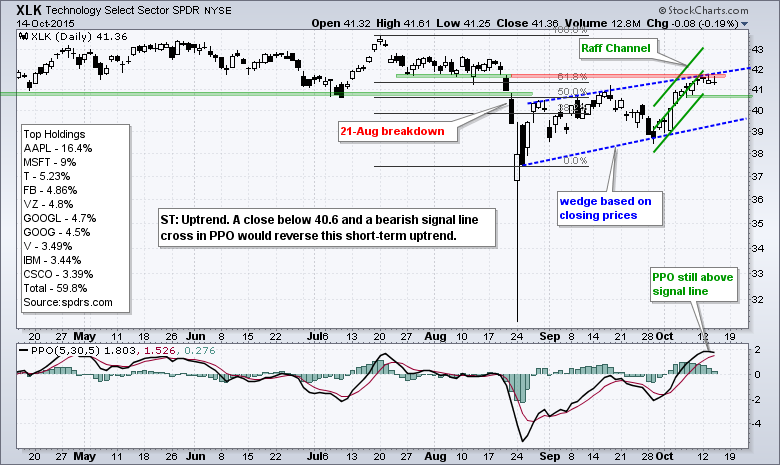
The Technology SPDR (XLK) has held up rather well and is one of the leaders. Despite an uptrend since late August, the chart sports a classic bearish setup like the one seen in KRE above (rising wedge, 62% retracement). Even though the trend is up as long as the wedge rises, I am watching the Raff Regression Channel and 7-Oct low (40.6) for an early signal.
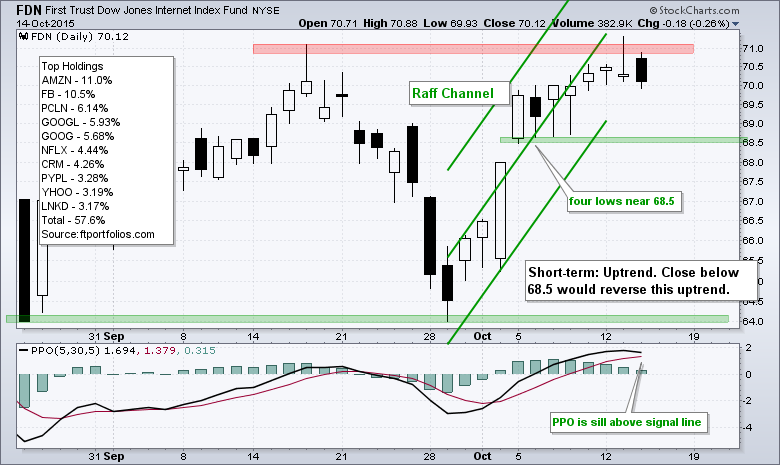
The Internet ETF (FDN) remains one of the stronger tech groups, but this ETF has stalled out over the last few days and formed a bearish engulfing on Wednesday. I would not read too much into just one day because the short-term trend is still up. The Raff Channel and four intraday lows mark support at 68.5. Note that I am using a chart dating back to August 25th because I want to see candlesticks and remove the spike low on August 24th.
The Semiconductor SPDR (XSD) remains on a tear as M&A heats up in this group. With the Dell-EMC deal, M&A activity for 2015 reached $1.68 trillion and is on pace to exceed the high in 2000, which was $1.73 trillion. M&A is positive for the stock market because it reduces the supply of stock and it pushes up the share price of the acquisition target. It may signal a top, but I am not going to use M&A activity as a signal. It is just an interesting tidbit and price action is what really matters. Returning to XSD, the ETF broke out on October 2nd and surged above 41 on Wednesday. The Raff Regression Channel and Tuesday's low mark first support at 40.

Bonds Surge Yet Again
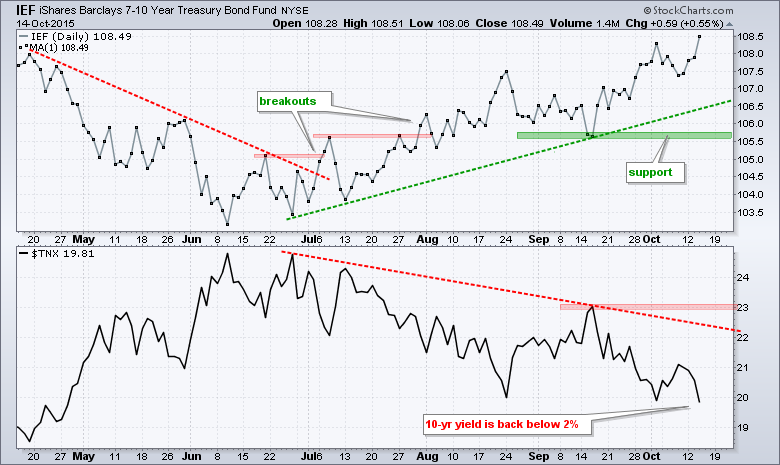
Continued strength in Treasurys is another reason for concern with the stock market. Even though the decline in Treasury yields means the Fed will not be raising rates anytime soon, the decline in yields indicates that the bond market is not impressed with the economy, and this is negative for stocks. Furthermore, money moving into bonds is money that is not available for stocks. Before getting too bearish on stocks, don't forget that there is always the Yellen put out there and any hints of more QE could send stocks higher. The 7-10 YR T-Bond ETF (IEF) surged to a new high for the move on Wednesday and extended its uptrend. Meanwhile, the 10-YR Treasury Yield ($TNX) fell below 2% for the second time this month.
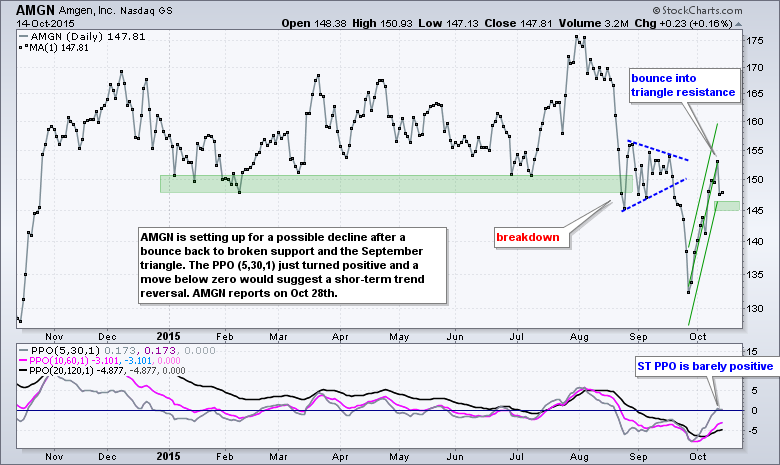
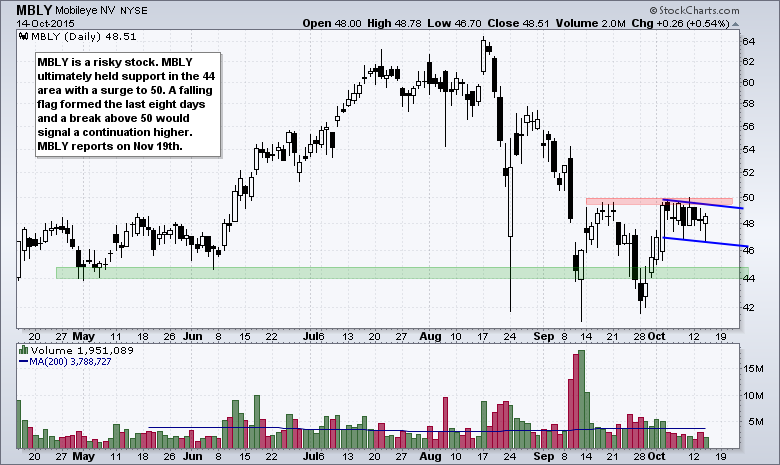
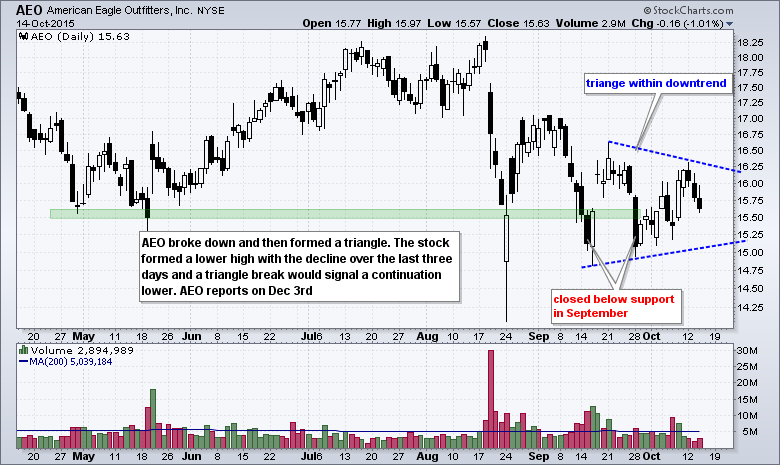
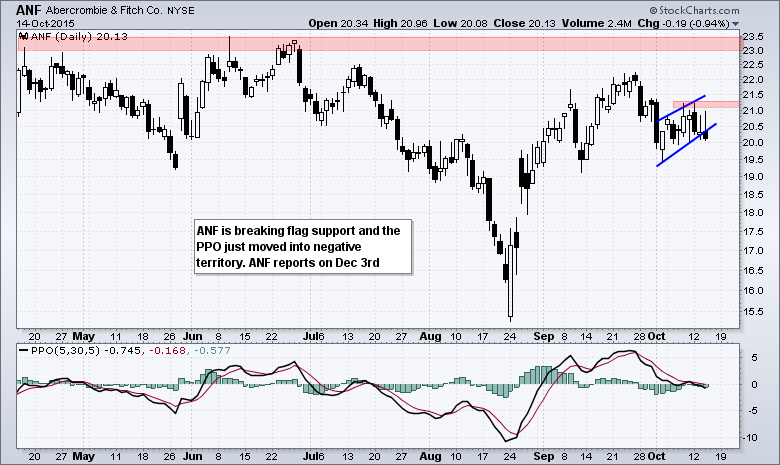
Stocks: AAPL, AEO, AMGN, ANF, GT, MBLY, ORCL

****************************************
Thanks for tuning in and have a good day!
--Arthur Hill CMT
Plan your Trade and Trade your Plan
****************************************


