Internal Divisions Stymie Market
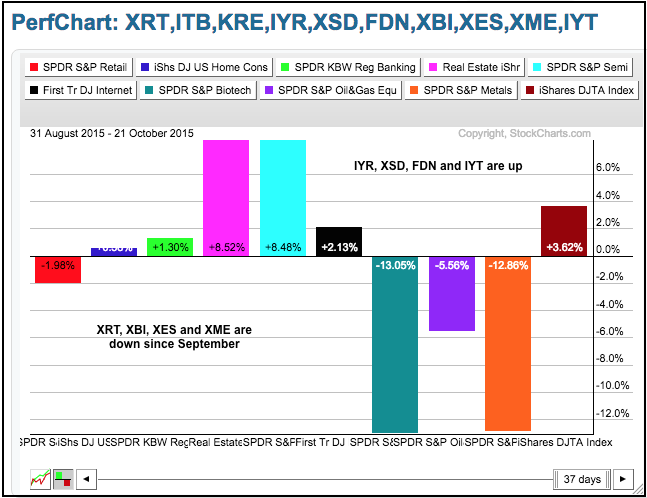
It is still a tale of two markets. Within the broader stock market, large-caps and large-techs are holding up well, but small-caps and mid-caps are dragging their feet. At the sector level, the Consumer Discretionary SPDR shows relative strength because its top holdings are performing well, but the EW Consumer Discretionary shows relative weakness and this suggests that the average stock in the sector is not performing so well. The performance discrepancies have created a push-me-pull-you market that makes it difficult for the broad market indices to gain traction. As an example, the PerfChart below shows the performance for 10 industry group ETFs since August 31st. Notice that six are up for a positive effect on the market, but four are down for a negative effect. The net-net effect is still positive. .
Outside Reversal Patterns Take Shape
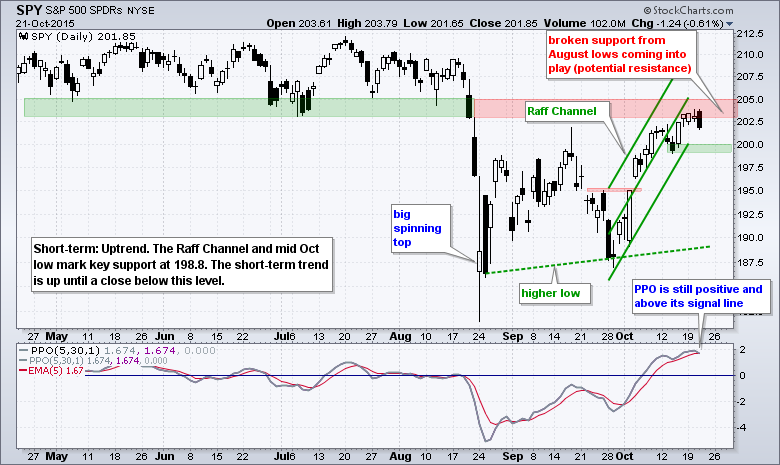
Short-term buying pressure shows signs of diminishing this week with harami patterns on Monday-Tuesday and outside reversals on Wednesday (SPY and QQQ). The harami forms when the candlestick body is within the body of the prior day's candlestick. The body of a candlestick is the open-close range. The inability of the open-close range to exceed the prior open-close range shows indecision, which signals a stalemate between buying pressure and selling pressure.
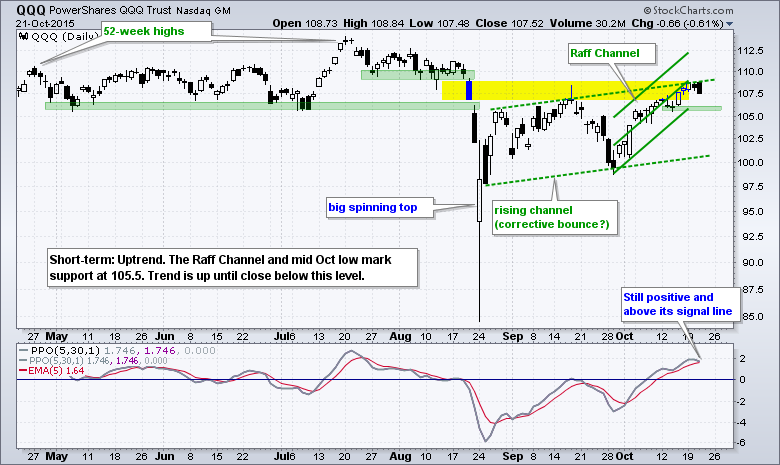
An outside reversal forms when the high is above the prior high and the low is below the prior low. It is a reversal day because SPY and QQQ opened near their highs and closed near their lows. Keep in mind that this is short-term nuance and the short-term trends are still up. The outside reversal, which is akin to a bearish engulfing, has yet to be confirmed with further downside. The Raff Regression Channels and mid October lows mark key support for QQQ and SPY.
IWM Fails at Resistance - Again
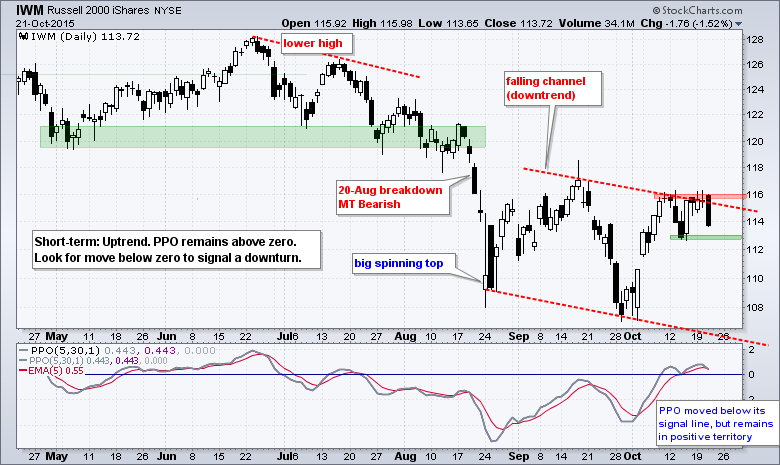
The Russell 2000 iShares (IWM) is having all kinds of problems with 116 as the ETF challenged this level and failed to close above this level at least eight times in the last two weeks. IWM shows relative weakness overall and formed a bearish engulfing with a sharp decline on Wednesday. The PPO also moved below its signal line. The short-term trend is showing signs of bending, but has yet to fully reverse. A PPO move into negative territory and IWM break below 112.6 would fully reverse this upswing. On the flip side, the stock market could accelerate to the upside if IWM breaks above the October highs and starts leading.
%Above 20-day Reflects Mixed Market
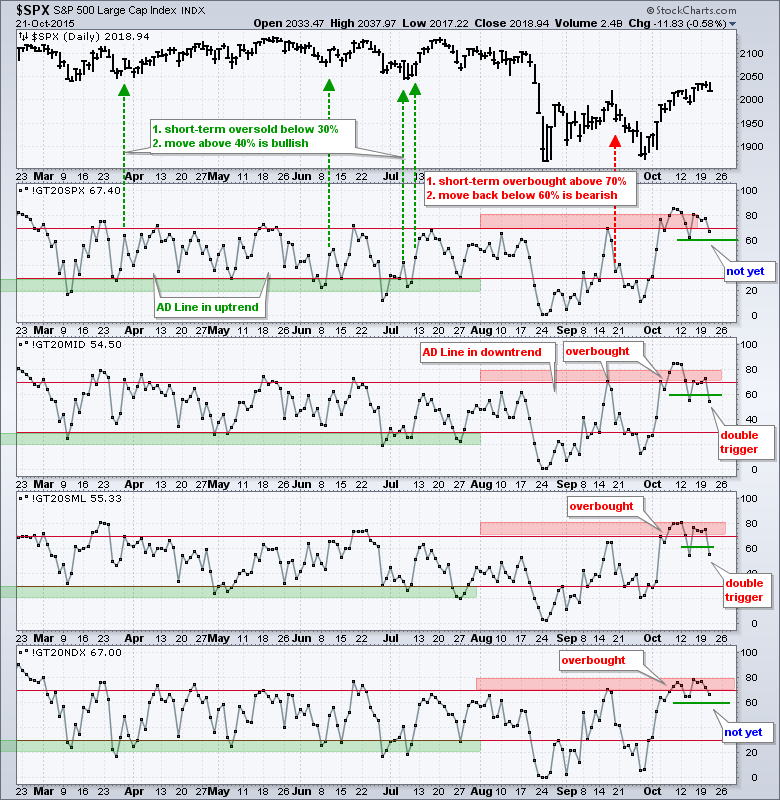
The percentage of stocks above the 20-day EMA tells the split story for the broader stock market quite well. SPY and QQQ are leading, while IWM and MDY are lagging. Notice that the MidCap %Above 20-day EMA (!GT20MID) and Small-Cap %Above 20-day EMA (!GT20SML) triggered bearish signals for the second time in as many weeks when both moved below 60% (after becoming overbought above 70%). Despite the bearish triggers, notice that both remain above 50% and this means more than half of the stock in the index are above their 20-day EMAs. A move below 50% would clearly tilt the balance to the bears. The S&P 500 %Above 20-day EMA (!GT20SPX) and Nasdaq 100 %Above 20-day EMA (!GT20NDX) did not trigger short-term bearish signals last week and have yet to trigger this week. Thus, we do not have short-term bearish signals from the big boys. Bearish signals from these breadth indicators and short-term support breaks in SPY/QQQ would clearly tilt the short-term evidence bearish.
Tech Leads Equal-weight Sectors
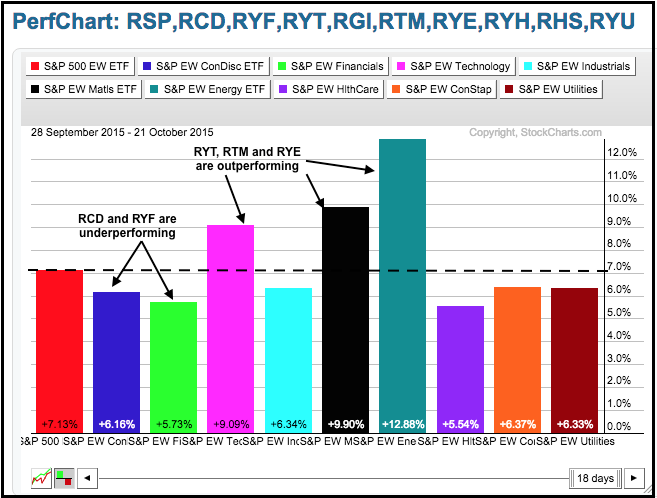
The PerfChart below shows the performance for the nine equal-weight sectors and the Equal-Weight S&P 500 ETF (RSP), which is the benchmark. All nine sectors and RSP are, of course, up since the late September low. The EW Technology ETF (RYT), EW Energy ETF (RYE) and EW Materials ETF (RTM) are up more than RSP (red) and showing relative strength (outperforming). Energy and materials are getting oversold bounces so I am not that impressed. I am, however, impressed with the technology sector. The other six are up less and showing relative weakness (underperforming). Of note, the EW Consumer Discretionary ETF (RCD) and EW Finance ETF (RYF) are underperforming because they are up less than RSP.
ITB Challenges as XRT Fades
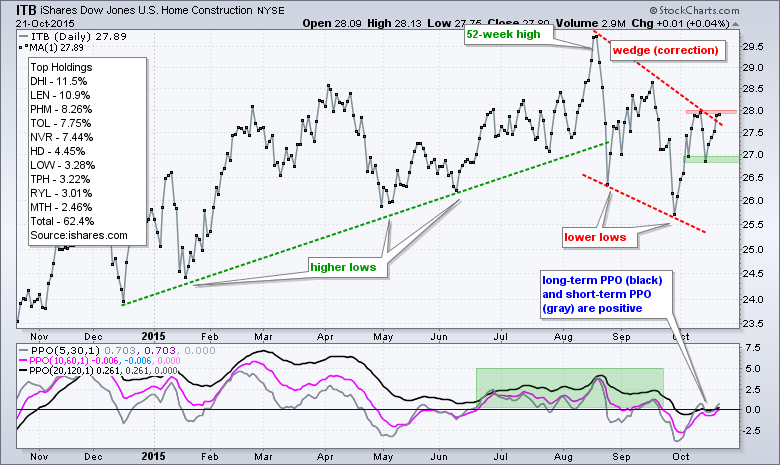
The Home Construction iShares (ITB) remains at its moment-of-truth. The ETF advanced with a series of higher highs and higher lows until late August. ITB then broke the July low and embarked on a series of lower lows and lower highs. The most recent high at 28 is now being challenged and a close above this high would be quite positive. I would then suggest that the falling wedge was a correction and this breakout signals a continuation of the bigger uptrend. Notice that the PPO (20,120,1) is positive and the PPO (5,30,1) just moved above the zero line again.
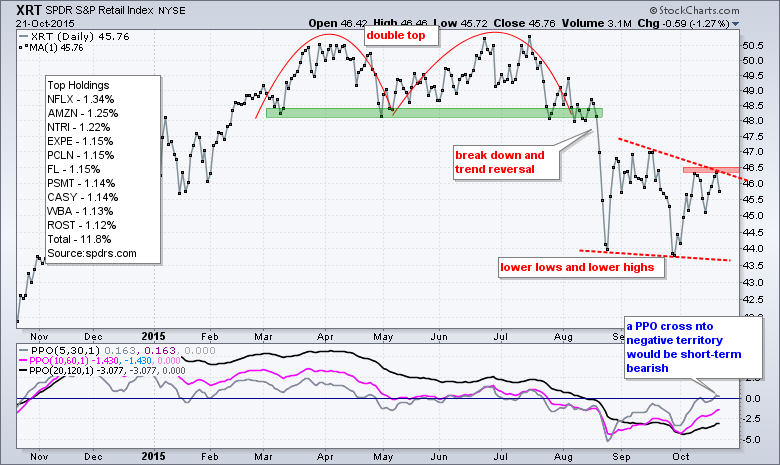
The Retail SPDR (XRT) fell from resistance with a rather sharp decline on Wednesday and 46.5 is the level to beat. The trend is clearly down and this is a negative drag on the market as long as resistance holds. The medium-term PPO (10,60,1) and long-term PPO (20,120,1) are both negative, but the short-term PPO (5,30,1) is barely positive. This is a short-term bearish setup that would trigger if the PPO (5,30,1) moves back into negative territory.
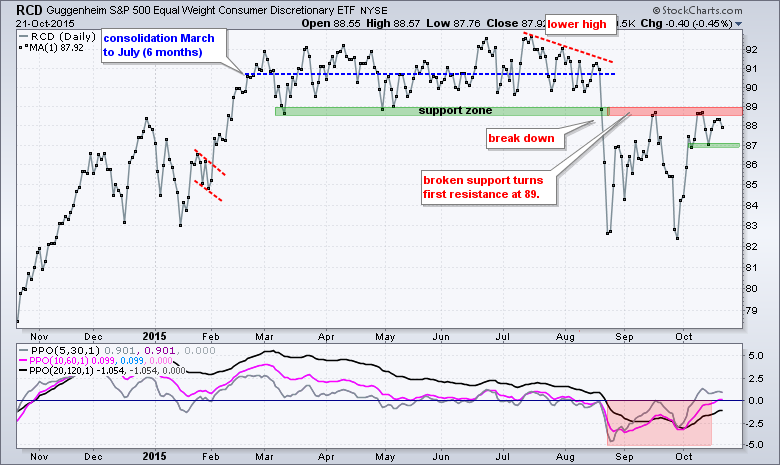
The Equal-Weight Consumer Discretionary ETF (RCD) hangs in the balance. Upside breakouts in XRT and ITB would be very positive for RCD, but this is still hypothetical because neither has yet to breakout and reverse its overall downtrend. RCD is stalling below broken support and above the mid October low. It is like a small consolidation after the Sep-Oct surge. An upside breakout at 89 would be very positive, while a downside break at 86.6 would be short-term bearish.
KRE and KBE Form Rising Wedges
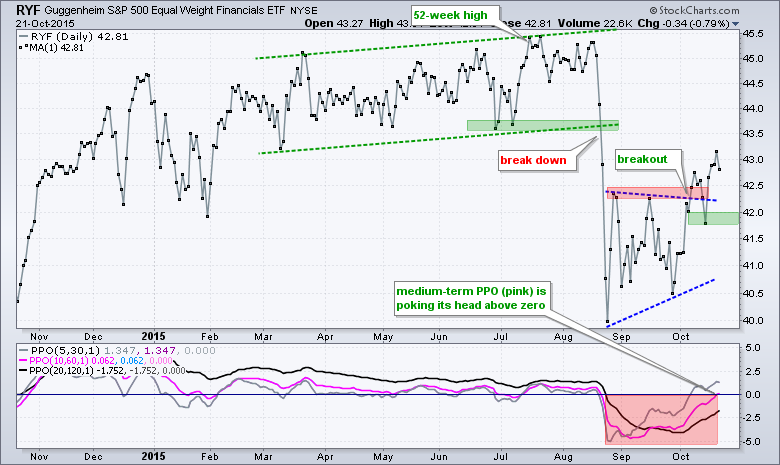
The finance sector is still the second biggest sector in the S&P 500 (16.19) and one to watch for clues on the broader market. Also note that financial services (25.5%) is the single biggest sector in IWM. The first chart shows the Equal-weight Finance ETF (RYF) with a very sharp advance from late September to mid October. The ETF broke out during this surge and this breakout is holding for the most part. Also notice that the PPO (10,60,1) just moved into positive territory. I would remain positive on this sector as long as last week's low holds and the PPO (10,60,1) remains positive.
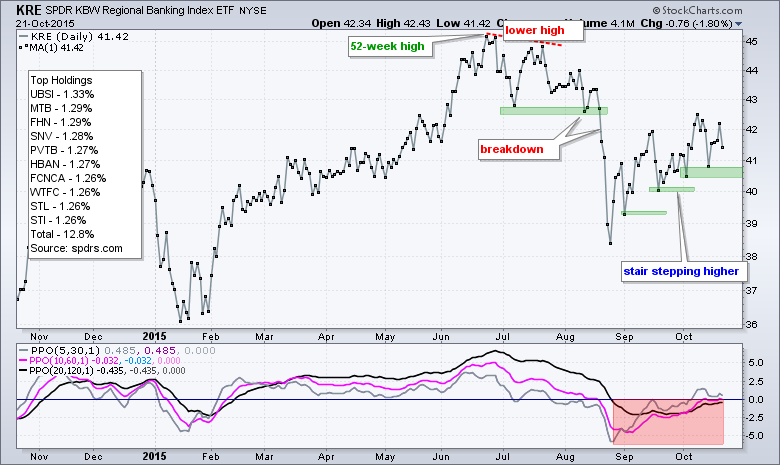
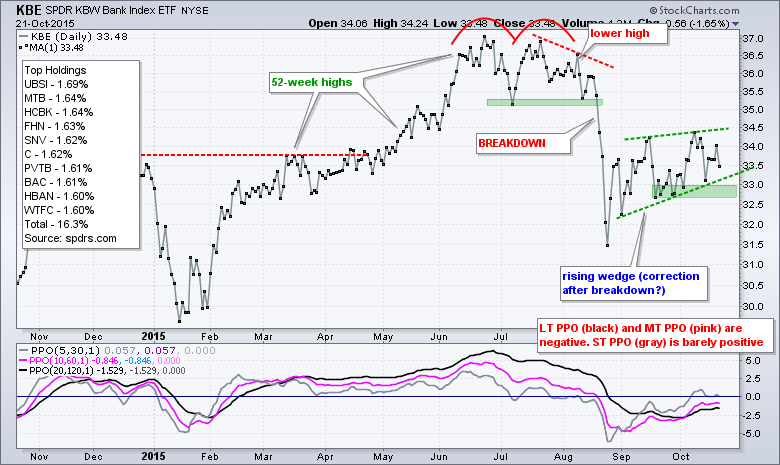
The Bank SPDR (KBE) and the Regional Bank SPDR (KRE) are key to the finance sector, and both are in short-term uptrends. These uptrends, however, look like risings wedges and these patterns are typical for a corrective bounce within a bigger downtrend. Wedge supports hold the key and support breaks in these two would be very negative for the sector.
Bonds Continue to March Higher
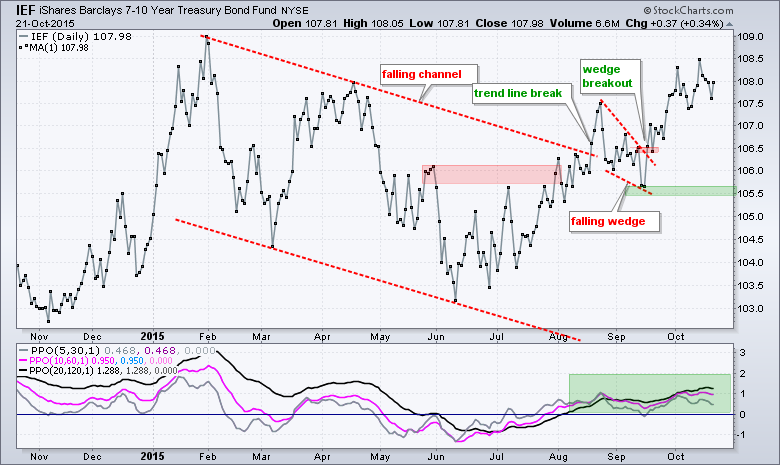
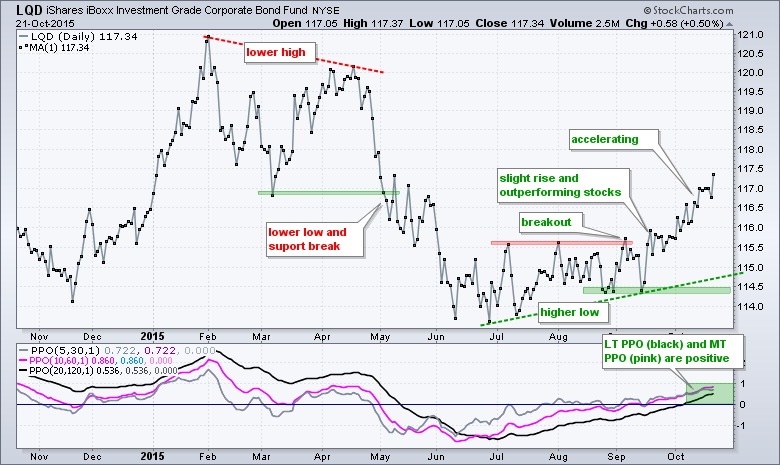
It is not the strongest of uptrends, but the 7-10 YR T-Bond ETF (IEF) continues its advance with higher highs in October. The ETF is now up around 4% from its June low and showing no signs of weakness. This means the 10-YR Treasury Yield ($TNX) is moving lower. I could look for support from the early October low, but prefer not to get too cute and will keep support at 105.5 for now. The medium-term and long-term PPOs have been positive since early August and supportive of an uptrend in IEF. The second chart shows the Investment Grade Bond ETF (LQD) shooting higher this month as the uptrend accelerates.
Stocks are Outperforming Bonds
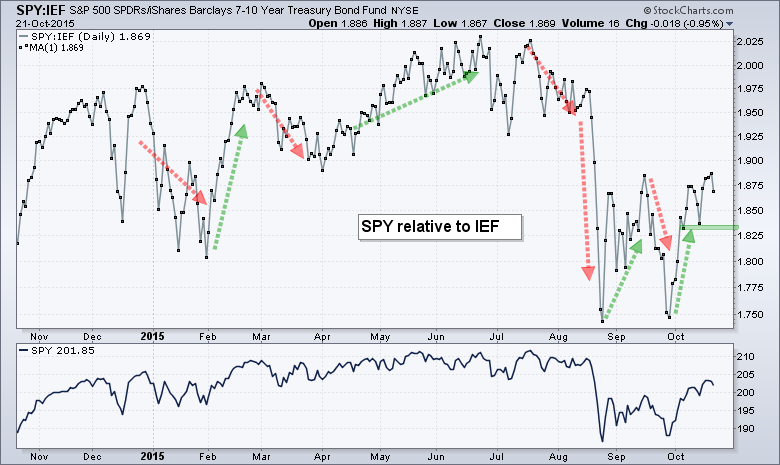
Is strength in bonds negative for stocks? It is certainly possible for stocks and bonds to rise together, and it has happened in the past. In fact, it is happening right now because IEF and SPY are both up since late September. Bond money is viewed as risk-averse money and strength in a risk-averse asset is viewed as negative for stocks, but stocks are outperforming bonds during this period and this favors stocks. I would not consider strength in bonds to be negative for stocks until stocks start underperforming bonds. The chart below shows the SPY:IEF ratio surging from late September to mid October. Watch the early October lows for a break that would suggest relative weakness in stocks.
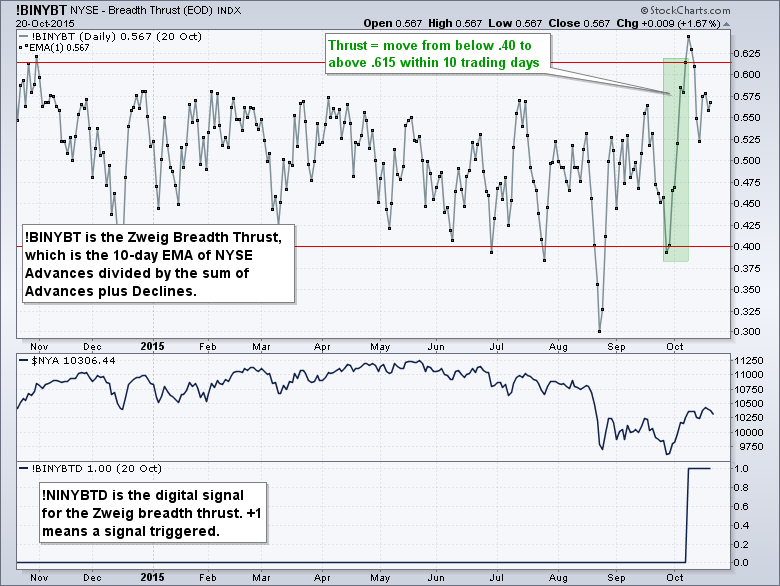
Zweig Breadth Thrust Revisited
I noted the Zweig breadth Thrust last week and again during Tuesday's webinar. I still think this signal remains valid and negates the August breakdowns. At the very least, it shows strong buying pressure that warrants a neutral stance until the dust clears. We also saw a similar signal with NYSE Advancing Volume ($NYAD) and a price surge in the S&P 500 (+8 plus percent in three weeks).
A reader wrote in asking if I had read Tom McClellan's article on this signal and why I did not inform readers about his take. Well, I did read McClellan's article, and I also read Rob Hanna's quantified take on the indicator and Cam Hui's perspective on both articles. McClellan notes that there were 10 great signals, 3 "meh" signals and 12 horrible signals, since 1930. I noted that 10 of these horrible signals occurred from 1930 to 1940. This means we have seen just 2 horrible signals since 1940.
Rob Hanna of Quantifiable Edges takes the indicator a step further by quantifying the signals with performance metrics. Hanna only went back to 1970 and there are only 7 signals listed, but he notes the S&P 500 was higher one month later in all seven occurrences. The message here is that a breadth thrust often results in further gains because buying pressure begets buying pressure. By the way, Quantifiable Edges is a great follow because Hanna puts hard numbers to theories.
****************************************
Thanks for tuning in and have a good day!
--Arthur Hill CMT
Plan your Trade and Trade your Plan
*****************************************


