Even though indicators help us quantify price action and add an objective aspect to our analysis, we must still study the price chart and analyze the price action. For example, it looks like the long-term uptrend is resuming for the S&P 500, but some of the price indicators have yet to confirm with bullish signals. The index formed a big hammer in late September and followed through with a breakout last week. Overall, the index held above the October low and the green trend lines define a rising channel. The upward trajectory of this channel is less steep than the prior advance, but there is still an upward trajectory at work on this price chart. I am marking first support in the 1990-2000 area. A close below 1990 would call for a re-evaluation.
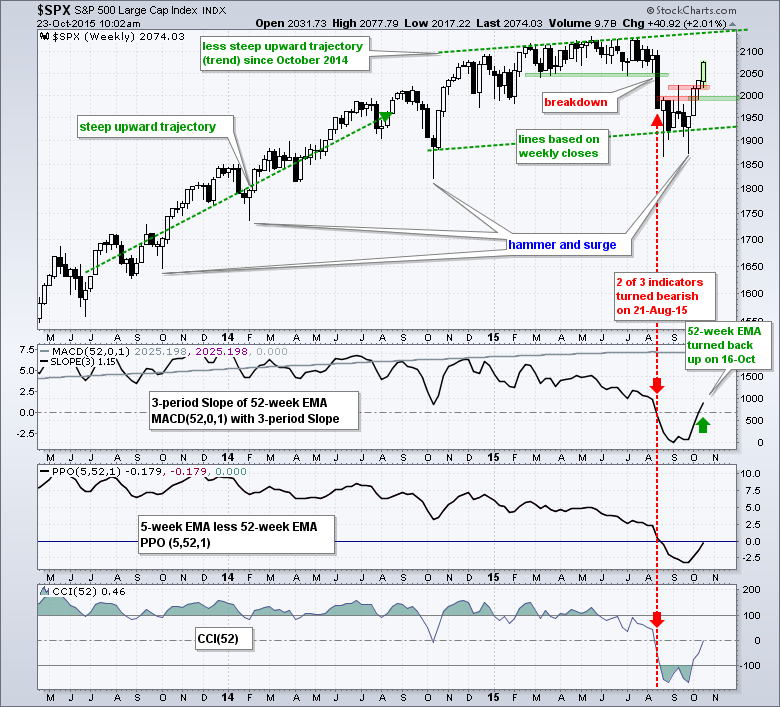
As the S&P 500 now stands, the price chart is bullish and the slope of the 52-week EMA is bullish. In contrast, the PPO(5,52,1) and CCI(52) have yet to turn positive (more on the CCI switch below). This is probably because the S&P 500 has yet to exceed its August high and completely negate the August breakdown. Nevertheless, I think the bulk of the long-term evidence is bullish for large-caps right now. This evidence includes the Zweig breadth thrust, the thrust in Advancing Volume, the hammer-surge in the S&P 500, the higher low (Oct-Aug) and the breakout over the last two weeks. Stocks are getting short-term overbought right now, but that is not necessarily bearish because overbought conditions are more likely in uptrends than downtrends.
I have been using an indicator trio to define the long-term uptrend in the stock market. As detailed last Friday, this trio includes the slope of the 52-week EMA, the PPO(5,52,1) and 52-week Price Channels. I am opting to replace the Price Channels with the 52-week Commodity Channel Index (CCI) because it better reflects long-term momentum and price direction. The 52-week Price Channels reflect a price milestone of sorts and this indicator lags the other two.
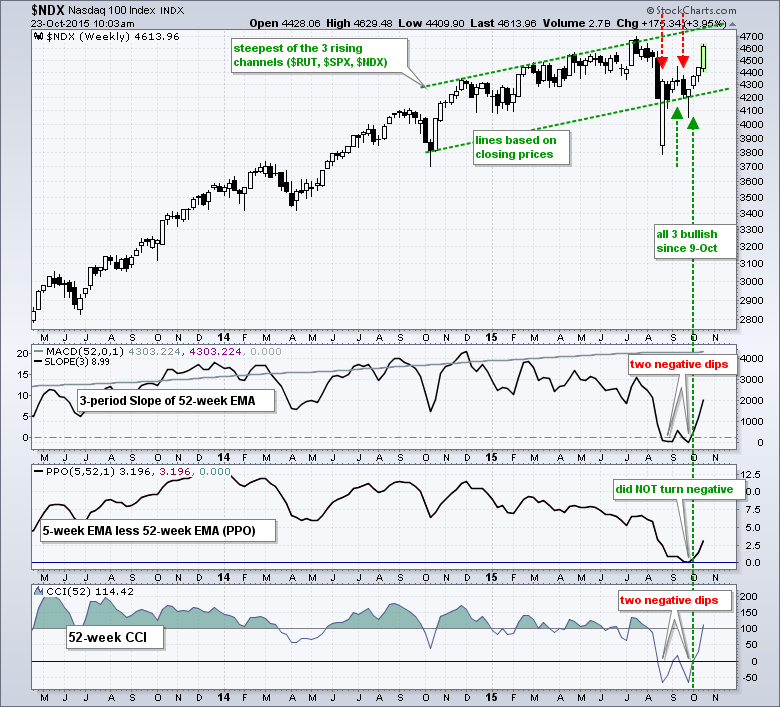
Nasdaq 100 Leads the Charge
After a whipsaw in September, the Nasdaq 100 turned bullish again on October 9th and was the first of the three to turn bullish again. The index was showing relative strength with the first upturn so this week's big surge should not be a complete surprise. The rising channel in $NDX is the steepest of the three and this means it has the strongest uptrend (rate of ascent). The index formed a hammer in late September and followed through with a gap-surge the very next week. The indicators followed suit when all three turned positive again on October 9th.
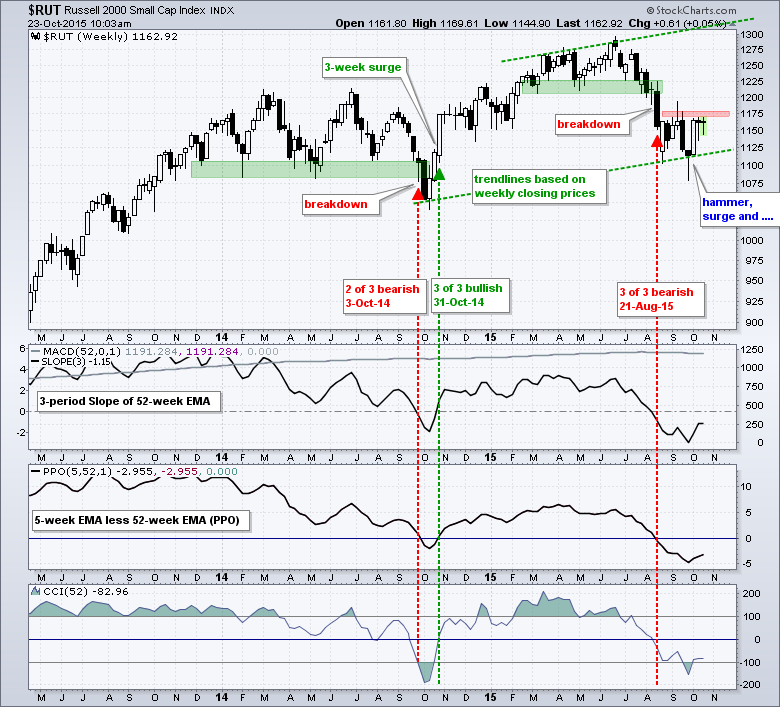
Russell 2000 Lags without a Breakout
The Russell 2000 remains in a downtrend overall and we have yet to see a follow-through breakout. Relative weakness in small-caps is generating some concern, but keep in mind that the Russell 2000 accounts for less than 10% of the total US stock market. Small-caps are still the tail and large-caps remain the dog, and the big dog at that. In any case, now is not the time for small-caps to lead anyway (more on that below). Returning to the chart, the Russell 2000 is still firming in the 1100-1175 area and all three indicators are negative. A weekly close above 1180 is needed for a follow through breakout and the first sign that small-caps are catching a bid.
Seasonality Getting More Bullish
Before looking at some seasonal patterns coming up, let me clarify that PRICE ACTION is still the most important aspect of my analysis. Price action, which refers to the actual price chart and the underlying trend, supersedes momentum indicators, relative performance, volume, credit indicators, volume indicators, sentiment and seasonal patterns. Seasonal patterns, for example, tell us the historical tendencies and give us an idea of what to expect going forward. These expectations, however, must be confirmed with price action and the price chart. Truth be told, price action is really the only thing we need.
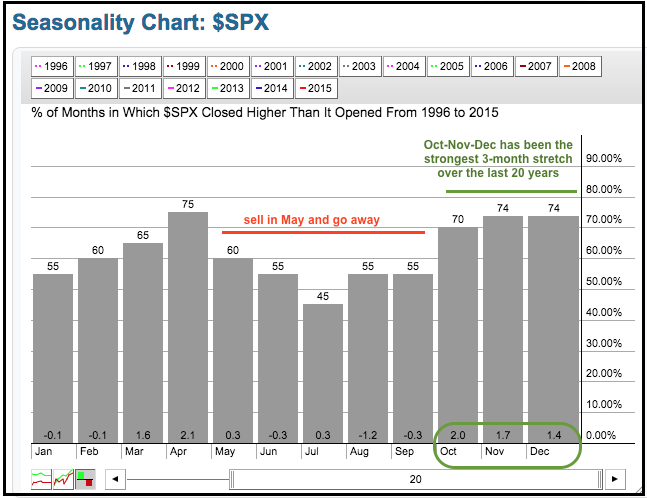
The seasonal patterns for the S&P 500 and the Russell 2000 are set to improve in November and December. Actually, the 20-year seasonal pattern for October is also pretty darn good. Notice that the S&P 500 has been up 70% of the time in October and the average gain is 2%. The index is up around 8% so far this month and set to blow away the average. Even though the market seems short-term overbought, the trend is up and the seasonal patterns remain bullish heading into November and December.
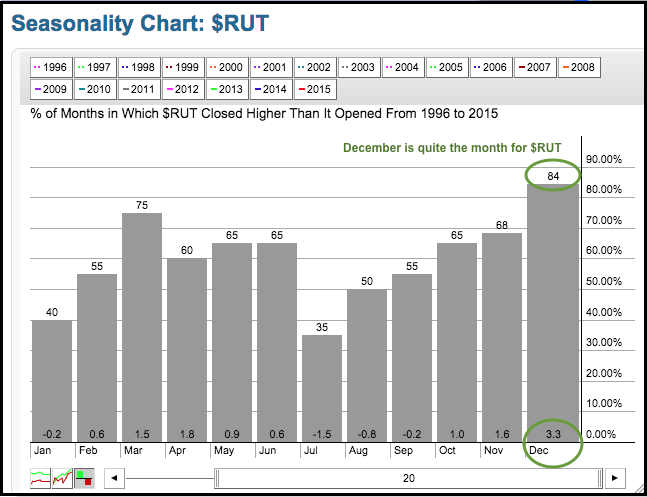
This bullish seasonal pattern also fits with the six month cycle, which runs bullish from November to December and bearish from May to October. However, as you can see from the last 20 years, we appear to have a bearish five-month period (May to September) and a bullish seven-month period (October to April). Of note, the Russell 2000 has risen 84% of the time in December.
Relative Weakness in Small-caps is Normal
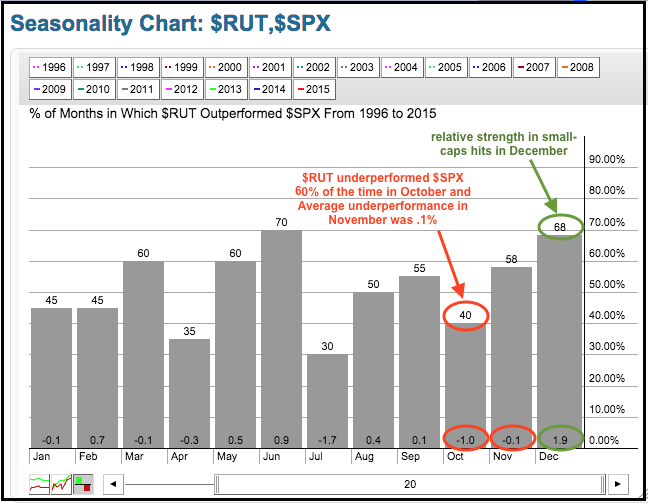
Small-caps are lagging right now, but the seasonal patterns suggest that this is normal for October-November and small-caps could play catch-up as we head into yearend. The next chart shows the seasonal patterns for the Russell 2000 relative to the S&P 500 (small-caps versus large-caps). Notice that the Russell 2000 outperformed the S&P 500 just 40% of the time in October, which means it underperformed 60% of the time. Even though the Russell 2000 outperformed 58% of the time in November, the average over-under performance was an under-performance of .1%, which is not very encouraging. Historically, small-caps do not really get into gear until December. Notice that the Russell 2000 outperformed the S&P 500 68% of the time in December and the average outperformance was 1.9%, which was the highest of the 12 months. Some chartists may have already figured it out, but the tendency for small-caps to outperform in December is known as the January effect. Check out the Stock Trader's Almanac for more on seasonal patterns.
Weekend Reading
Here are some interesting reads I came across recently:
- Jeff Hirsch of the Stock Trader's Almanac, notes that small-caps lag large-caps until the end of November and start outperforming in December.
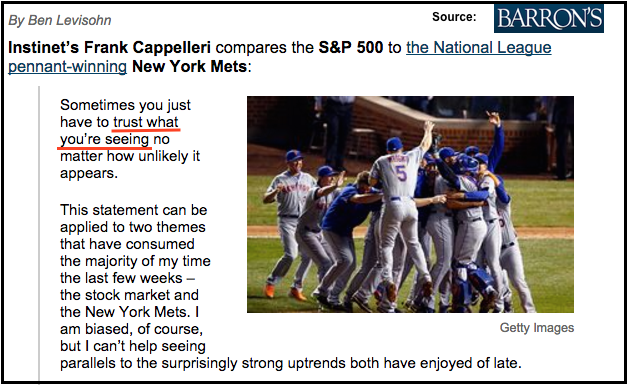
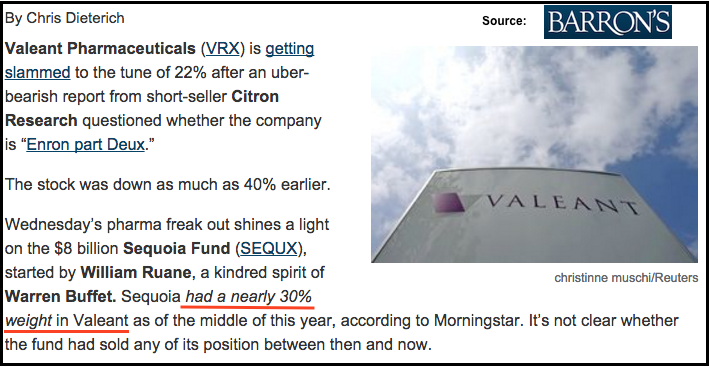
- There was a great quote from Frank Cappelleri of Instinet in Barrons.
My Take: Price is really the only thing that matters. Relative weakness in small-caps, a surging Dollar, chaos in China and weak commodity prices are secondary to price action.
- JC Parets of All Star Chart has a great overview of Stocktoberfest. In particular, his notes on trading psychology from Dr Brett are worth printing out and keeping to regular review.
- Numbers cruncher Ryan Detrick notes that a strong October bodes well for a strong yearend.
My take: This also jibes with the breadth thrust, the volume thrust, the price surge, the seasonal patterns for November-December and the six month cycle, which turns bullish on November 1st.
- Michael Batnick has a timeline featuring some of the greatest investment books ever written. The chart, from StockCharts.com of course, stretches from the 1920s to 2015 and lists over two dozen books.
- Former turtle trader Jerry Parker noted a bad example of portfolio construction on his twitter feed (@rjparkerjr09). Having 30% of your portfolio in one stock exposes the portfolio to excessive risk and this is not part of the trend-following philosophy.
- Ben Carson, A Wealth of Common Sense, wrote a very insightful article on Goals-Based Investing. The money quote is: "Without a deep understanding of your goals from the start there’s no way to judge your investments going forward."
- Bloomberg Technology notes that The Cloud is Raining Cash on Amazon, Google, and Microsoft.
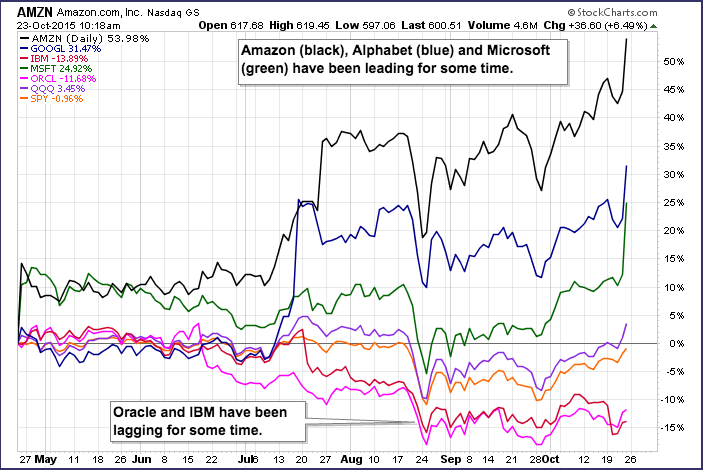
My take: It is going to a long winter for Oracle and IBM.
****************************************
Thanks for tuning in and have a good day!
--Arthur Hill CMT
Plan your Trade and Trade your Plan
*****************************************


