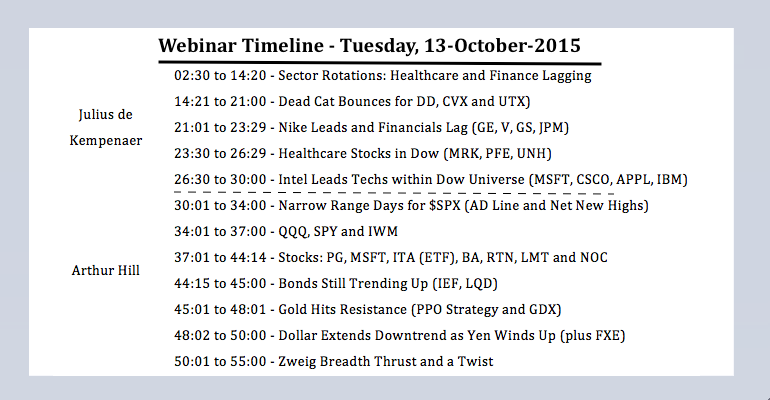
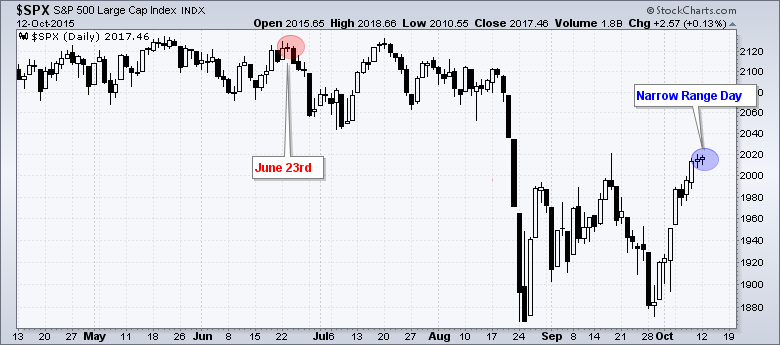
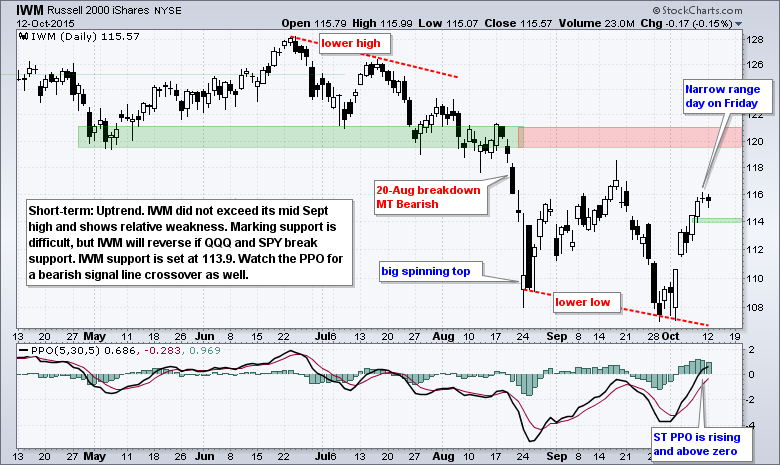
Stymied Indexes Form Narrow Range Days
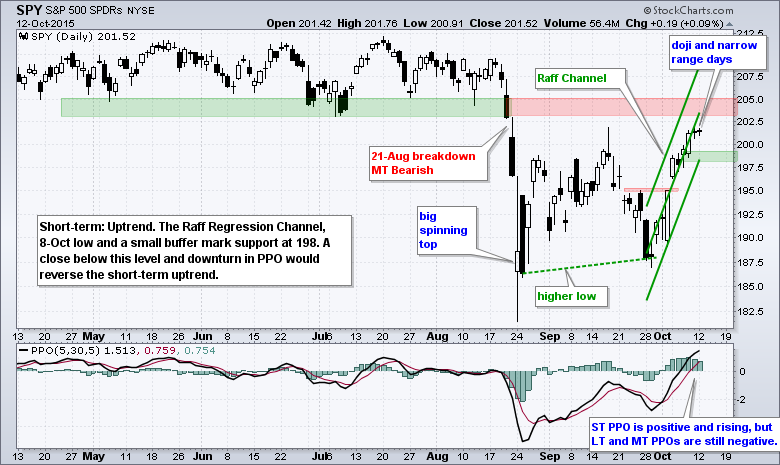
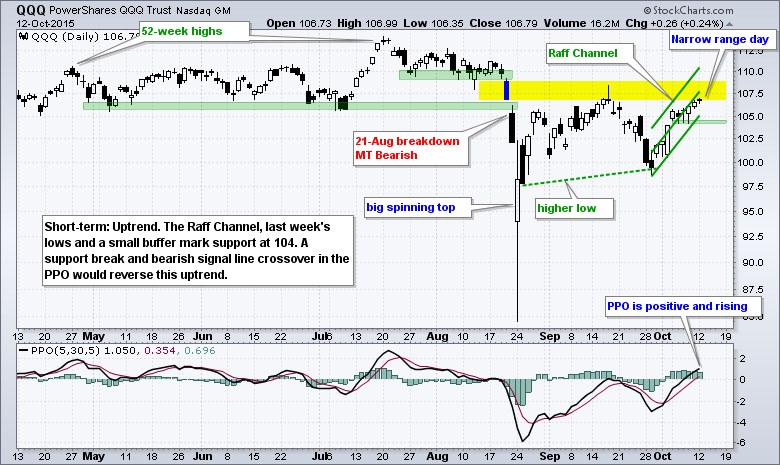
Stocks stalled on Monday with mixed action in the major index ETFs. Stalling or sideways price action reflects a stand-off between bulls and bears (buying pressure and selling pressure). Note that the price range over the last two trading days has also been extremely narrow. In fact, Monday's high-low range for the S&P 500 was the smallest since June 23rd. Monday's range for the Nasdaq 100 was the smallest since August 18th and Friday's range for the Russell 2000 was the smallest since July 16th. Also notice that the S&P 500 SPDR (SPY) formed doji candlesticks over the last two days. Thus, we have two doji and two narrow range days in SPY. This shows some serious indecision and such indecision can foreshadow a short-term reversal. A weak open and long black candlestick on this turnaround Tuesday would provide the first sign of a short-term trend reversal.
SPY and QQQ Hold their Gaps
There is no real change for the major index ETFs. SPY and QQQ are in steep short-term uptrends over the last two weeks and I am using Raff Regression Channels to define these uptrends. I still view these uptrends as counter-trend moves within a bigger downtrend. QQQ hasn't moved much since the gap up on October 5th and this is the first level to watch for the tech-laden ETF. Overall, support breaks and downturns in the PPO (5,30,5) would signal that the short-term uptrends are reversing and the bigger downtrends are continuing.
Gold Challenges Resistance
The Gold SPDR (GLD) is making a bid to break resistance with a surge to 112 this month. Notice that broken support turned into resistance and held in August. A close above the August high and a centerline crossover in the PPO (20,120,1) would suggest that an uptrend is starting.
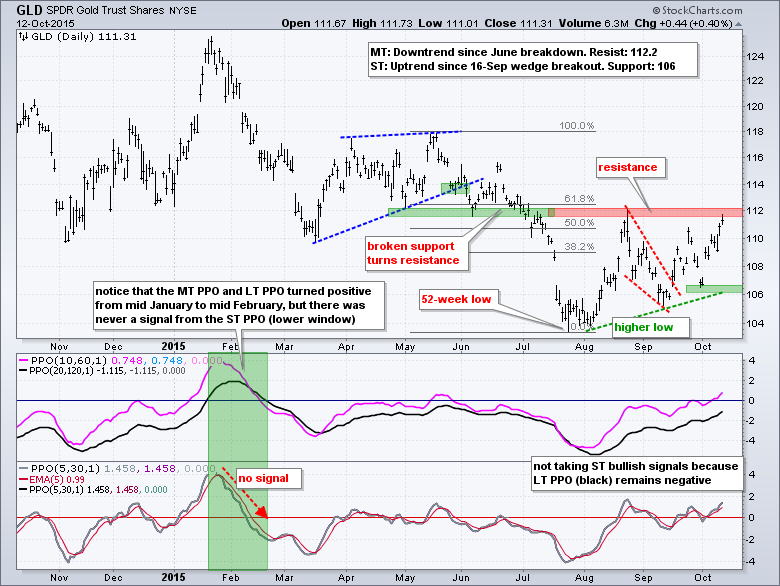
This GLD chart provides a good example of the trend filter and short-term PPO signals. I use the PPO (10,60,1) and PPO (20,120,1) to define the bigger trend on daily charts. This trend is clearly up when both are positive and clearly down when both are negative. PPO (10,60,1) turned positive for the Gold SPDR, but PPO (20,120,1) remains negative. This means I still favor short-term bearish signals over short-term bullish signals.
Notice that both PPOs turned positive from mid January to mid February and this turned the trend filter bullish. Despite this bullish trend filter, the PPO (5,30,5) never triggered a bullish signal during this period. A short-term bullish signal triggers when PPO (5,30,5) moves from negative territory to positive territory or moves above its signal line. These short-term bullish signals require a bullish trend filter first though. As the chart now stands, it will likely be some time before GLD triggers a short-term bullish signal because we need a bullish trend filter and then a bullish setup from the PPO (5,30,5).
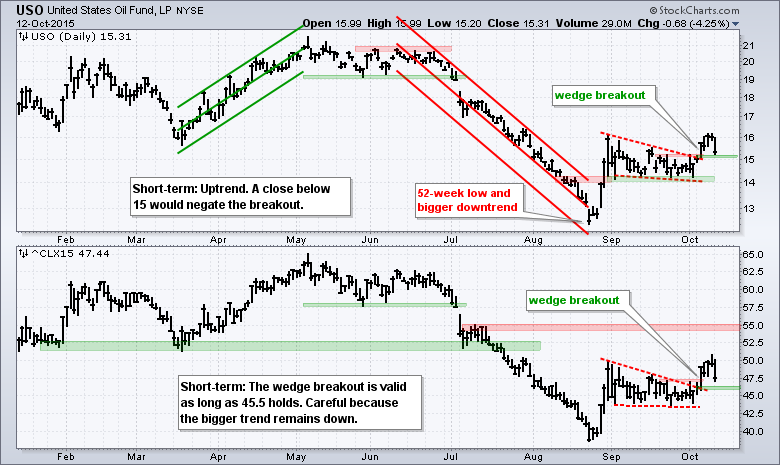
Oil Bulls Get Cold Feet
Oil is already getting cold feet after its wedge breakout with a sharp decline on Monday. Keep in mind that the bigger trend is down and this is a strong headwind for the bulls. The bears still have the tailwind here. As far as the wedge breakout is concerned, a strong breakout should hold and a move below 45.5 in November Crude (^CLX15) would negate the breakout.
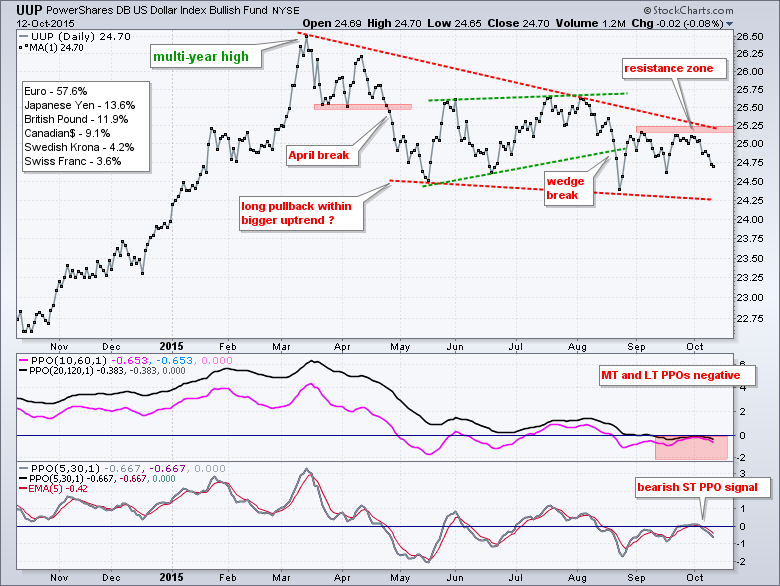
Dollar Continues to Weaken
The US Dollar ETF (UUP) has been trending lower since March and trend PPOs turned negative in mid September. Even though the big red wedge could be a correction after the big surge in 2014, a six month downtrend is long term enough for me. Wedge resistance is set at 25.25. Notice that the PPO (5,30,5) triggered a bearish signal last week when it moved below its signal line and into negative territory. This is the first bearish signal since the bigger trend filter turned bearish.
Zweig Breadth Thrust
There has been a lot of chatter regarding the Zweig Breadth Thrust over the last few days and it is very easy to plot at StockCharts. First and foremost, I used to watch Marty Zweig on Wall Street Week, I subscribed to The Zweig Forecast for a while and I have read his book, Winning on Wall Street. Zweig was a big influence on me as a technical analyst and I learned a lot from him. Liz Ann Sonders of Charles Schwab wrote a great piece after he passed away and shared what she learned from Marty. Her thoughts echo mine and I highly recommend reading it (here).
So what is the Zweig Breadth Thrust anyway? Our very own Greg Morris wrote a blog post on this very indicator in January 2015. This post comes from Chapter 5 of his book, Market Breadth Indicators, and includes details on several other breadth indicators. According to Morris, the indicator is based on the 10-day EMA of NYSE Advances divided by the sum of NYSE Advances plus NYSE Declines (A/(A+D). A breadth thrust occurs when the indicators moves from below .40 to above .615 within ten trading days. A similar move outside the ten trading day requirement does not count as a breadth thrust.
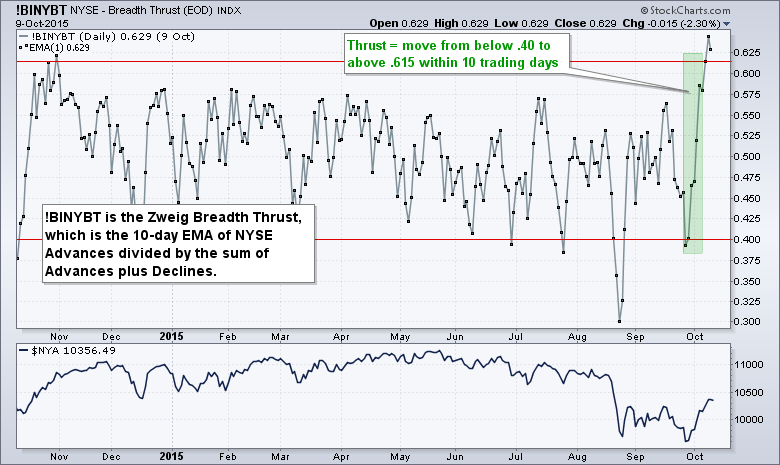
As you can see from the chart above, a bullish breadth thrust triggered last week as the indicator moved from below .40 on September 28th and exceeded .615 on October 8th (eight days later). At the very least, this shows strong buying pressure off the late September low. Zweig theorized that strong buying pressure begets more buying pressure It is like a rocket ship blasting off. Stocks need a big initial thrust to get off the ground and stay off the ground. Personally, I am not turning long-term bullish just yet and will watch to see how the trend indicators evolve over the next two weeks. I will have more on this indicator in today's webinar and show a various using S&P 1500 AD Percent ($SUPADP).
****************************************
Thanks for tuning in and have a good day!
--Arthur Hill CMT
Plan your Trade and Trade your Plan
****************************************


