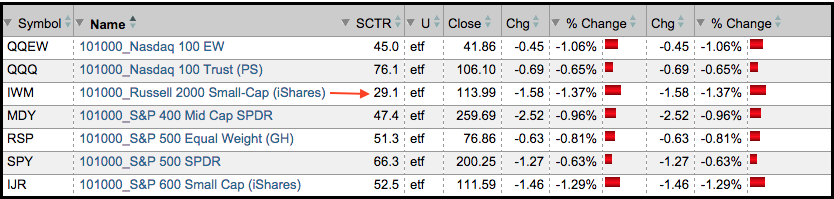
Small-caps Show Relative Weakness
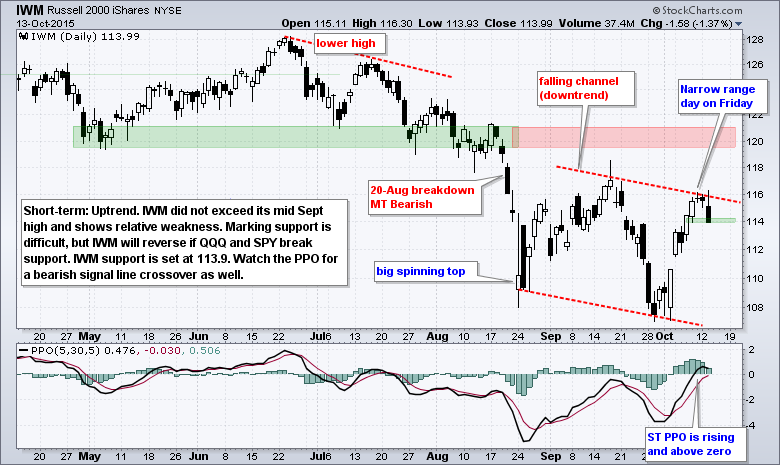
After stalling for two days, the major index ETFs moved lower on Tuesday with the Russell 2000 iShares (IWM) leading the way. Small-caps were lagging in September and they continue to lag in October. While SPY and QQQ managed to exceed their mid September highs, IWM did not and shows chart weakness. SPY and QQQ were down around .65% on Tuesday, but IWM was down 1.37% and the S&P SmallCap iShares (IJR) was down 1.29%. As the table below shows, IWM has the lowest StockCharts Technical Rank (SCTR) of the seven major index ETFs shown. This means it is technically the weakest and shows relative weakness.
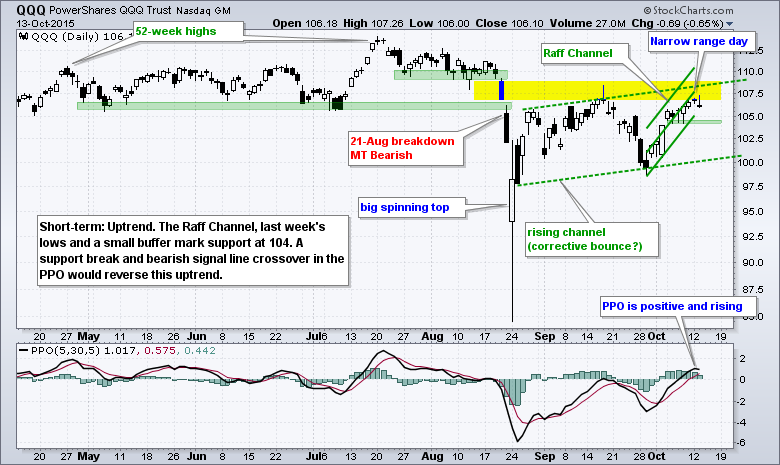
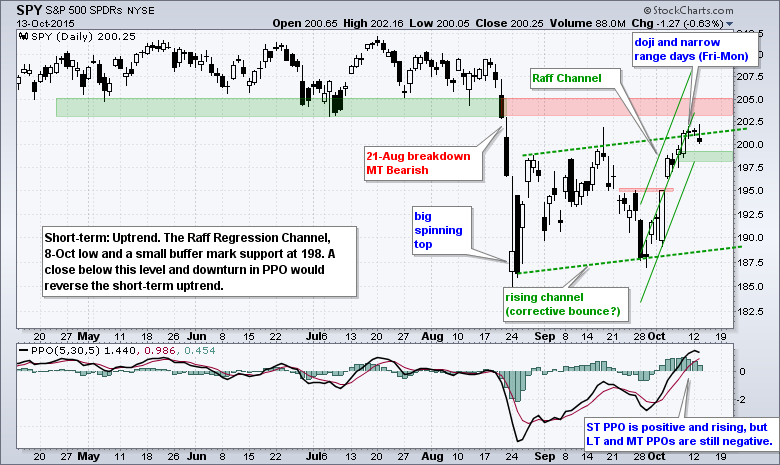
The Swing within the Channel
ABC, Wave 2 Corrections and Short S&P 500
I do not do much Elliott wave, but it was required study for the Chartered Market Technician exam and there was a big essay question using the methodology. Personally, Elliott Wave is just too subjective for my taste. As with many analytical processes and technical analysis books, I usually get a few takeaways that I can apply without embracing the entire methodology. In this case, one of my takeaways from Elliott was the ABC correction and the Wave 2 decline. After a bottom and Wave 1 advance, there is often a rather deep pullback or counter-trend move. Because a new up trend is still in its early stages, this pullback often forges a lower low and traps some of the bears with the depth of the move. This is the C leg of the ABC decline, which has three legs. The chart below shows the ProShares Short S&P 500 ETF (SH) with an ABC decline that could be a Wave 2 pullback. The pullback is deep enough to shake out long positions, but prices are remaining above the low of Wave 1. You can apply the inverse logic to SPY and QQQ.
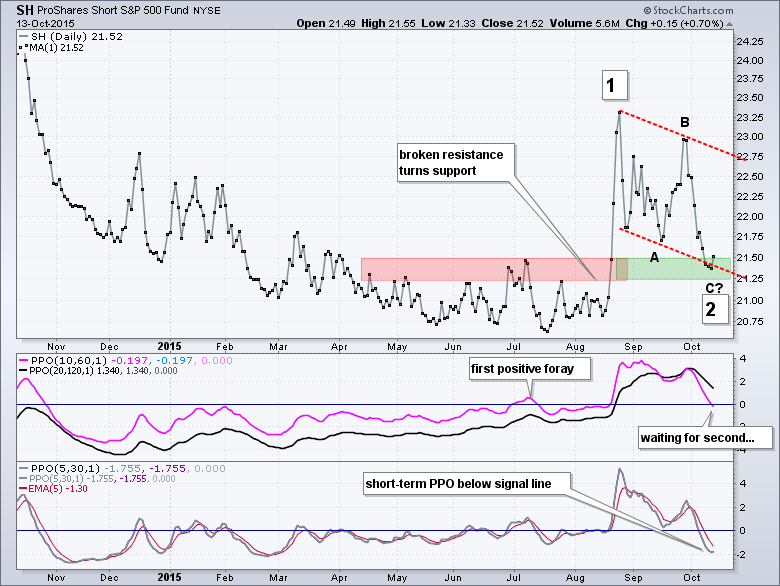
At this point, the trend is down until SH moves above the high of Wave B (higher high). However, waiting for such a breakout would totally ruin the reward-to-risk ratio for a trade. Also keep in mind that it is hard to make money on the downside in the stock market. In any case, I am seeing support in the 21.25 area from broken resistance. The PPO (20,120,1) is positive and this suggests a bigger uptrend. The PPO (10,60,1) just moved into negative territory because this pullback was so deep. A second move into positive territory would signal a renewed uptrend. Short-term, the PPO (5,30,5) remains below its signal line and needs a bullish crossover to signal an upturn in momentum. A bullish setup is present for SH right now and it would take a close below 21.25 to negate this setup.
Update on Short-term Breadth
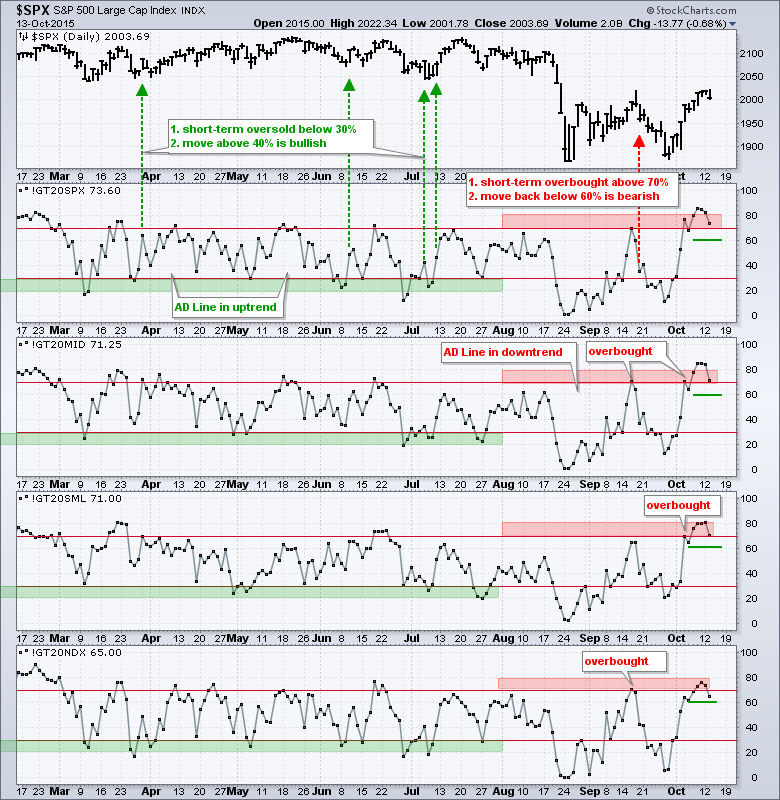
I have also been following the percentage of stocks above the 20-day EMA for a bearish signal. As with all signals, we have to make an assumption at some point. My assumption, or rather educated guess, is that the bigger trend turned down in August and remains down. This means I am further assuming that the current bounce is counter trend and will fail at some point. The percentage of stocks above the 20-day EMA becomes overbought with a move above 70%. This means the market has experienced a bounce. Even though it is considered a counter-trend bounce, the indicator remains short-term bullish until it moves back below 60%. This signals that over 40% of the stocks within the indexes have turned down and broken below their 20-day EMAs. As the chart now stands, the indicator became overbought for the four major indexes and remains above 60%. There was a downturn on Tuesday and a little more weakness is required to break below 60%.

****************************************
Thanks for tuning in and have a good day!
--Arthur Hill CMT
Plan your Trade and Trade your Plan
****************************************


