Welcome to No Man's Land
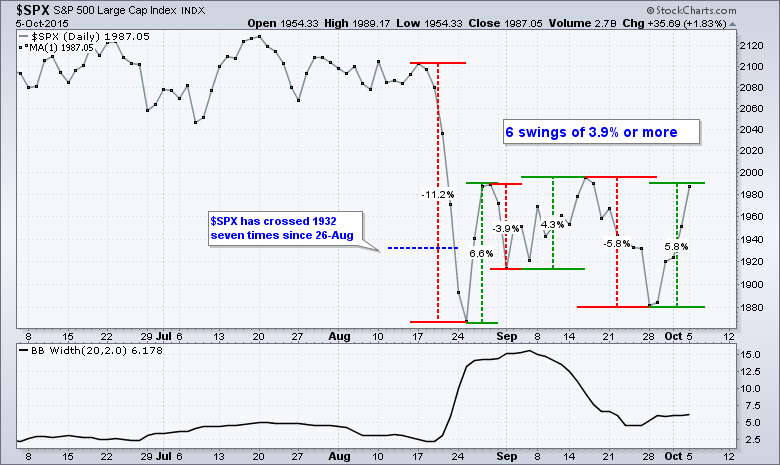
After months of dull trading, the stock market turned into Thrillsville in late August and volatility has continued into early October. This volatility is reminiscent of the periods from June to August 2010 and from early August to early October 2011. It took three months to bottom in 2010 and two months in 2011. The current range is a little over a month old and the trend indicators are still pointing down. Note that I will review the 2010 and 2011 bottoms in Friday's edition of Art's Charts, and apply the lessons to the current charts. On the chart below, it looks like 2000 could be quite the battle zone for the S&P 500.
IWM Challenges Breakdown
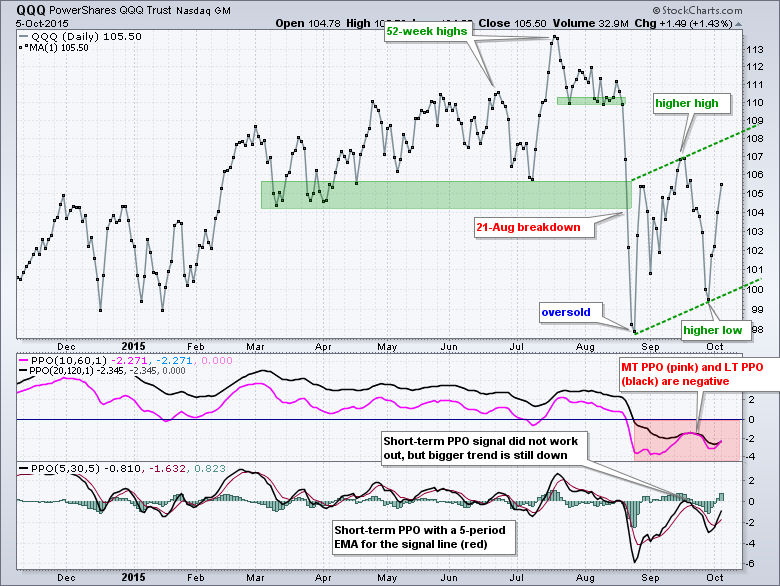
As usual, I will start with the big three for clues on the broader market. All three charts are close-only charts to filter out some of the recent volatility, especially the spike low on August 24th. All three charts feature the PPO (20,120,1) for the long-term (LT) trend, the PPO (10,60,1) for the medium-term (MT) trend and the PPO (5,30,5) for short-term signals within the trend. Note that the long-term and medium-term PPOs turned negative in late August and all three ETFs broke key support levels. This means the bigger trend is down. This also means the short-term PPO is only used to generate bearish signals. I will ignore most bullish signals because the bigger downtrend holds the most sway
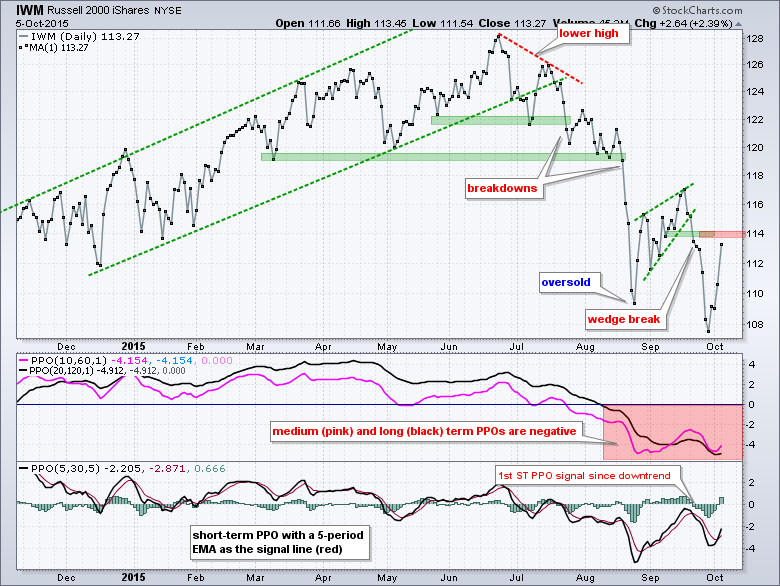
The first bearish signals triggered after an oversold bounce when the PPO (5,30,5) moved below its signal line on September 22nd. These signals were looking good at the end of September, but the October surge pushed SPY and QQQ above their breakdown points. IWM remains below its breakdown point and a test is looming. Despite the big four day surge, the bigger trends are down and this means I am simply waiting for the next bearish setup. SPY and QQQ are in no man's land because they negated their bearish signals. IWM is on the verge of entering no man's land with a close above 114.
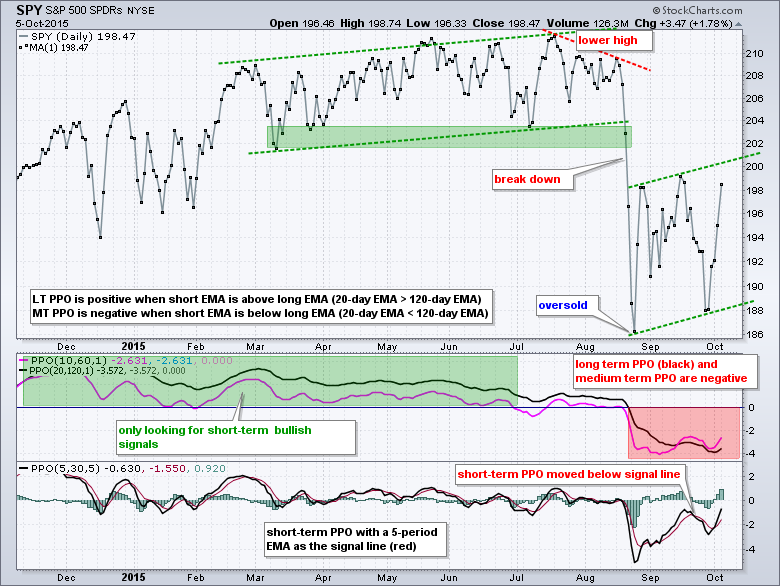
SPY and QQQ formed higher lows from late August to late September and surged towards their mid September highs. A close above the mid September closing higher would be quite positive, but I would also wait for confirmation with the PPO (20,120,1) and PPO (10,60,1). Both need to cross back into positive territory to revive the bigger uptrend. Once this happens, I will then turn to PPO (5,30,5) for bullish setups.
Utilities and Staples Lead EW Sectors
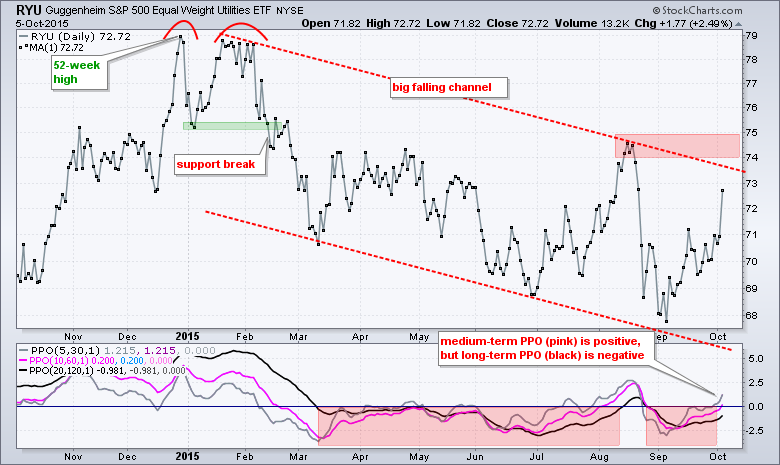
Before looking at the equal-weight sector charts, note that the PPO (20,120,1) is negative for all nine sector SPDRs and all nine equal-weight sector ETFs. The PPO (10,60,1) is negative for eight of the nine. Only the Utilities SPDR (XLU) and the Equal-weight Utilities ETF (RYU) have positive medium-term PPOs (10,60,1). This tells up two things. First, all sectors are in long-term downtrends because the 20-day EMA is below the 120-day EMA. Second, utilities show relative strength as the only sector with a positive medium-term PPO. Despite the big move in RYU, I still think the bigger trend is down because of the lower low in early September and the falling channel since January.
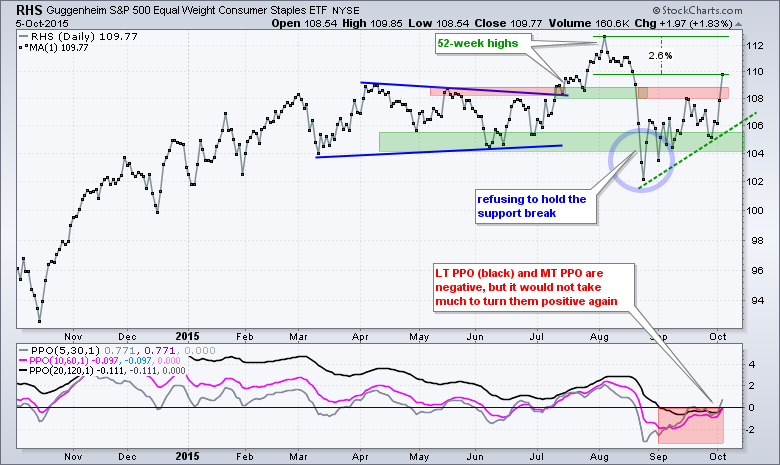
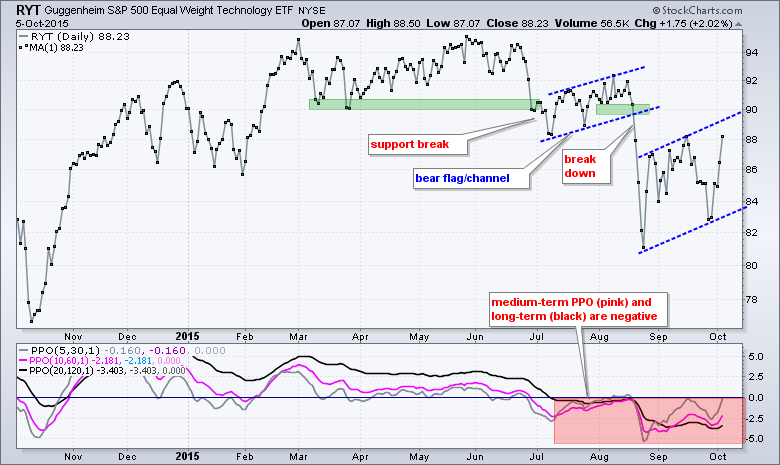
Even though the PPOs are negative for the Consumer Staples SPDR (XLP) and Equal-weight Consumer Staples ETF (RHS), I think this is the strongest sector overall because it is the closest to a 52-week high. Note that RHS is less than 3% from its 52-week high. At this point, utilities and consumer staples are two of the strongest sectors since late August because they closed above their mid September closing high. The Equal-weight Technology ETF (RYT) is the only other sector to close above this benchmark high.
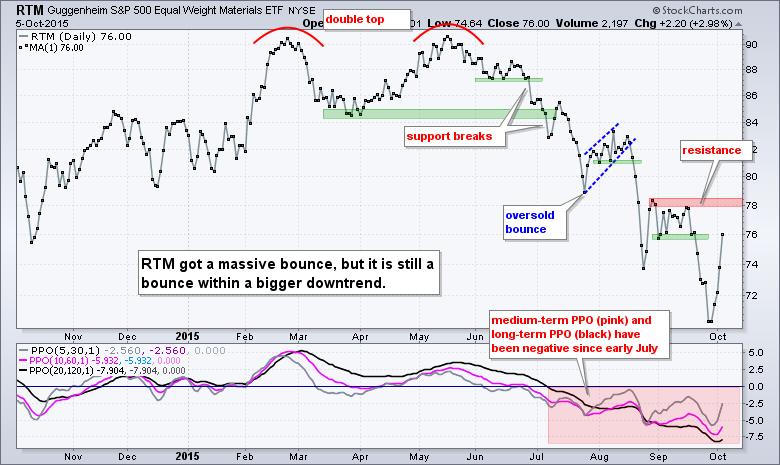
On the price chart below, the Equal-weight Technology ETF formed a higher low and higher high since late August, but this is still not enough because the overall trend remains down. Notice that the long-term and medium-term PPOs are still very negative.
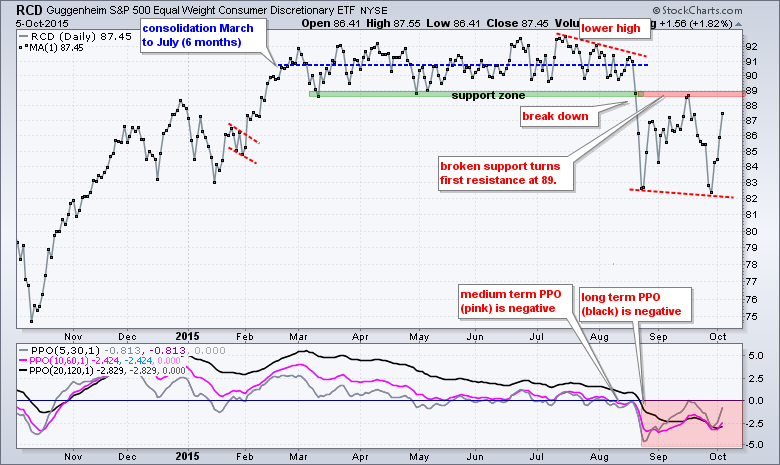
In contrast to RHS, the Equal-Weight Consumer Discretionary ETF (RCD) remains below its August support break and has yet to exceed its mid September high.
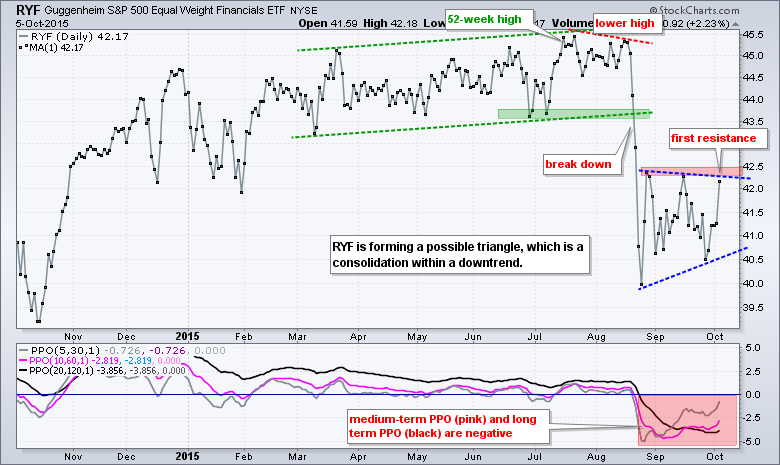
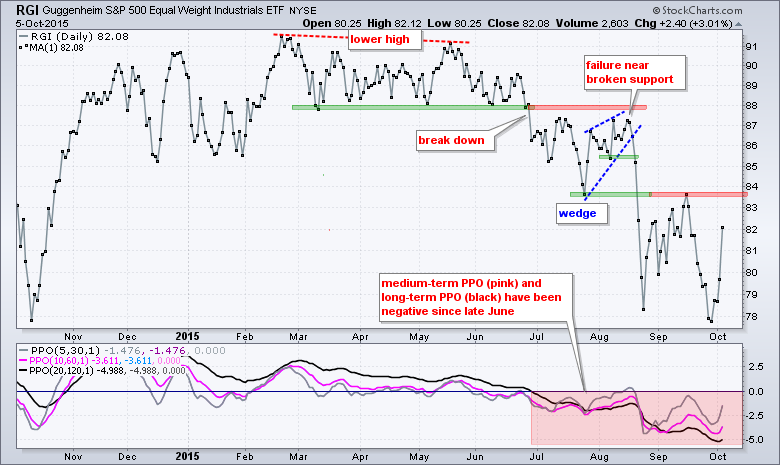
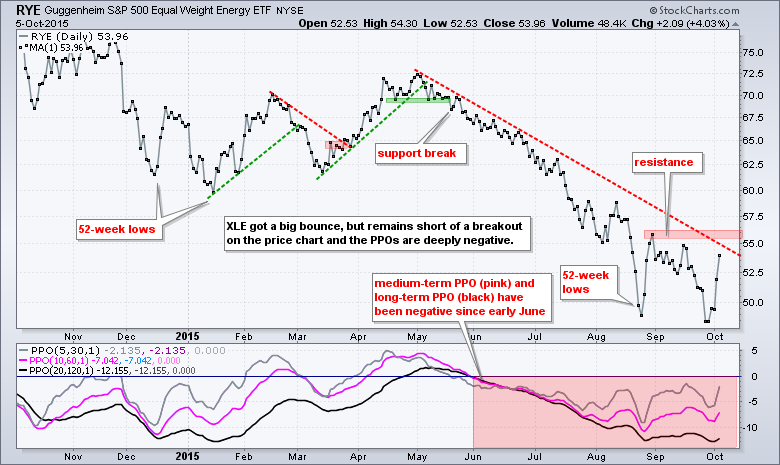
The next charts cover the remaining five sector ETFs. All are bouncing, but none of them have yet to break important resistance levels and the overall trends are still down.

****************************************
Thanks for tuning in and have a good day!
--Arthur Hill CMT
Plan your Trade and Trade your Plan
******************************************


