Energy Weighs on Two Key Sectors // SPY Puts the PPO to the Test // IWM Hits Moment-of-truth // Relative weakness in Small and Mid Caps Persists // XLF and RYF Tests November Lows // Regional Bank SPDR Breaks Support // XLI and RGI Exceed November Lows // Four Inside Days for IBB // Stocks of Interest (11) ////
Energy Weighs on Two Key Sectors
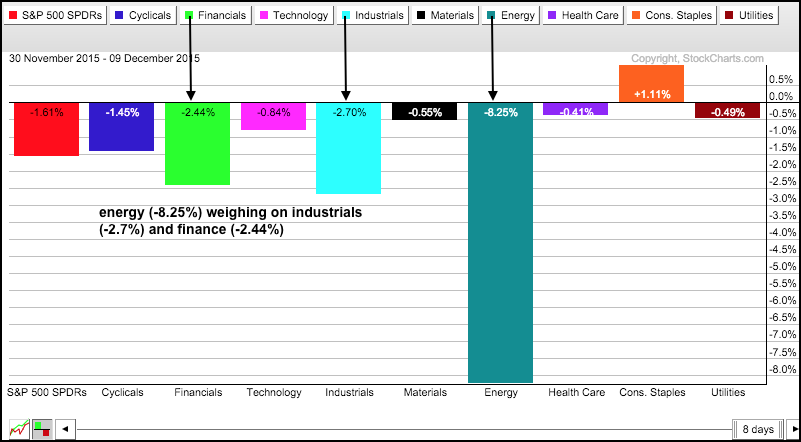
It has been a rough start to December with the SPY losing 1.6%. Eight of the nine sector SPDRs are down with the Energy SPDR (XLE) loosing over 8%. Once again, we have an outsized decline in energy weighing on the broader market. The Finance SPDR (XLF) and Industrials SPDR (XLI) are down over 2% and also leading the way lower. Looks like these two are feeling the heat in the energy markets. The Consumer Staples SPDR (XLP) is the only sector with a gain month-to-date. No matter what, we still need soap, food, drugs and booze. Is this the beginning of the end for large-caps or is this just a pullback within a bigger uptrend?
While I am concerned with recent weakness in the finance sector, I still think the October surge is the dominant chart feature for SPY and the choppy trading range over the last five to six weeks is a consolidation. SPY and QQQ were overbought after the October surge and entitled to a corrective period, which involves a consolidation or pullback. Note that we are getting short-term oversold and the mid November lows are in sight. This means we may be ripe for a bounce and possible continuation of the bigger uptrend. There are still sizable pockets of weakness within the market so any bounce could be rocky.
SPY Puts the PPO to the Test
SPY is attempting to firm above the mid November low and the short-term PPO (5,30,1) has a bullish setup in play. First and foremost, the bigger trend is up after the October surge and the mid November low is the key level to watch. A close below 202 would forge a lower low and call for a reassessment. A triangle is taking shape as long as the ETF holds above this low and a triangle is a continuation pattern. The prior move was up and this makes the triangle a bullish continuation pattern.
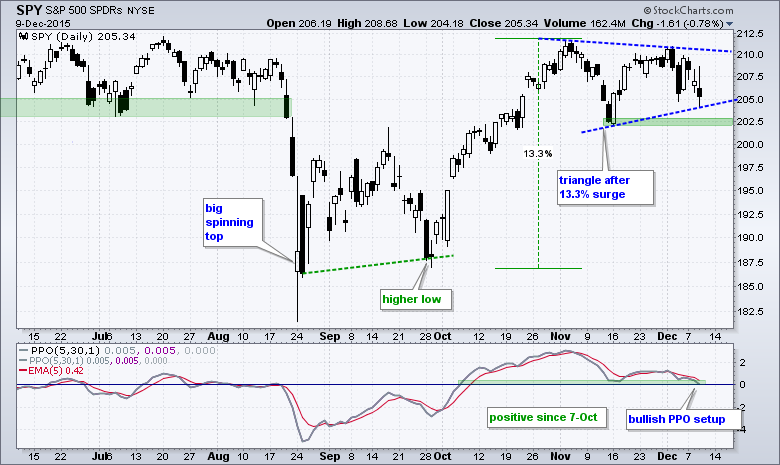
According to the PPO trading strategy, the trend filter is bullish when the medium-term PPO (10,60,1) and long-term PPO (20,120,1) are positive. These are not on the chart now, but they are positive and this also suggests that the bigger trend is up for SPY. The short-term PPO (5,30,1) moved to the zero line for a bullish setup, which means we have a pullback within an uptrend and may be near a short-term low in SPY. An upturn in the PPO and signal line cross would turn this bullish setup into a bullish signal. You can read more about the PPO strategy here.
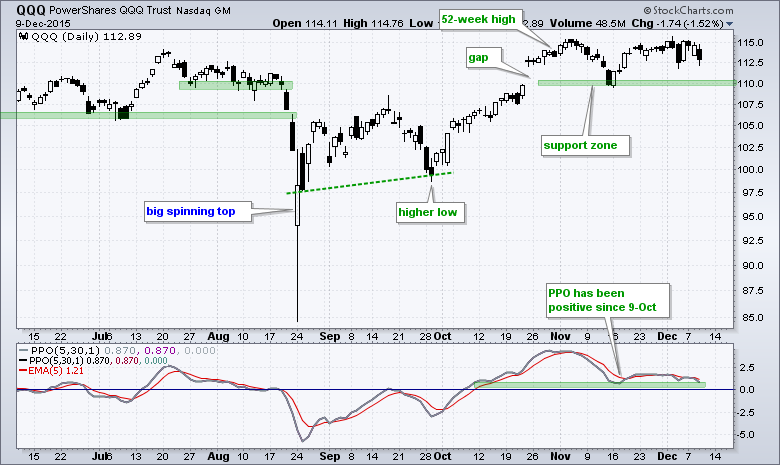
QQQ fell over 1% for the second time in two weeks, but remains within 3% of a 52-week high. Should we read more into last week's 52-week or the two declines of around 1.5%? There may be some short-term issues, but the bigger trend is still up and QQQ remains well above the mid November low. The medium-term PPO and long-term PPO are also both positive. I would reevaluate on a close below the November low.
IWM Hits Moment-of-truth
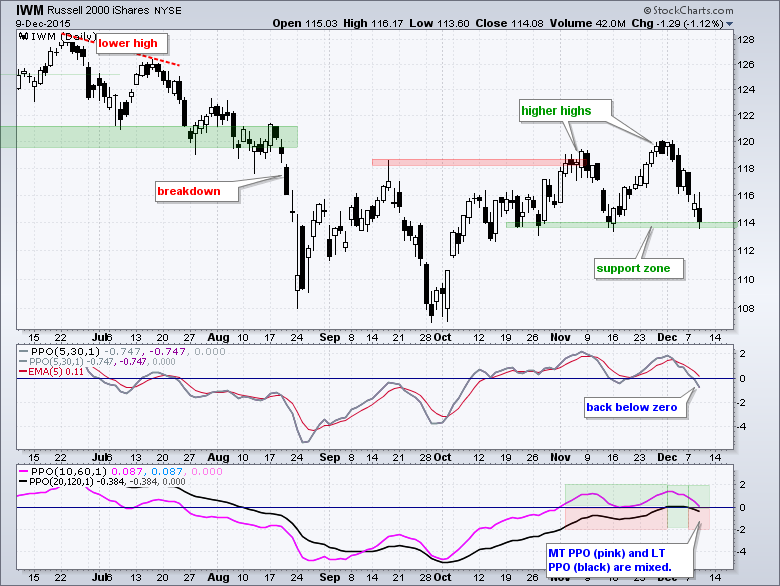
While SPY and QQQ still look ok, the Russell 2000 iShares (IWM) fell to support and is at its moment-of-truth. Even though small-caps are considered the canaries in the coalmine, keep in mind that small-caps account for around 10% of the total US stock market. On the price chart, IWM established support in the 114 area in late October and mid November, and is back testing this zone. A break would forge a lower low and reverse the 10 week uptrend.
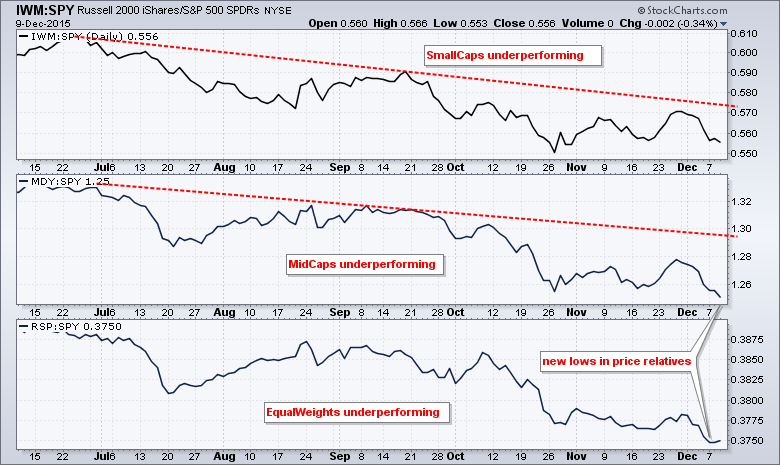
Relative weakness in Small and Mid Caps Persists
It is not hard to find the pockets of weakness in the stock market. Just create some ratio charts and look for the falling lines. The chart below shows small-caps relative to large-caps (IWM:SPY), mid-caps relative to large-caps (MDY:SPY) and equal-weights relative to large-caps (RSP:SPY). The latter to ratio hit new lows for the move and the IWM:SPY ratio is near its October low. All three are in clear downtrends, which tells us that small-caps, mid-caps and equal-weights are lagging. While this is not a good sign for the broader market, we have yet to see break downs in SPY and QQQ. Large-caps are still the 800 pound gorilla in the room.
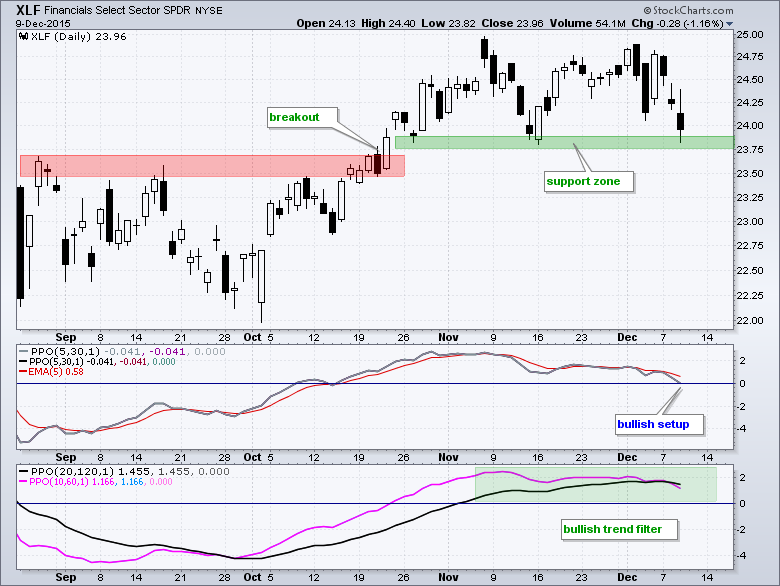
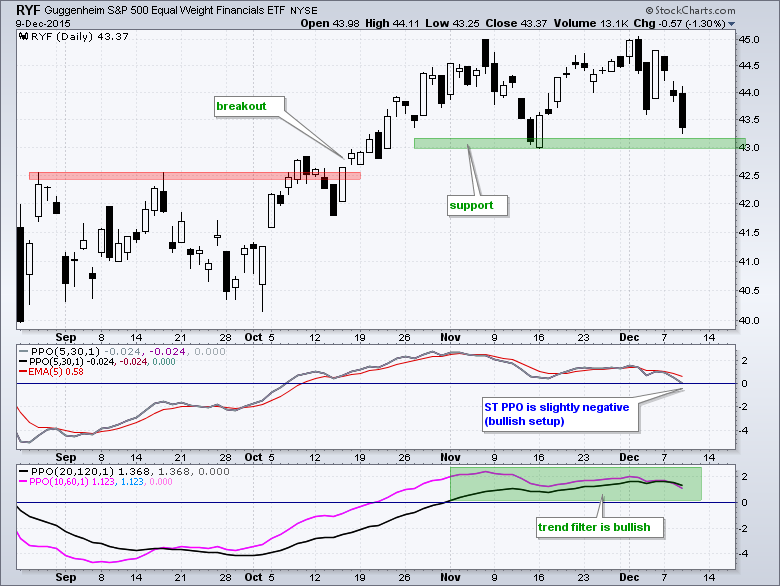
XLF and RYF Tests November Lows
The Finance SPDR (XLF) and EW Finance ETF (RYF) were hit pretty hard this month and led the market lower. Both are now setting up for a test of the November low. A close below the support zones would call for a reassessment of the October breakout. Note that the trend filter is bullish with the PPO (20,120,1) and PPO (10,60,1) in positive territory. The short-term PPO (5,30,1) moved below zero for a bullish setup. A move back above zero or above the signal line would turn this bullish setup into a bullish signal.
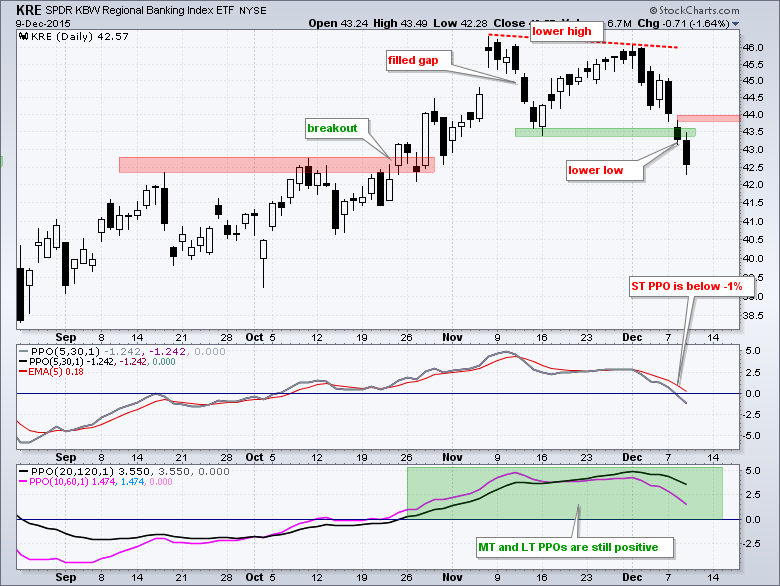
Regional Bank SPDR Breaks Support
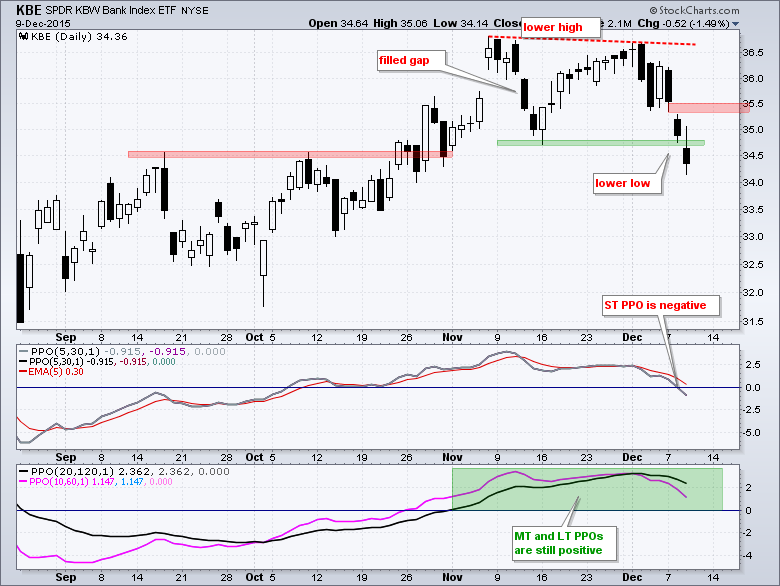
Even though XLF and RYF have yet to break their November lows, the Regional Bank SPDR (KRE) and Bank SPDR (KBE) did break their November lows. This shows relative weakness and a potential trend reversal. KRE presents us with a trading dilemma because the ETF broke support and the trend filter is still bullish (MT and LT PPOs). Based on the PPO strategy, I should be looking for bullish setups and be alert when the short-term PPO (5,30,1) is near the zero line. There could a bullish setup present, but the PPO (5,30,1) is far from a bullish signal because it is near -1%. It needs to turn positive and KRE needs to fill Tuesday's gap before a bullish signal can materialize.
XLI and RGI Exceed November Lows
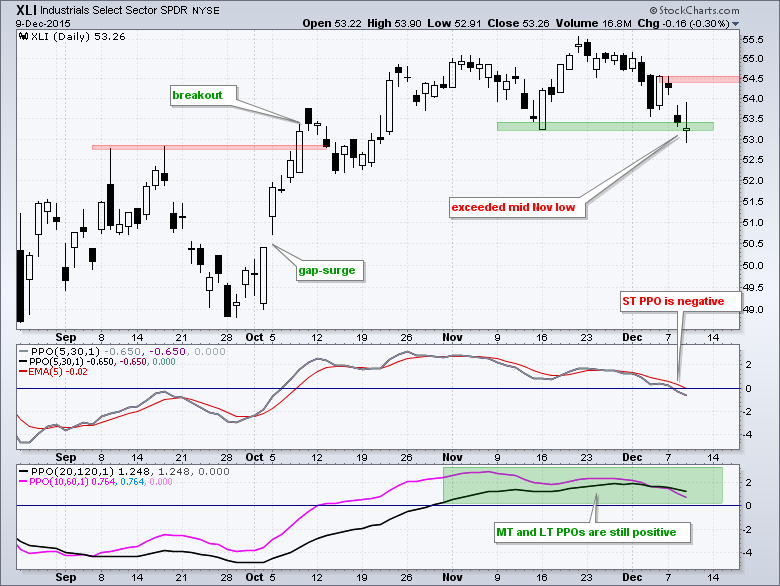
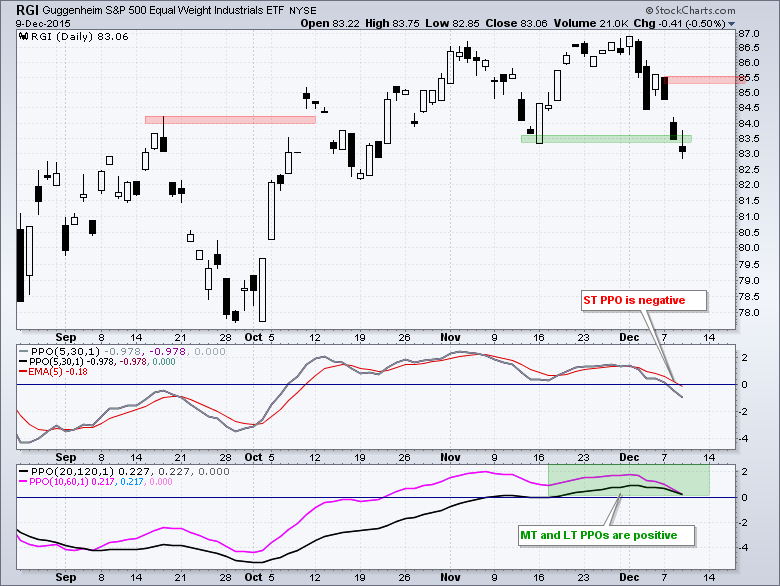
Even though I am marking support levels based on prior lows, there is no guarantee that a break below these lows will result in a lasting trend reversal. ETFs have dozens of moving parts (stocks) pushing them up and pulling them down. Support levels, therefore, are a bit imprecise. Nevertheless, the November low marks a benchmark low we can use to compare various charts. ETFs that break their November lows show relative chart weakness and ETFs that hold their November lows show relative chart strength. XLI exceeded the mid November low and technically forged a lower low. XLI is also showing relative weakness since late November. Tuesday's gap down and the PPO (5,30,1) are the first things to watch for signs of a short-term reversal. Look for a move above 54.6 to fill the gap and the PPO to turn positive. Barring such moves, the bias for industrials is shifting to the bears.
Four Inside Days for IBB
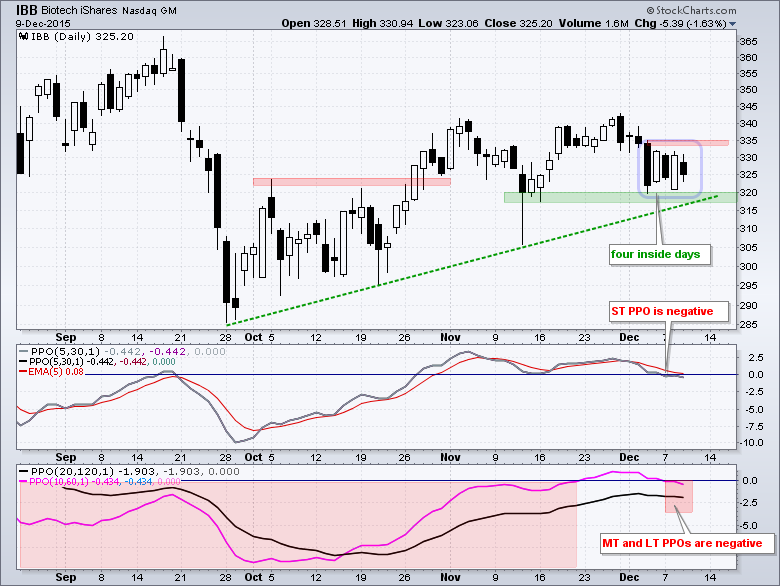
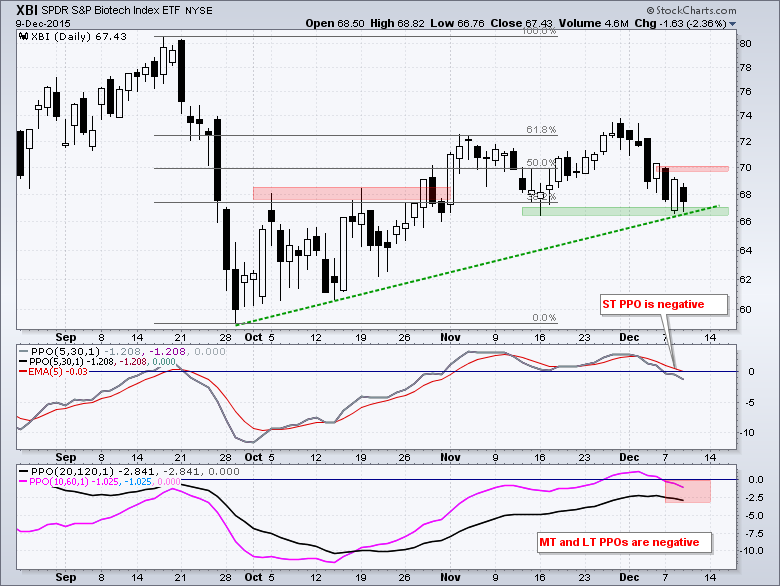
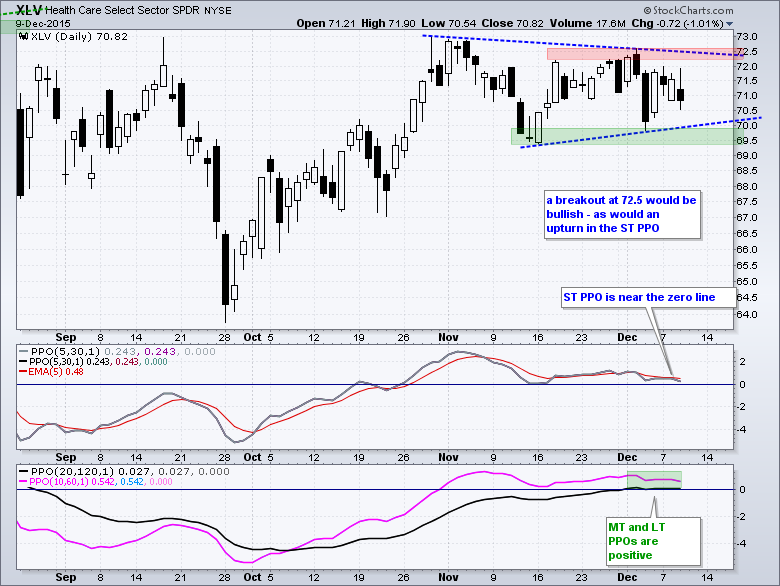
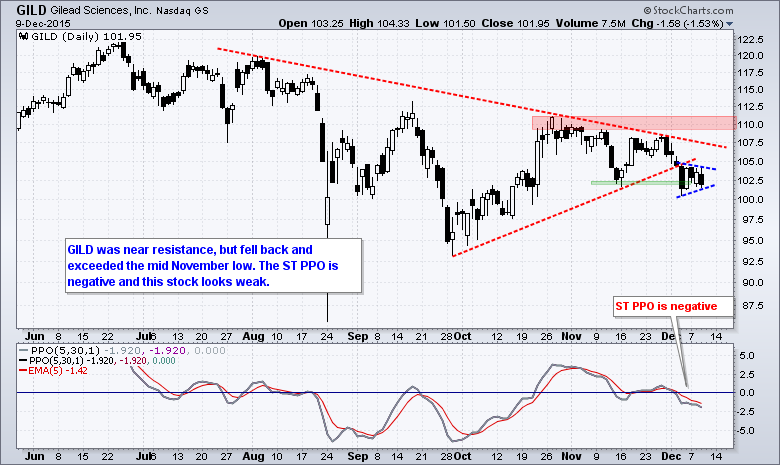
The Biotech iShares (IBB) and Biotech SPDR (XBI) are at their moment-of-truth. The indicator evidence is already bearish and both are testing their mid November lows. Support breaks would confirm the bearish indicators and argue for a continuation of the December plunge. Short-term, both are actually trying to firm and hold support so be careful. XBI formed a harami at support on Tue-Wed and IBB formed four inside days in a row. Whatever happens to biotechs will likely affect the HealthCare SPDR (XLV), which has a bullish trend filter and a bullish setup working in the short-term PPO (5,30,1).
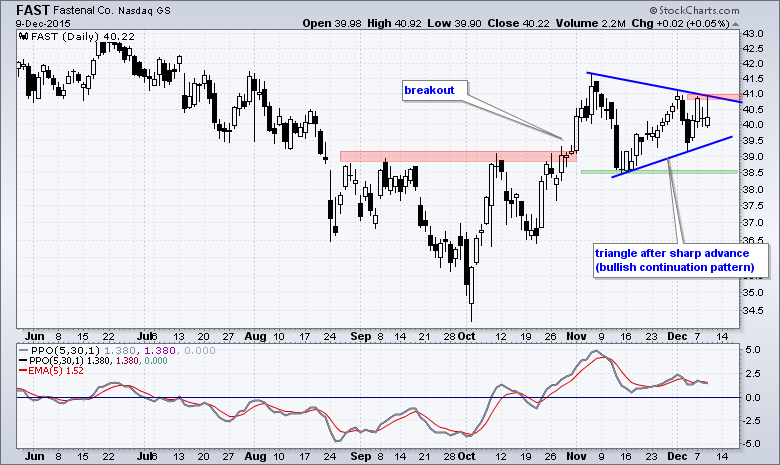
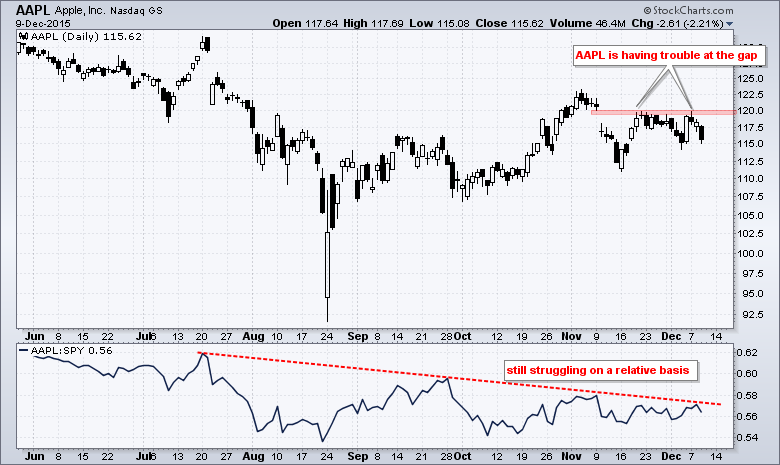
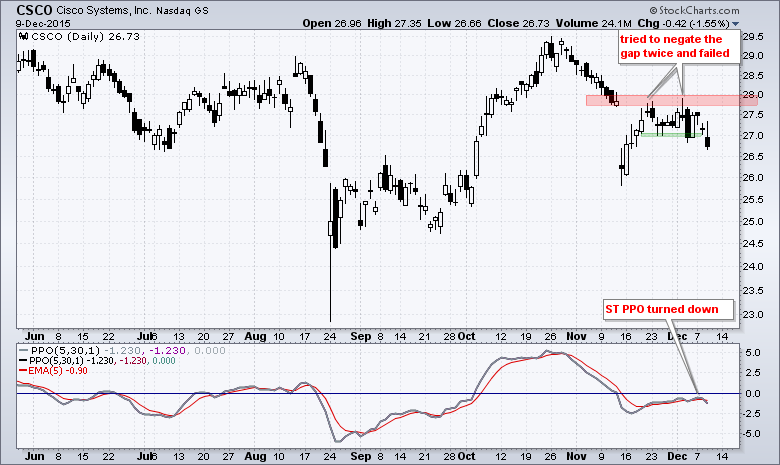
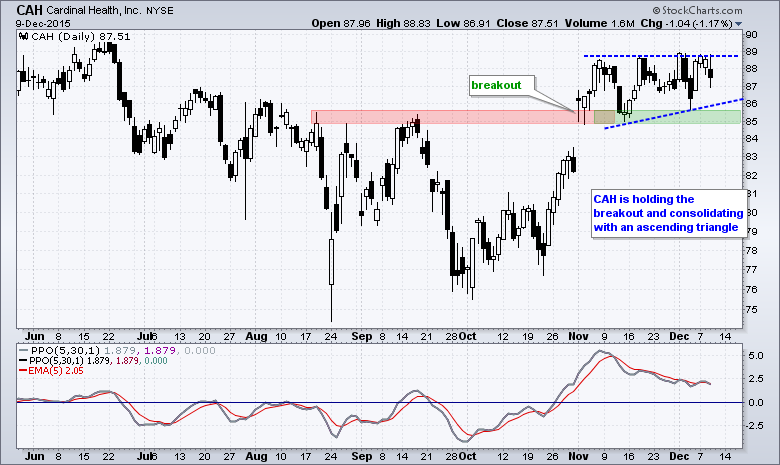
Stocks of Interest (11)
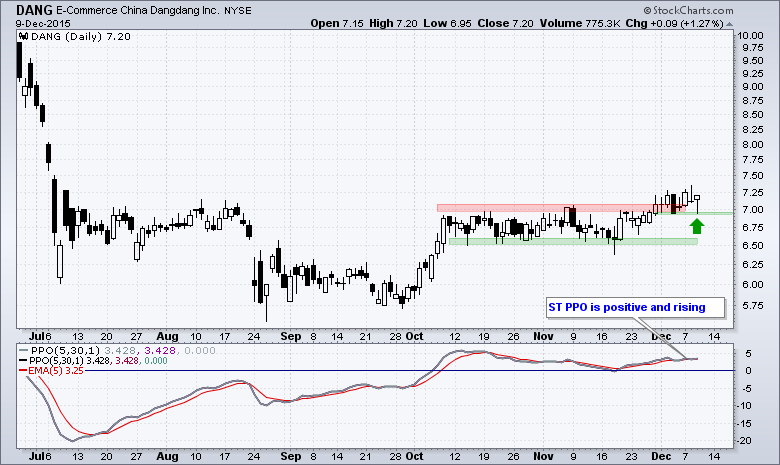
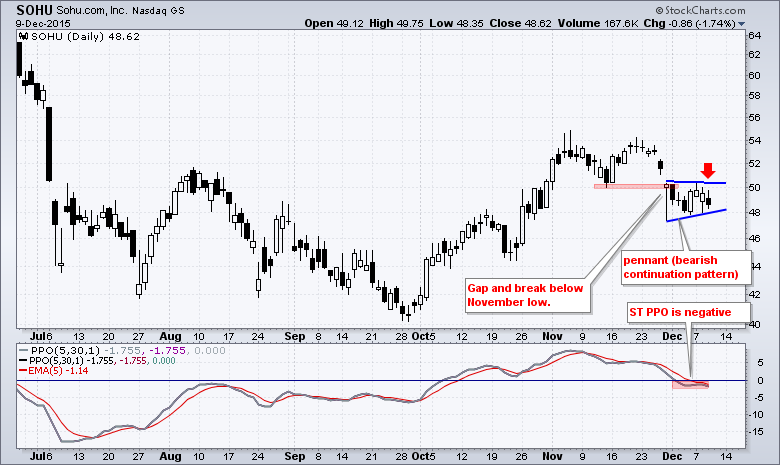
We start with a pair of Chinese stocks that appear to be going different directions. DANG is breaking out and showing some strength, while SOHU broke its November low and shows relative weakness. DANG is low priced and carries above average risk.
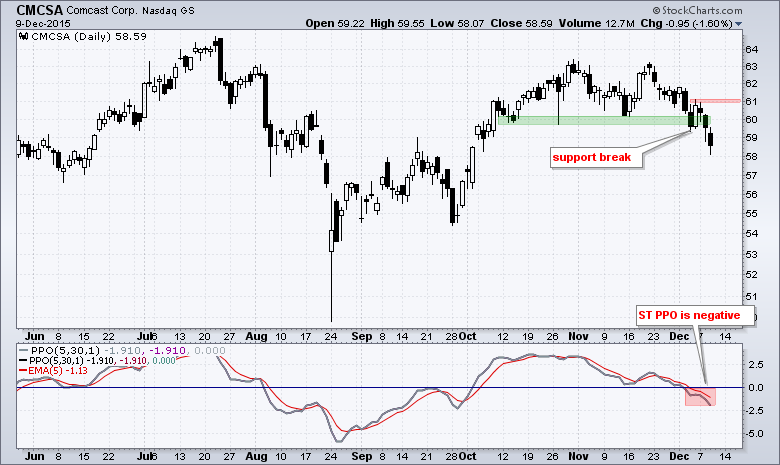
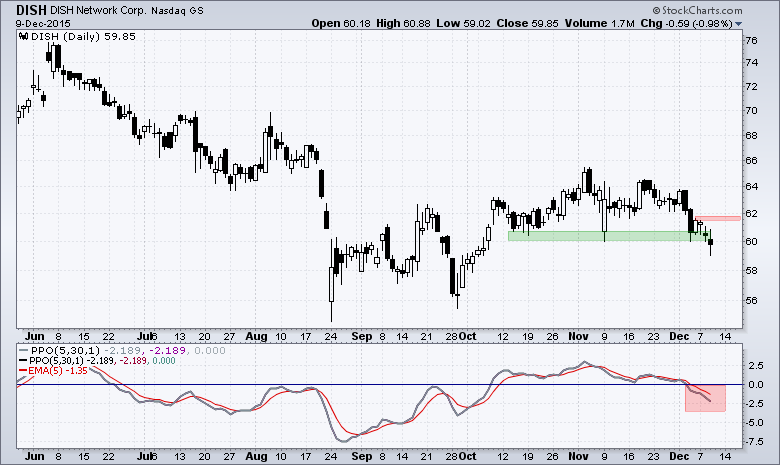
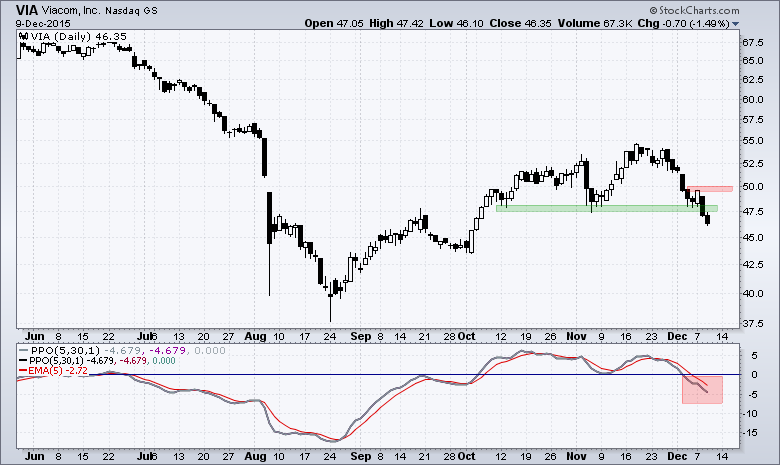
Next we have a group of media stocks that are breaking down and showing relative weakness the last three weeks. Don't forget that these stocks were pummeled in July-August and fell short of their summer highs in October-November.
And the rest....
****************************************
Thanks for tuning in and have a good day!
--Arthur Hill CMT
Plan your Trade and Trade your Plan
*****************************************


