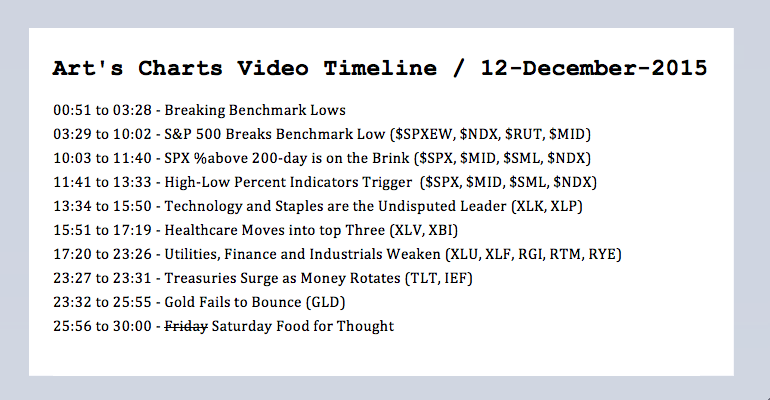
S&P 500 Breaks Benchmark Low // SPX %Above 200-day Is on the Brink // High-Low Percent Indicators Trigger // Technology is Undisputed Leader // Healthcare Moves into top Three // EW Consumer Discretionary Breaks Down // Treasuries Surge as Money Rotates // Gold Fails to Bounce // Friday Food for Thought ////
S&P 500 Breaks Benchmark Low
It was quite the week in the financial markets, and not just because of the big declines in the stock market. As noted earlier this week, the November lows marked a "benchmark" low that I was watching closely. A benchmark low is a price trough that forms in most ETFs and stocks. A sharp decline in the first half of November and sharp advance in the second half produced this benchmark low. Most of the broad index ETFs closed below this low with small-caps and mid-caps leading the charge. QQQ and QQEW remain above this benchmark low and show relative strength. With the majority of the broad index ETFs breaking these benchmark lows, it looks like the tide has turned and the trend has shifted back to the bears.
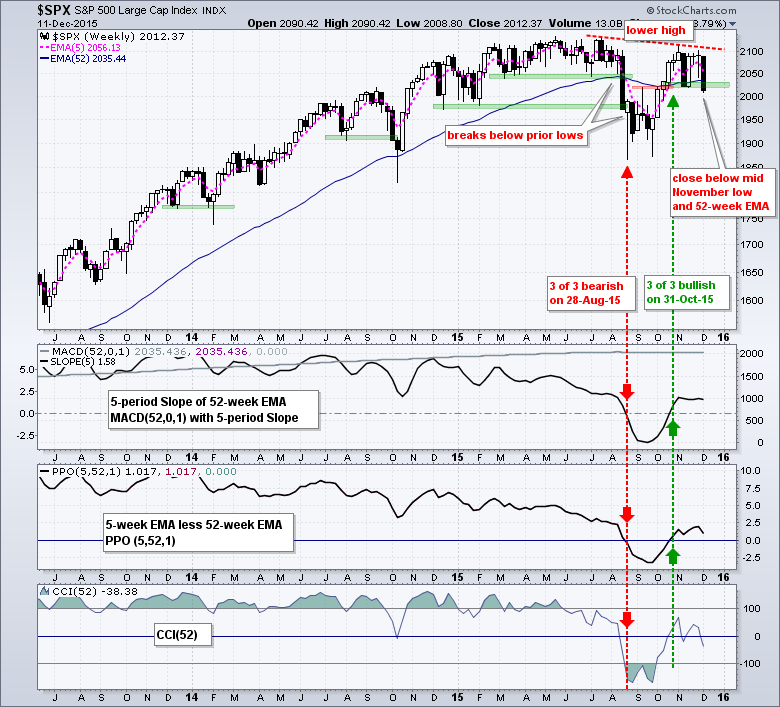
The first chart shows the S&P 500 with the three trend indicators: the Slope of the 52-week EMA, the PPO(5,52,1) and CCI(52). You can read about these here. The trend bias is up when two of the three are positive and down when two of the three are negative. Two of the three are still positive for the S&P 500 and all three are positive for the Nasdaq 100. However, all three are negative for the Russell 2000 and the S&P MidCap 400, and have been since mid August. Large-caps are the minority in numbers, but the majority when it comes to market cap. This is why the S&P 500 and Nasdaq 100 have held up so well - until this week. The S&P 500 fell over 3% for the second week in the last two months and broke below the November low. Also notice that a lower high is taking shape because the index failed to exceed its July high. Even though two of the three trend indicators remain positive, this lower high-support break sequence is a very negative development that could set up a test of the August-October lows, which are another 100+ points lower.
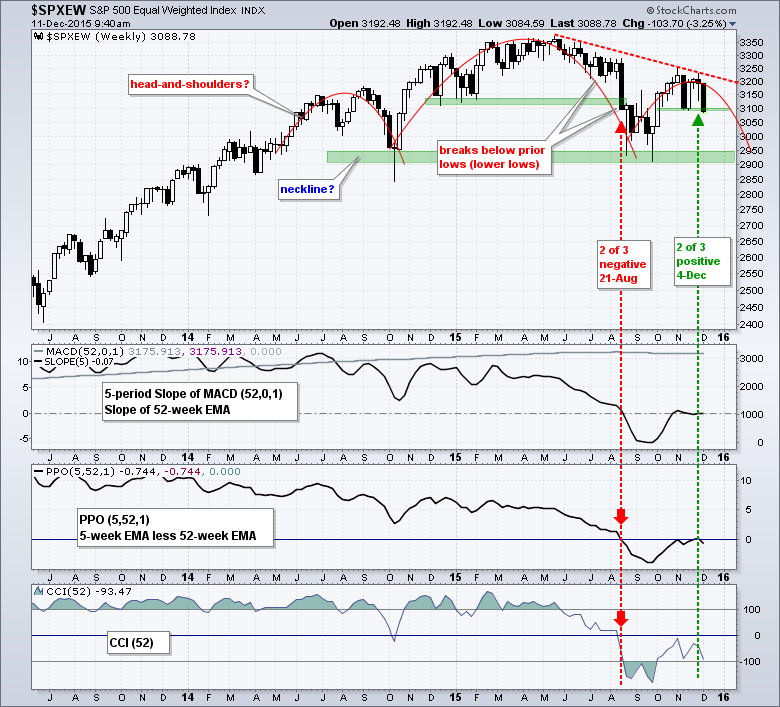
The S&P 500 Equal-Weight Index is more in line with the Russell 2000 and S&P MidCap 400 because all three trend indicators moved back below zero this week (bearish). The index also broke the November low and could be tracing out a big head-and-shoulders reversal pattern. Neckline support is set in the 2900-2950 area. The pattern is not that important because the trend indicators are already pointing down and a lower high is taking shape. Thus, small-caps, mid-caps and equal-weights are clearly in bear mode right now and these represent the majority of issues in the stock market. The S&P 500 and Nasdaq 100 held up better, but appear to be breaking down under the pressure from the troops. Yes, it is a rebullion.
Percent from 52-week Highs
The table below highlights the performance discrepancies among the major index ETFs. This table is sorted by the percentage below the 2015 high. Large-caps and the Q's are holding up better because they are 4.5-5% below their 52-week highs. Doesn't seem like a bear market when these ETFs are so close to their all time highs. The trouble starts once we move to equal-weights, mid-caps and small-caps. The S&P MidCap 400 is down around 10% from its 52-week high and the Russell 2000 iShares (IWM) is down around 15%.
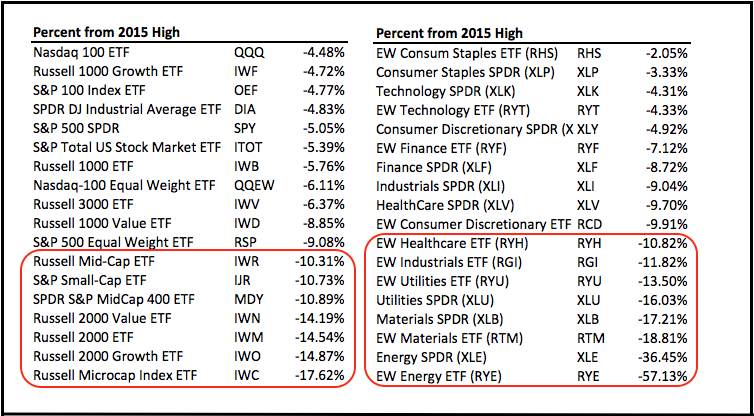
The second half of the table shows the nine sector SPDRs and the nine equal-weight sectors. Five of the eighteen are within 5% of their 52-week highs and showing relative strength (less weakness). Eight are more than 10% from their 52-week highs and the EW Energy ETF (RYE) is around 50% from its 2015 high. Small-caps and energy represent the two pockets of extreme weakness. Though not as extreme, notice that materials and utilities are more than 15% from their highs.
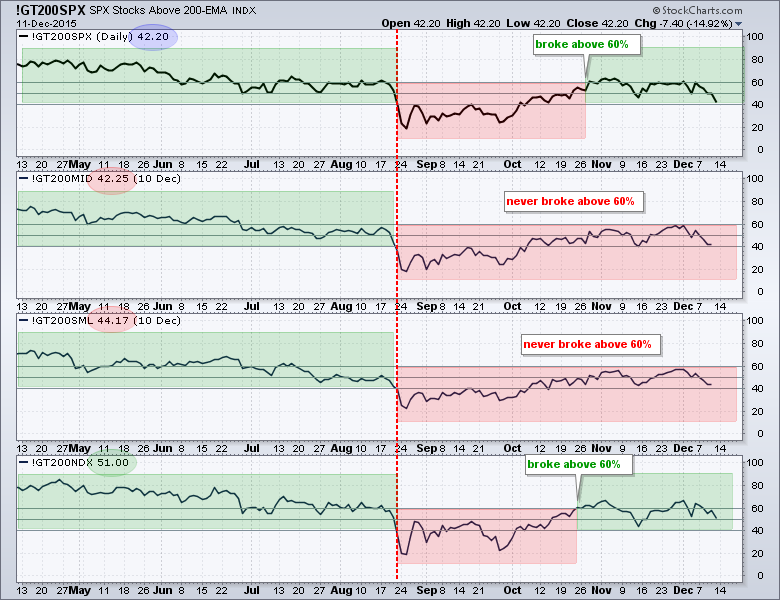
SPX %Above 200-day Is on the Brink
The split market also appears in the breadth indicators, but large-caps could join the bearish party soon. The chart below shows the percentage of stocks above their 200-day EMA in the S&P 500, S&P MidCap 400, S&P Small-Cap 600 and Nasdaq 100. A move above 60% shows enough upside participation to turn the indicator bullish and this remains until a move below 40%, which shows enough downside participation to turn the indicator bearish. I could use 50% for signals, but using levels just above and below the midpoint reduces whipsaws significantly. The S&P 500 and Nasdaq 100 exceeded 60% to turn bullish in late October, but the S&P MidCap 400 and S&P Small-Cap 600 did not and remained net bearish. As with the weekly trend indicators, these two have been bearish since 21-August. Currently, 42.2% of S&P 500 stocks are above their 200-day EMAs (and 57.8% are below) so this indicator is on the brink of a bearish signal. The Nasdaq 100 remains the strongest (least weak), overall with 51% of its components above the 200-day EMA.
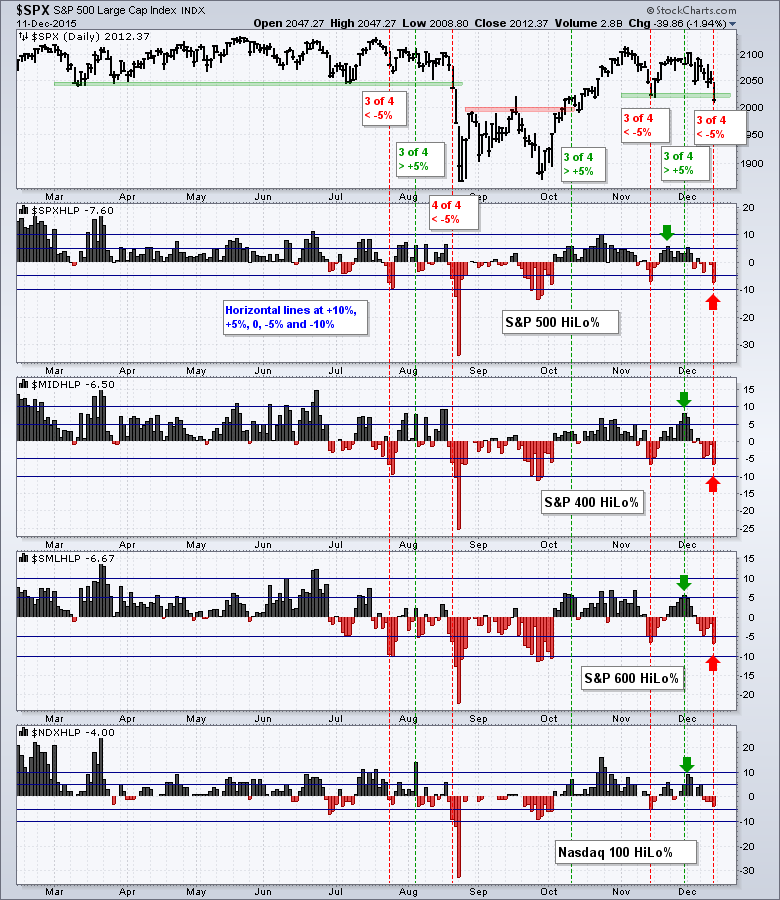
High-Low Percent Indicators Trigger
High-Low Percent for the S&P 500, S&P MidCap 400 and S&P Small-Cap 600 fluctuated between +10% and -10% since October and did not show a strong bias the last two months. These indicators were regularly above +10% earlier in the year and punched below -10% a few times from July to September. These were strong signals. Typically, I consider this indicator bullish when 3 of the 4 exceed +5% and bearish when 3 of the 4 exceed -5%. Even though a tighter signal level will produce more whipsaws, I am still using this threshold because it provides an early warning that buying or selling pressure is expanding. The indicator went bearish in mid November, bullish in late November and back bearish on Friday. Sorry, but whipsaws are all part of the game. As Ed Seykota once said: "the only way to avoid whipsaws is to stop trading". One of these signals will likely take hold and evolve into a trend so I will stick to the current signal, which is bearish.
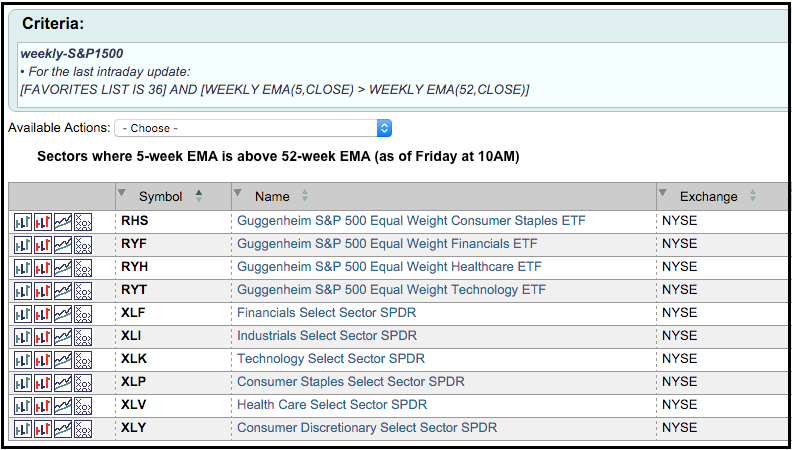
Sector Overview
The next charts focus on the nine sector SPDRs and the nine equal-weight sectors. I first ran a scan on weekly data and found that the five week EMA is above the 52-week EMA for six of the nine sector SPDRs and four of the nine equal-weight sector ETFs. This suggests the majority of equal-weight sectors are in downtrends, but the majority of large-caps sectors are still in uptrends. Split again! As with all moving averages, the 5-week EMA has a lag factor and it will take another week or two of selling pressure to push the remaining holdouts below their 52-week EMAs.
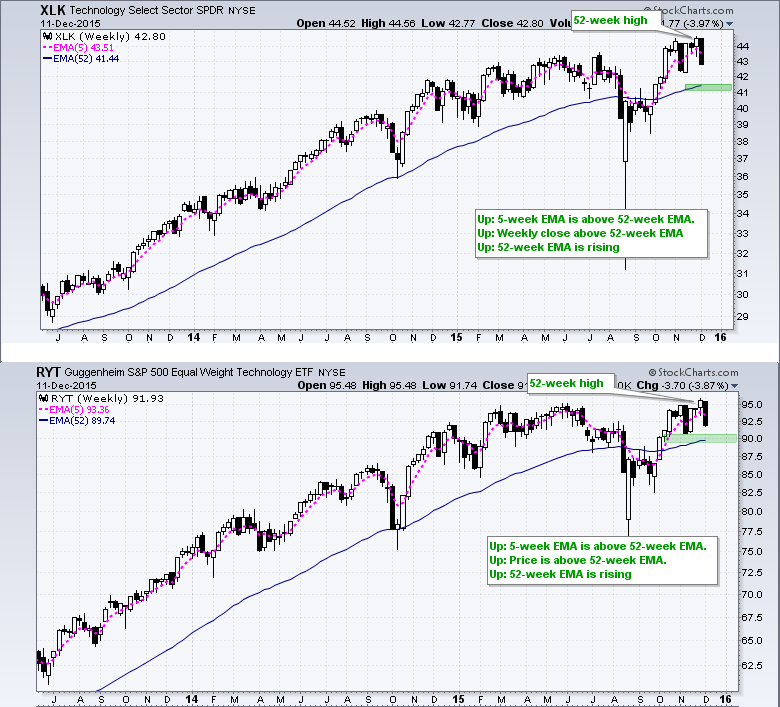
The charts below show both sectors using a little copy-and-paste technology to put them both on the same image. The link for each image, however, is to the sector SPDR. I am showing these charts with the 5-week EMA and the 52-week EMA, which is the basis for the PPO(5,52,1). Using these two EMAs, I am trying to answer three questions to determine the trend. Is the 5-week EMA above or below the 52-week EMA? Is the weekly close above or below the 52-week EMA? Is the 52-week EMA rising, falling or flat? Throw in some basic chart analysis and we have the foundation for long-term trend identification. Overall, technology and consumer staples are still in clear uptrend and the leaders. The healthcare sector got an upgrade to the third spot. Industrials, materials and energy are at the bottom with the rest somewhere in between.
Technology is Undisputed Leader
The technology sector is still the strongest overall because both the Technology SPDR (XLK) and the EW Technology ETF (RYT) hit 52-week highs this month - and both remain in uptrends. The 5-week EMAs are above the 52-week EMAs, the weekly closes are above the 52-week EMAs and the 52-week EMAs are rising. All three point to an uptrend.
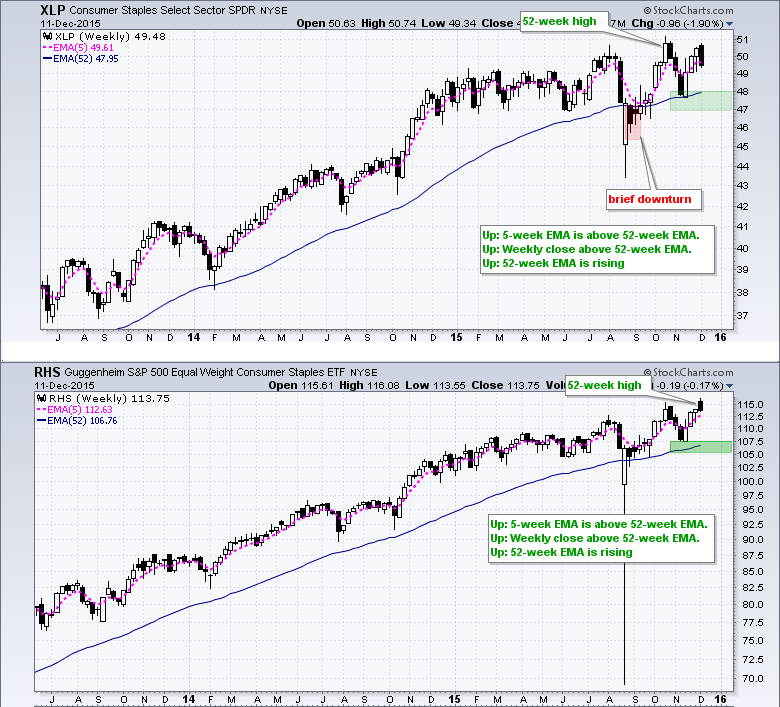
The consumer staples sector is the second strongest sector. The EW Consumer Staples ETF (RHS) hit a new high in December and the Consumer Staples SPDR (XLP) hit a new high in October. I see a weekly bearish engulfing forming in XLP this week, but this is a relatively short-term issue and not enough to affect the overall up trend.
Healthcare Moves into top Three
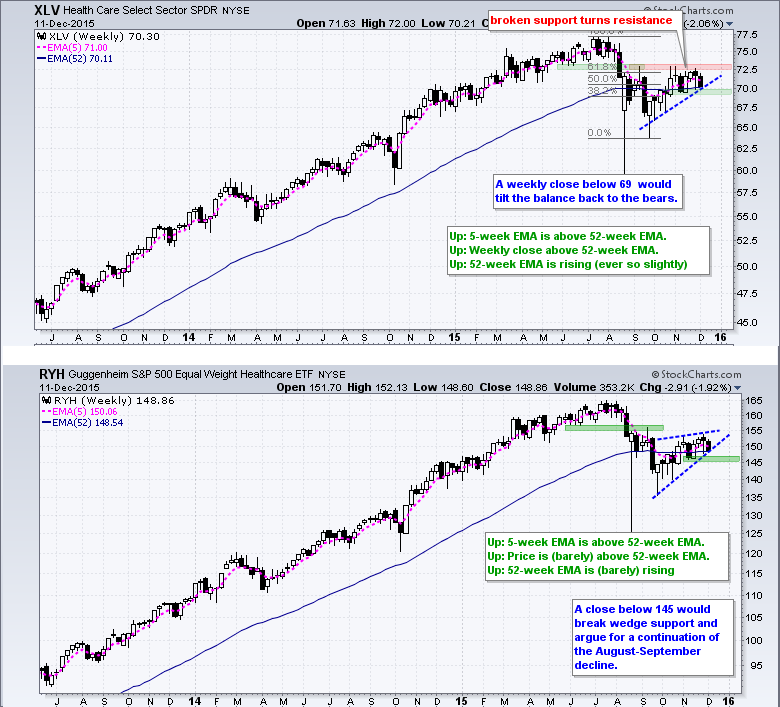
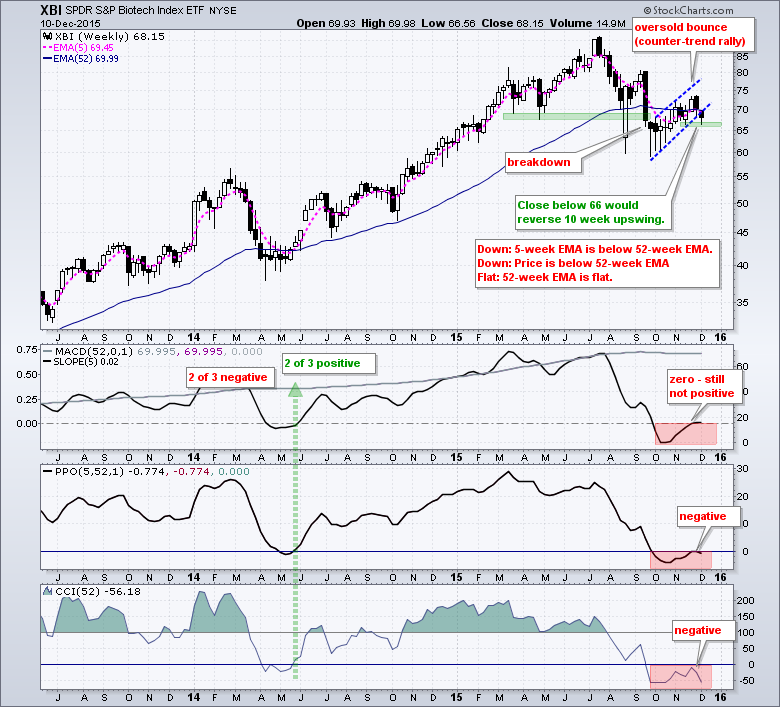
I am going to put the healthcare sector in third place because of relative performance the last few weeks. In addition, the trend indicators are still pointing up for the HealthCare SPDR (XLV) and the EW Healthcare ETF (RYH). The concern here is that the bounce from late September to December is a counter-trend move. Notice that a rising wedge is taking shape in RYH, but it is not confirmed. The mid November lows hold the key and support breaks here would be bearish. I am also showing the chart for the Biotech SPDR (XBI) because these big biotechs will influence the healthcare sector.
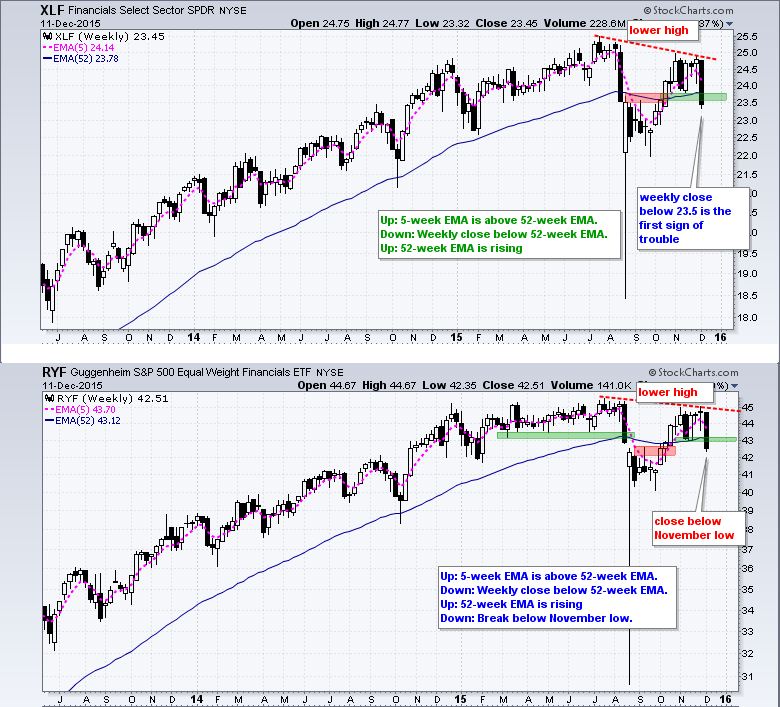
The bullish cases weaken after these three sectors. In fact, the next three sectors occupy the middle ground. Fourth and fifth place is a toss up between finance and utilities. I will go with finance for now because the 5-week EMA is above the 52-week EMA for the Finance SPDR (XLF) and the EW Finance ETF (RYF). Nevertheless, the plunge in oil hit the junk bond market hard and this weighed on some of the smaller banks. Lower highs could be forming the XLF and RYF. A break below the mid November low would provide the first sign of a reversal.
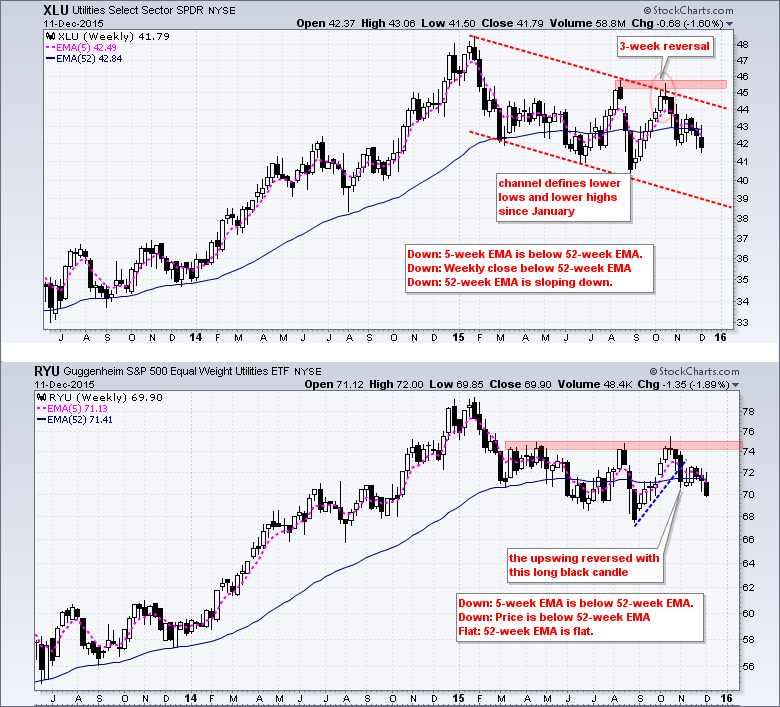
The utilities sector is holding up better than the market this week because of its defensive characteristics. Nevertheless, the Utilities SPDR (XLU) remains in a downtrend since February with lower lows and lower highs. The 5-week EMA is below the 52-week EMA, price is below the 52-week EMA and the 52-week EMA is falling. The trend indicators are clearly pointing down.
EW Consumer Discretionary Breaks Down
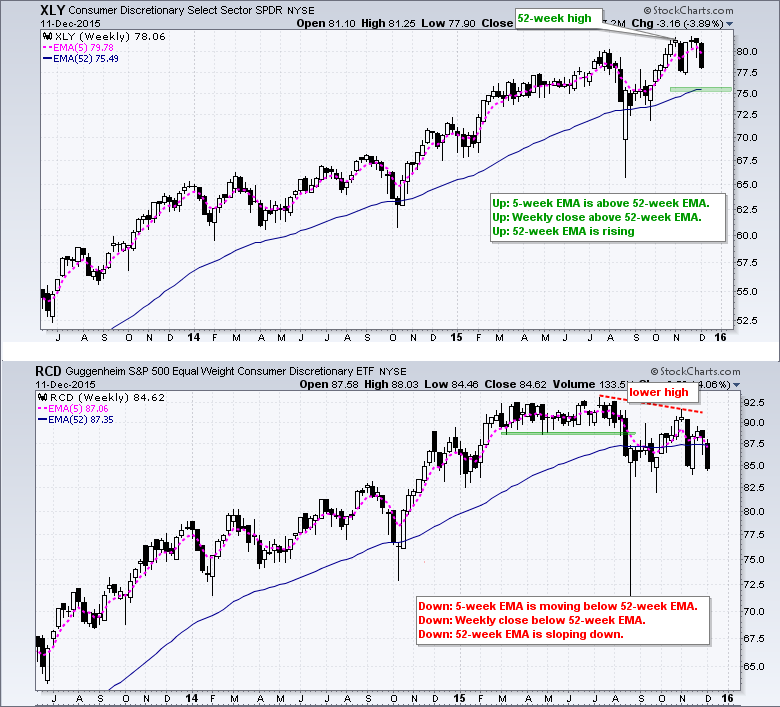
Consumer discretionary is the mixed up sector because the Consumer Discretionary SPDR (XLY) is in a clear uptrend and the EW Consumer Discretionary ETF (RCD) is tilting down. RCD is more representative of the sector as a whole and weakness here is not a good sign for the broader market. The 5-week EMA is below the 52-week EMA, the weekly close is below the 52-week EMA and the 52-week EMA is pointing down.
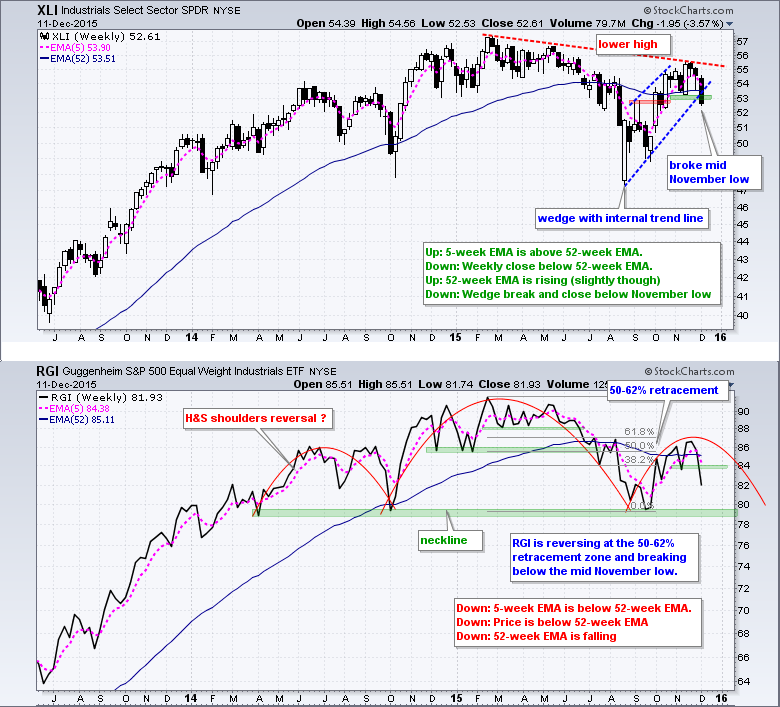
The industrials sector is also a bit mixed up because the Industrials SPDR (XLI) is holding up better than the EW Industrials ETF (RGI). The trend indicators are net positive for XLI, but net negative for RGI. I will be watching support from the November lows for XLI. A breakdown here would be bearish and weigh on large-caps.
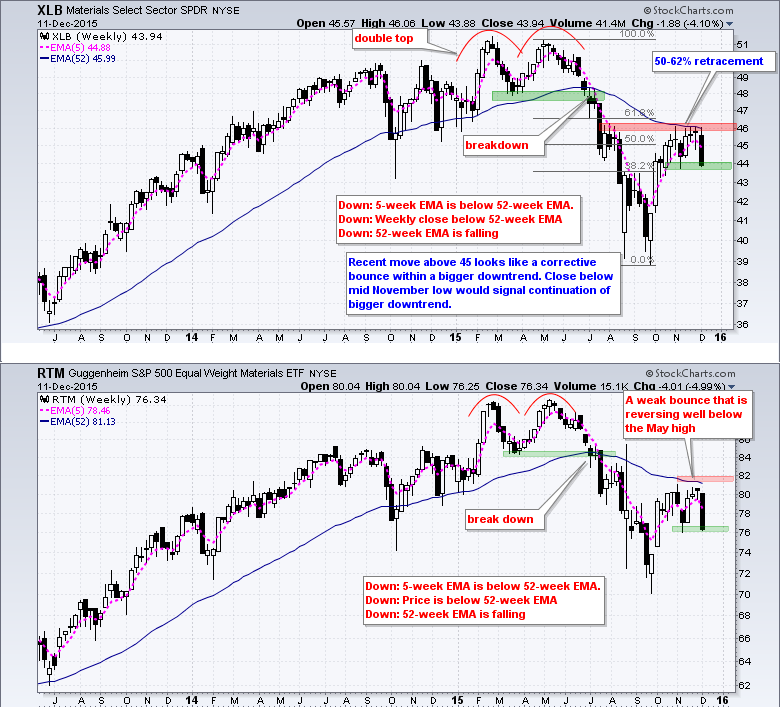
The materials sector broke down ahead of the broader market as both ETF confirmed double tops with support breaks in July. The sector ETFs bounced with the broader market over the last ten weeks, but neither made it above their 52-week EMAs and both remain in long-term downtrends. Both XLB and RTM are holding above their mid November lows so far. Watch these levels for a reversal of this counter-trend bounce.
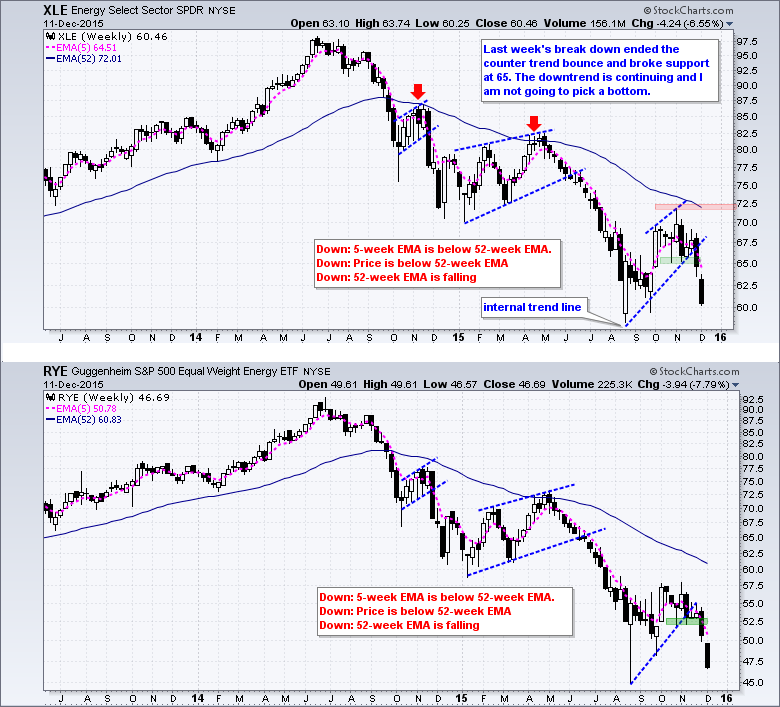
The energy sector fell apart over the last two weeks as both the Energy SPDR (XLE) and EW Energy ETF (RYE) broke support from the mid November lows. These breakdowns ended the counter-trend bounce and resumed the bigger downtrend.
Treasuries Surge as Money Rotates
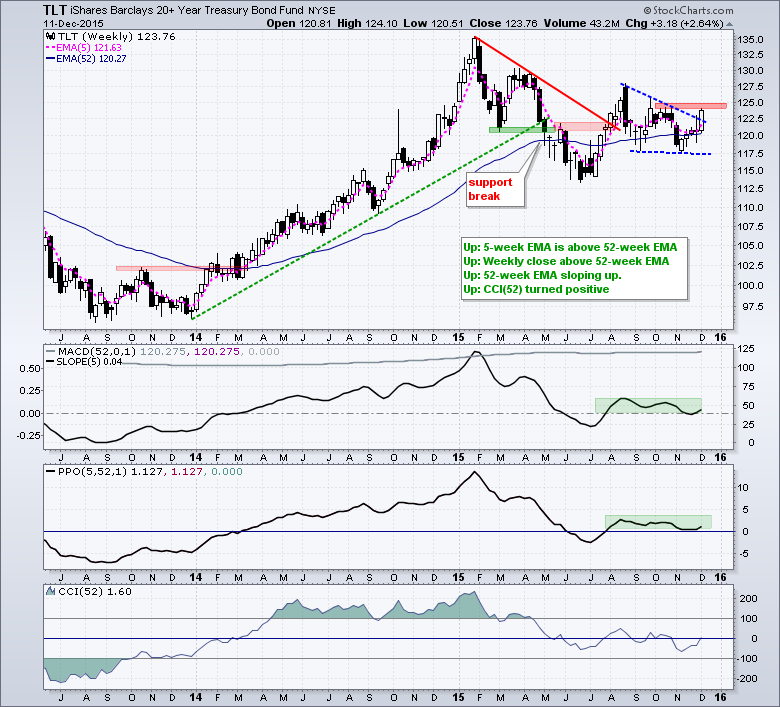
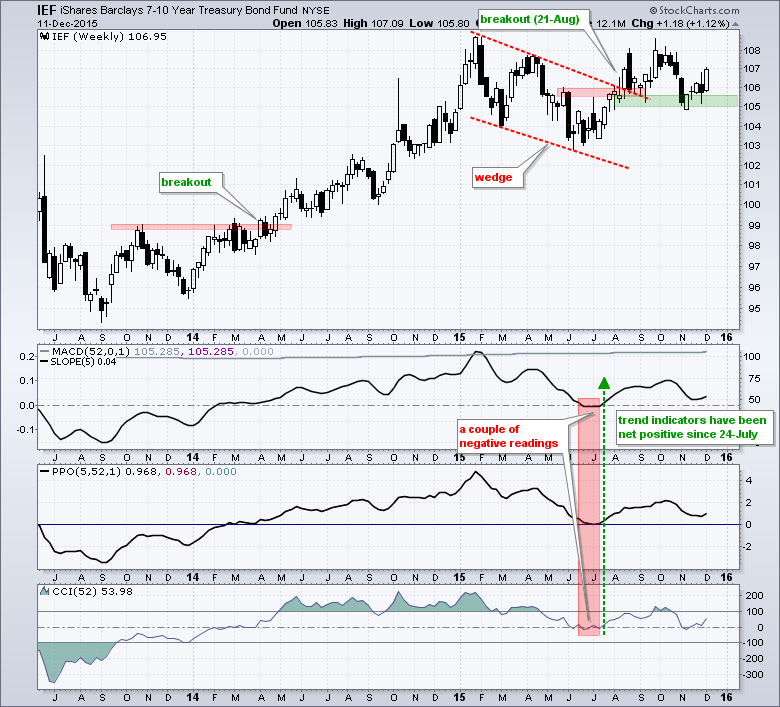
The 20+ YR T-Bond ETF (TLT) surged over 2% as money moved from risk assets (stocks) to relative safe-havens (bonds). The technical picture is currenly bullish on this chart. TLT surged in July-August, formed a falling wedge and broke the wedge trend line this week. A little more follow thru is needed to trigger a resistance break at 125. The weekly trend indicators are all pointing up as well. The second chart shows the 7-10 YR T-Bond ETF (IEF) ultimately holding support in the 105 area and advancing over 1% this week. A weekly close below 105 would call for a reassessment. Don't expect the excitement to end next week because the Fed meets on Tuesday with a policy statement due on Wednesday.
Gold Fails to Bounce
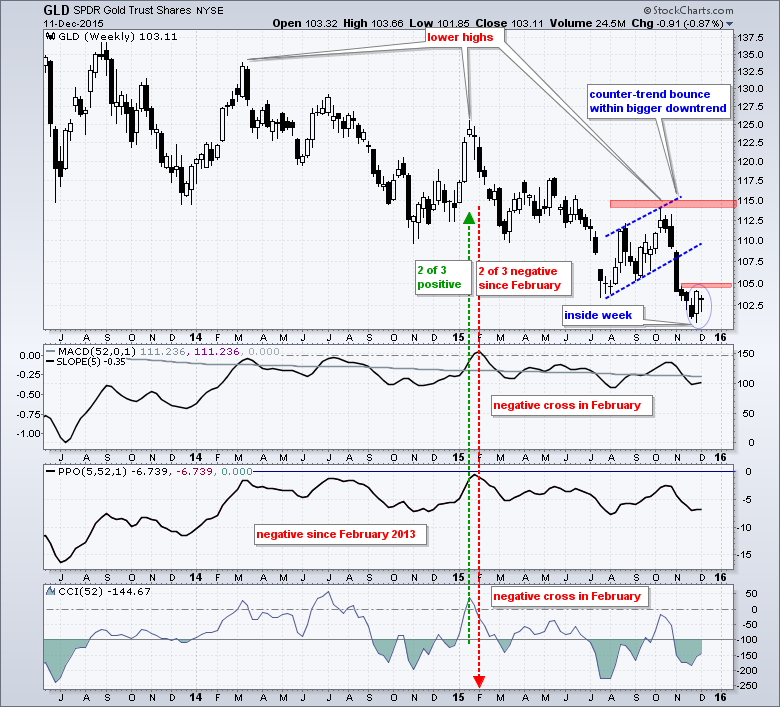
The S&P 500 SPDR was down 3.69% for the week and the US Dollar ETF (UUP) was down .90%, but the Gold SPDR (GLD) also fell with a .87% weekly loss. It is a bit strange to see gold down on such a week. While I would hesitate to find some narrative to fit this picture, I suspect that overall weakness in commodities is keeping gold down. But wait, Spot Copper ($COPPER) was up 1.81% for the week. Although, Spot Crude ($WTIC) was down 11%, Spot Palladium ($PALL) was down 3.85% and Spot Platinum ($PLAT) was down 4.43%. On the price chart, the Gold SPDR was oversold after the decline below 102 and formed an inside week. This is also a harami and it signals short-term indecision that could give way to an oversold bounce. A break above 105 would provide the first sign of short-term strength. Keep in mind that this would be a bounce within a bigger downtrend. GLD hit a 52-week low in November and all three weekly trend indicators are decidedly negative.
Friday Food for Thought
The Internet of Industrial Things is going to be huge.
Ben Carson takes Wall Street out to the woodshed. Keep in mind that these "food for thought" links are designed to make us think! Wall Street’s Biggest Lies
Our very own Gatis Roze wrote a great piece on the skills and mindset required to trade: How A Fellow Investor Critiqued This Trader
The legendary Peter Lynch shares some insights into finding quality stocks (yes, it is fundamental stuff): It’s Not Just ‘Invest in What You Know’âÂÂÂÂÂÂÂÂÂÂÂÂÂÂÂÂÂÂÂÂÂÂ
Click here to follow me on twitter - @arthurhill
****************************************
Thanks for tuning in and have a good weekend!
--Arthur Hill CMT
Plan your Trade and Trade your Plan
*****************************************


