Finance Weighs with Sharp Decline // SPY and QQQ Trend Filters Still Bullish // Seasonal Patterns Point to Bottom This Week // Mind the Gap and Short-term Downtrend ////
Finance Weighs with Sharp Decline
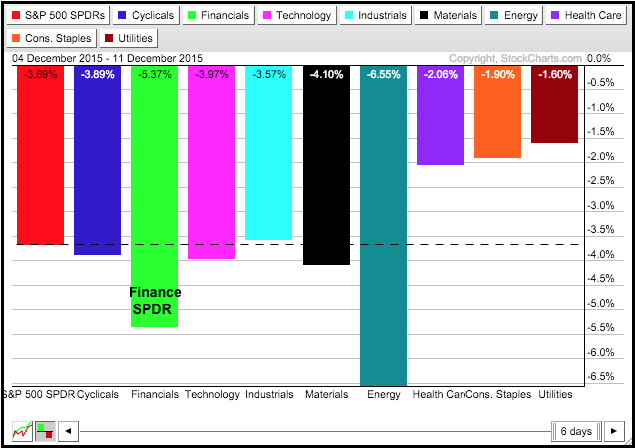
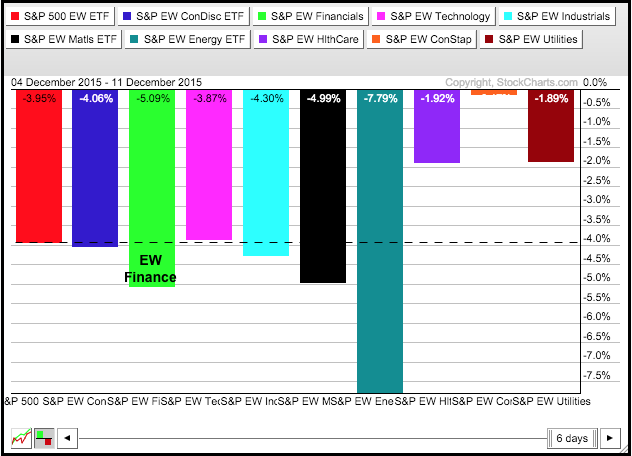
There were some medium-term and long-term bearish developments last week, but the stock market could bounce because it is short-term oversold and the seasonal tendencies are even more bullish. First, note that that market remains a mixed up beast at the moment. Small-caps, mid-caps and equal-weights are clearly in bear mode with lower highs, breakdowns, bearish breadth signals and relative weakness. This group represents the majority of stocks in the market. SPY and QQQ, which represent large-caps and large-techs, are more mixed. This group represents the majority of market capitalization and the minority of stocks. On the bear side, SPY closed below the mid November low with a sharp decline the last two weeks and the High-Low Percent indicators turned bearish. The Finance SPDR (XLF) also broke down and this sector bears the most responsibility for the market breakdown last week. Finance was still bullish in early December and this reversal of fortune is significant because finance accounts for around 16% of the S&P 500. The PerfCharts below shows the Finance SPDR (XLF) and the EW Finance ETF (RYF) with the second largest losses last week.
SPY and QQQ Trend Filters Still Bullish
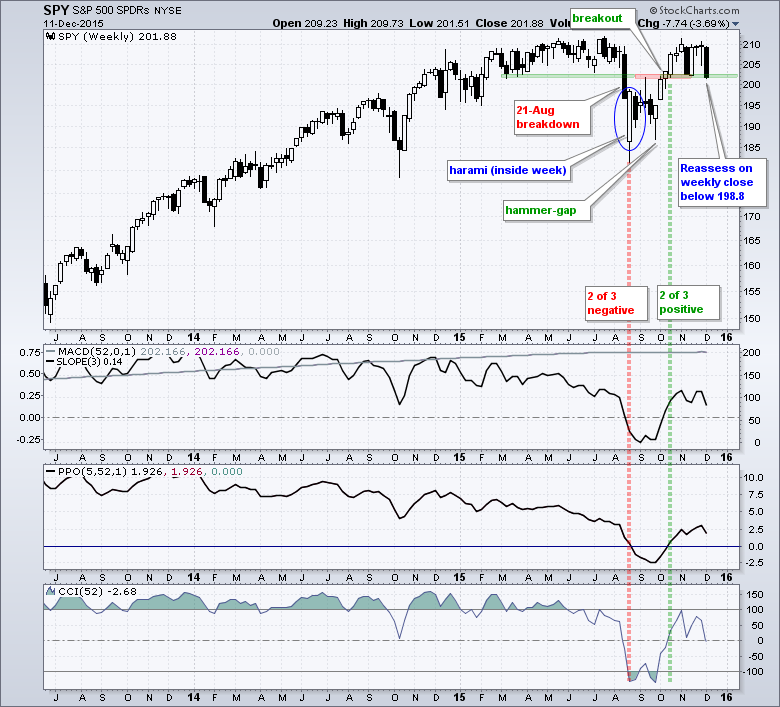
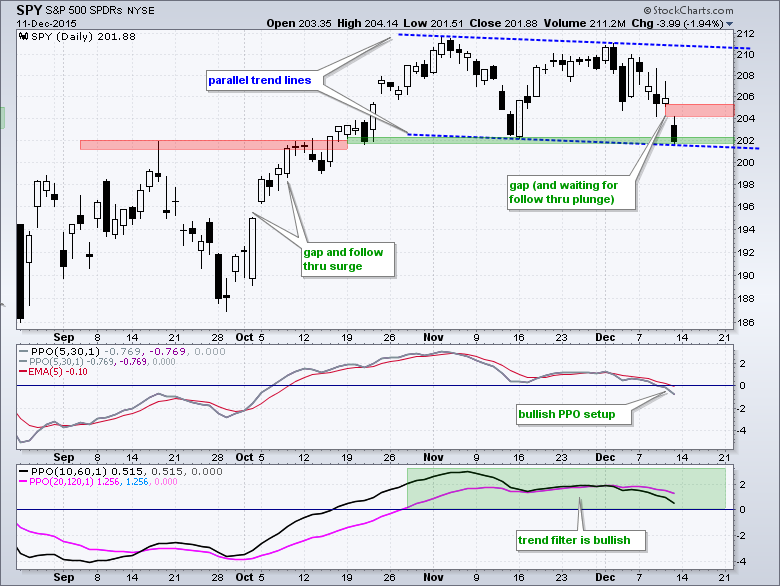
Technical analysis is not always black and white because there is often something out there to color the picture gray. Sorry about that. Namely, large-caps are still holding up relatively well. As noted on Saturday, the S&P 500 %Above 200-day EMA (!GT200SPX) and the Nasdaq 100 %Above 200-day EMA (!GT200SPX) did not break below 40% to turn bearish. In addition, the weekly trend indicators are still net positive for the S&P 500 (2 of 3) and the Nasdaq 100 (3 of 3). The medium-term PPO (10,60,1) and long-term PPO (20,120,1) are also positive for both, which means the long-term trend filter remains bullish. The PPO indicators lag because they are based on exponential moving averages, but will turn negative if weakness persists and we see downside follow thru to Friday's gaps. As the SPY chart below shows, the ETF closed right near the support zone that extends back to March 2015 and the ETF is around 5% from its all time high.
Seasonal Patterns Point to Bottom This Week
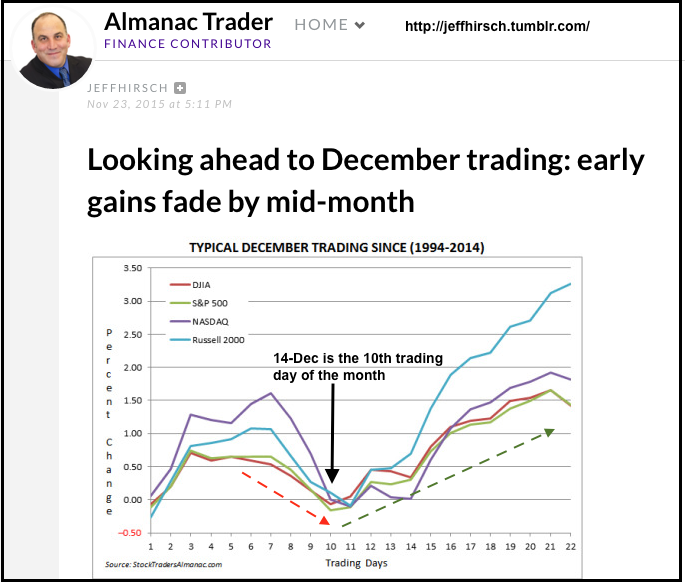
There are also some seasonal issues to keep in mind. The seasonal pattern turns bullish this week and the market has a strong bullish bias until yearend. While I know trends trump seasonal patterns, I think short-term traders should keep them in mind, especially when the trend indicators are still positive for SPY-QQQ and they are short-term oversold. As far as seasonality is concerned, today is the 10th trading day of the month and this is when the stock market typically troughs. Also note that December's option expiration week also has a strong bullish bias (page 78 of the Stock Trader's Almanac). This tidbit and the chart below come from Jeff Hirsch himself. As Hirsch notes, however, the options expiration week was negative in December 2011 (European debt crisis) and December 2012 (fiscal cliff crisis). Today we seem to have oil-junk bond crisis weighing on the broader market.
Mind the Gap and Short-term Downtrend
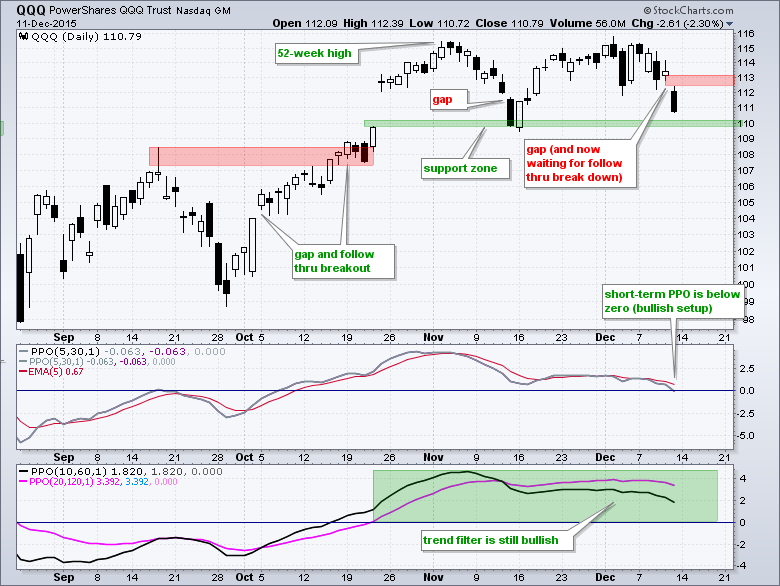
Turning to the charts, SPY and QQQ are short-term oversold and the PPO strategy has a bullish setup. A bullish setup occurs when the medium-term and long-term PPOs are positive (trend filter bullish) and the short-term PPO dips into negative territory to signal a short-term pullback. This strategy does not consider options expiration, Fed weeks, sentiment or news. It is pure price.
SPY is just below its November low and QQQ is just above its November low. IWM is also oversold, but the trend filter is bearish so it is ruled out for a short-term bullish trade. QQQ is the strongest of the three and remains in an uptrend overall. Friday's gap is negative, just as the October 5th gap was positive. Notice that the October 5th gap held and QQQ did not dip back below 104. Friday's gap is negative and the gap zone is the first level to watch for signs that support will ultimately hold.
SPY closed below the November low, but within the realm of a support zone. The December decline and gap clearly make for a short-term downtrend, as does the negative PPO (5,30,1). As with QQQ, Friday's gap is the first level to watch for signs of a rebound. A strong gap should hold and a weak gap will fold. A bullish signal line cross in the PPO (5,30,1) would also signal a reversal of the short-term downtrend.
****************************************
Thanks for tuning in and have a good day!
--Arthur Hill CMT
*****************************************


