Small-caps and Large-techs Lead Lower // SPY Fails to Follow Through // QQQ Nears 52-week Low // Dragonfly Doji versus the Hammer // Between a Huge Rock and a Hard Place (FDN, SMH, IGV, SKYY, IGN, XBI, ITB, KRE) ////
QQQ and IWM Lead Lower
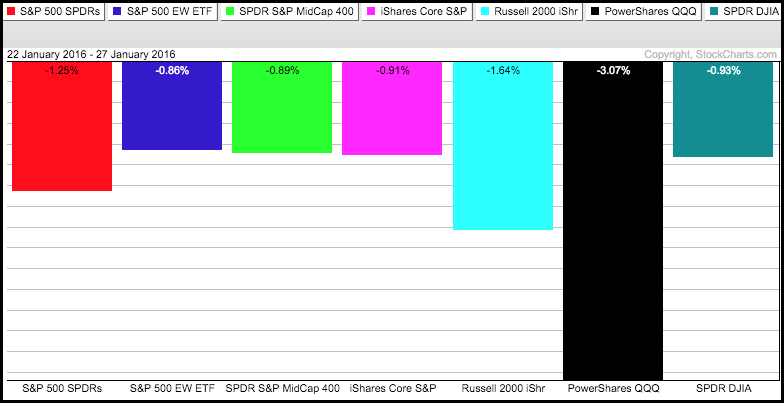
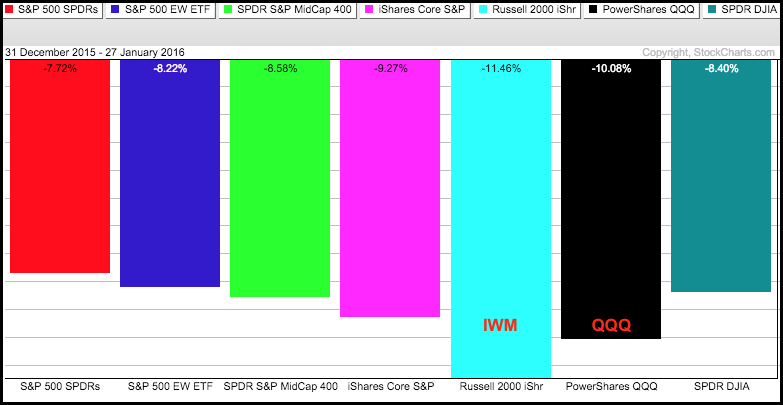
Last week's hammers remain on the weekly charts for SPY, QQQ and IWM, but we have yet to see follow through. All three need follow through and a break above the hammer highs to confirm a short-term reversal in the stock market. Before looking at the individual charts, notice that QQQ is having an extremely difficult week and leading the market lower. SPY is down around 1.25% this week, IWM is down 1.64% and QQQ is down 3.07%. Small-caps and large-techs are leading lower this week. The second chart shows year-to-date performance with IWM and QQQ leading lower. These two represent the high beta end of the stock market and relative weakness reflects risk aversion in the stock market.
SPY Fails to Follow Through
Candlesticks show us the open, high, low and close, and make it possible to spot potential reversal days or weeks. "Potential" is the key word here. Close-only charts, on the other hand, ignore the open, high and low by plotting just one price: the daily close or the weekly close. The close is definitely the most important of the four price points. The next three charts will show both versions for comparison. SPY formed a hammer last week and moved above the hammer high during the day on Wednesday, but fell back by the close and has yet to confirm this short-term candlestick reversal pattern. The green ovals point out some other bullish reversal weeks. SPY follow up on the October-2014 hammer with a big advance to make it a 3-week reversal. There was no follow thru to the August harami and the ETF followed up the September hammer with a gap and surge to 200 in early October. I am calling this a quasi-hammer because the lower shadow is on the short side (relative to the body). Last week's hammer features an extremely long lower shadow and small body at the top.
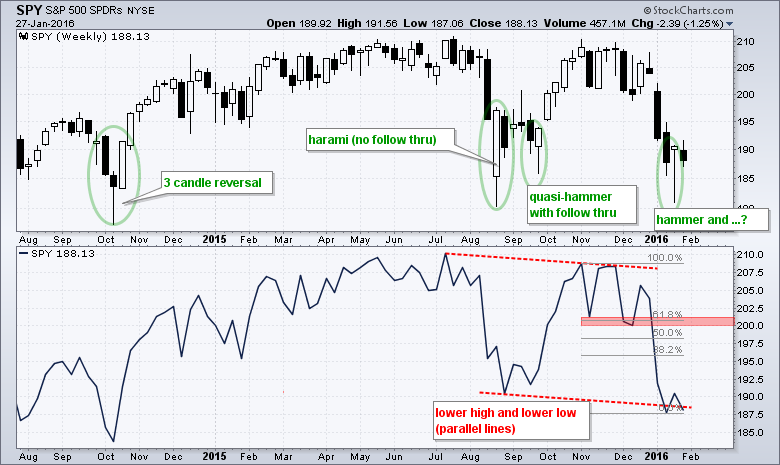
The close only chart shows a clear downtrend with a lower high and lower low over the last six months. The red trend lines are parallel and current prices are near the lower trend line. I would not call this a hard support level. Actually, I would not label it support at all because the overall trend is clearly down. This means any bounce would still be considered a counter-trend move and expected to fall short. Should SPY get an oversold bounce, I would continue to mark first resistance near broken support (~200). This area also marks a 61.8% retracement of the prior decline.
QQQ Nears 52-week Low
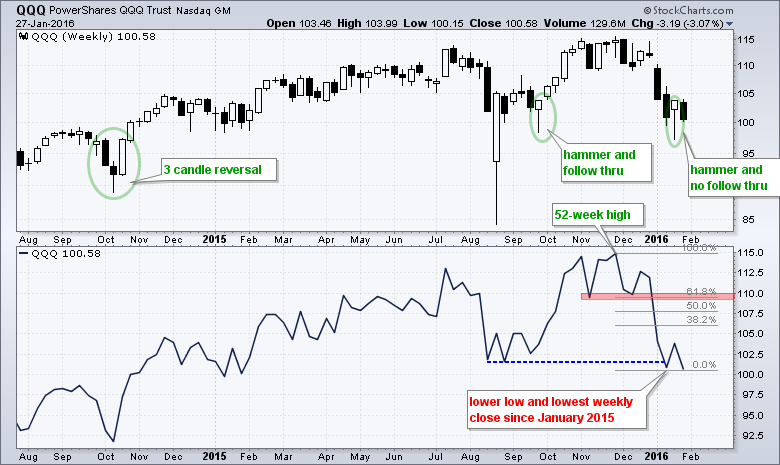
QQQ formed a nice hammer last week, but did not follow through and fell back to the 100 area this week. A close above 104 is needed to suggest follow through and confirm the hammer. Should the ETF get an oversold bounce, I would mark first resistance in the 109 area (broken support and the 61.8% retracement). On the close-only chart, QQQ went from a 12-month high to an 11-month low. On a closing basis, the ETF is less than 2% from a 12-month (52-week low).
Dragonfly Doji versus the Hammer
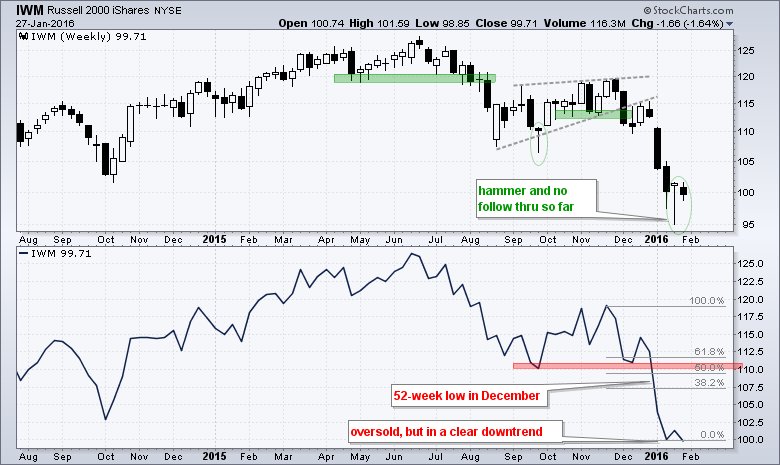
IWM formed a hammer that could also be interpreted as a dragonfly doji. A doji forms when the open and close are equal or almost equal. A dragonfly doji is a doji with a long lower shadow (low) and no upper shadow (high). This means the open and close are at the high. The doji signals indecision and the lower low shadow indicates a reversal during the day or week. As with the hammer, follow through it required to consider this a bullish pattern. A hammer without follow through is like a coke without fizz. A close above last week's high is needed for follow through. We therefore have three closing levels to watch this week. Adding a small buffer, IWM needs to close above 102, QQQ needs to close above 104 and SPY needs to close above 191. Barring hammer confirmations, this is just a stall after a sharp decline and we could see another shoe drop.
Between a Huge Rock and a Hard Place
(FDN, SMH, IGV, SKYY, IGN, XBI, ITB, KRE)
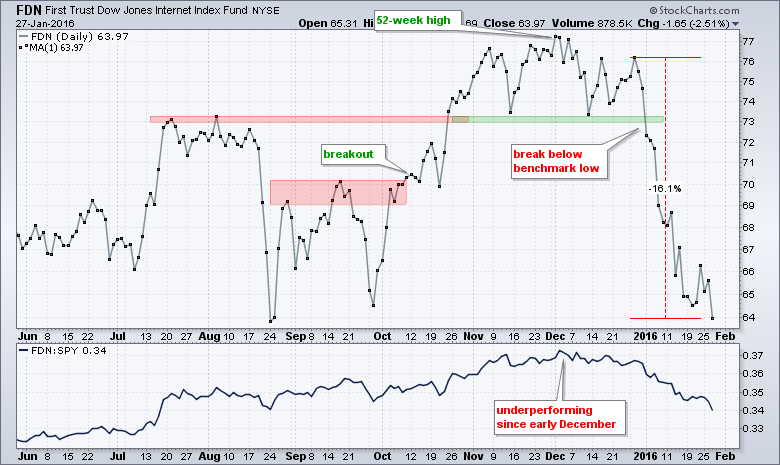
Many ETFs are currently between a huge rock (long-term downtrend) and a smaller hard place (short-term oversold). Take the Internet ETF (FDN) for example. This ETF was leading the market with a new high in early December and in a clear uptrend. The ETF stalled from November to late December and broke down on the first trading day of 2016. Notice that the ETF fell around 16% from the late December high to yesterday lows (19 trading days). The long-term trend is clearly down after the breakdown and steep decline, but the ETF is very oversold after a 16% decline in four weeks. Even though FDN is ripe for an oversold bounce, the bigger downtrend holds more sway and this makes it difficult to time a counter-trend move. Notice that the ETF was oversold at 68 and 66 as well, and still went to 64. The combination of a long-term downtrend and short-term oversold conditions makes this a very precarious time for the stock market.
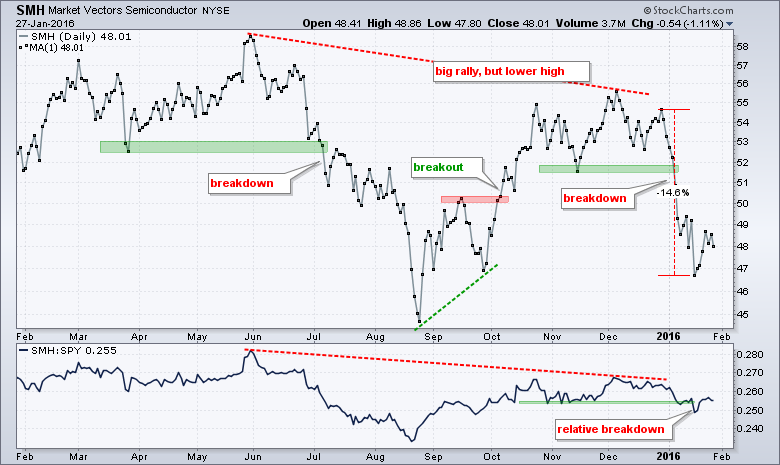
The Semiconductor ETF (SMH) broke down in early July and hit a new low in August. There was a big advance into early December, but the ETF ultimately formed a lower high and broke down in early January. SMH fell around 15% in a few weeks and got a small oversold bounce last week. The bigger downtrend is the dominant force at work here and the ETF is no longer short-term oversold.
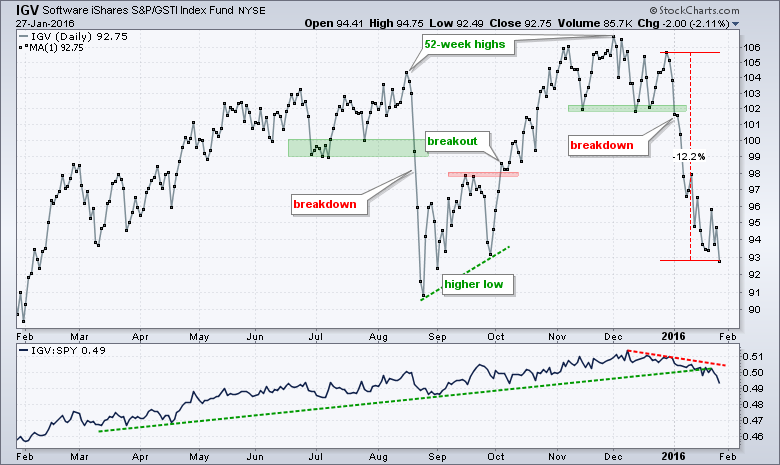
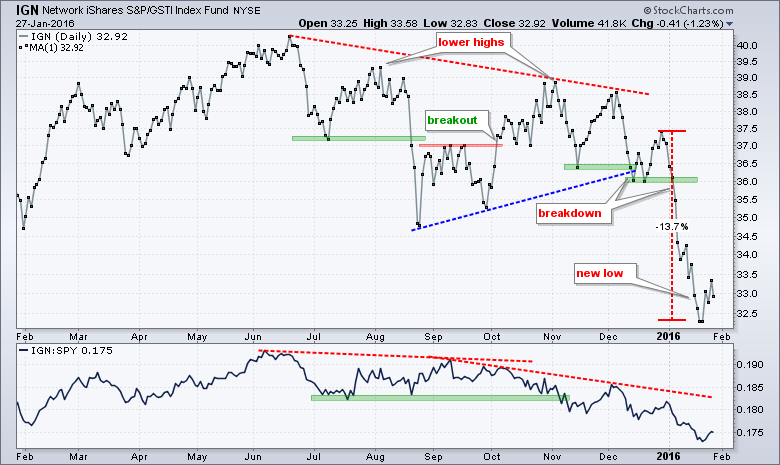
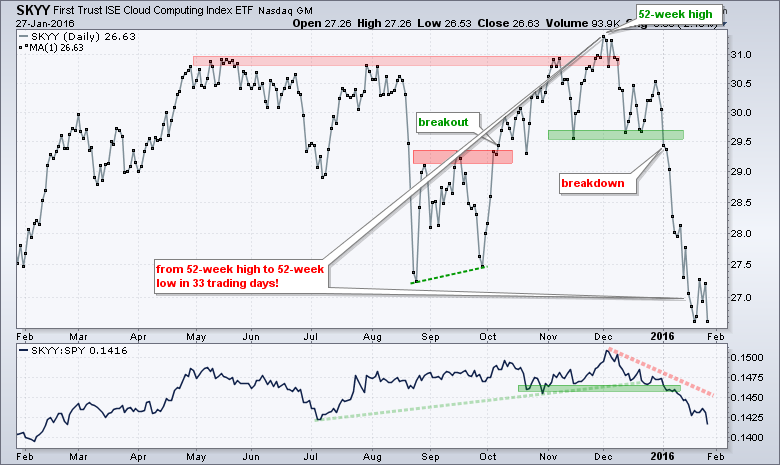
The charts for the Software iShares (IGV), Networking iShares (IGN) and Cloud Computing ETF (SKYY) show long-term downtrends and short-term oversold conditions. Bottom line: there is pervasive weakness throughout the technology sector.
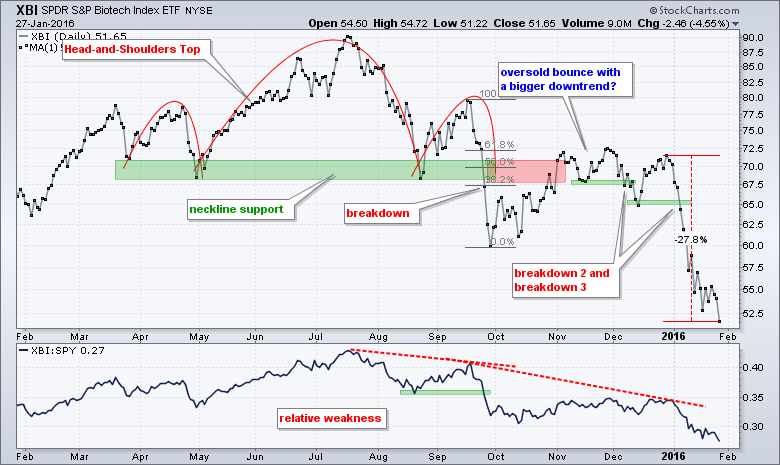
The Biotech SPDR (XBI) is down over 25% in the last 16 days and very oversold short-term. The long-term trend, however, is clearly down with a head-and-shoulders break in September, another lower high in November and 52-week lows in January.
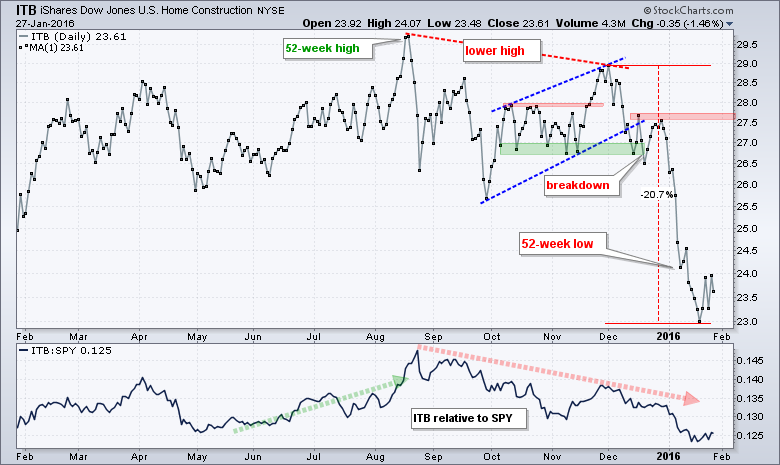
The Home Construction iShares (ITB) fell 20% from early December to mid January. After the lower high in early December, the first breakdown occurred in late December and the second in early January. ITB is in a long-term downtrend and short-term oversold. The ETF has shows a little relative strength the last five days, but only enough for an oversold bounce, not a long-term trend reversal.
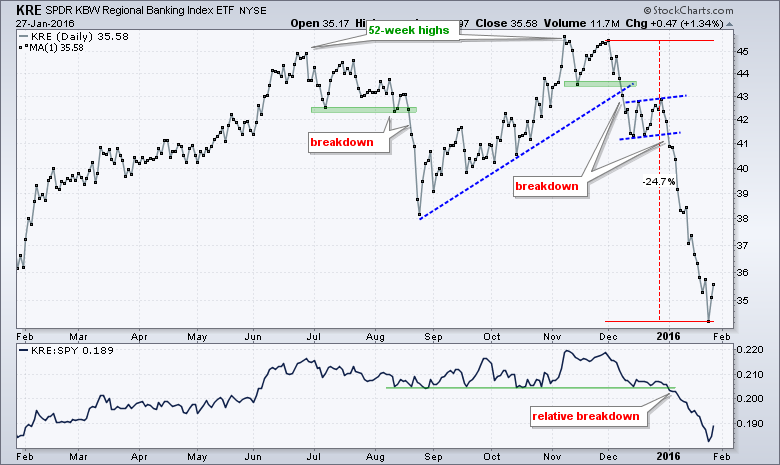
The Regional Bank SPDR (KRE) broke down in early December, formed a flag into early January and broke down again on January 4th. The ETF went from a 52-week high to a 52-week low in 50 trading days and fell around 25% in less than two months. The long-term trend is clearly down, but the ETF is very oversold short-term.
Other Commentary Links
Bear Market Bounces - Understanding Bear Market Patterns, Signals and Retracements.
Measuring Risk On-Risk Off - Using charts to quantify stock, economic and credit risk.
PPO Trading Strategy - How to use 3 PPOs to develop a trend-reversion trading strategy.
Long-term Trend Indicators - Using the PPO, EMA Slope and CCI to determine the trend.
ETF Master ChartPack - 300+ ETFs organized in a Master ChartList and in individual groups.
Follow me on Twitter @arthurhill - Keep up with my 140 character commentaries.
****************************************
Thanks for tuning in and have a good day!
--Arthur Hill CMT
Plan your Trade and Trade your Plan
*****************************************
