Hammers Still Hanging Around // The Weight of the Evidence is Clear // Correlations Rise in a Bear Market // Defensive Sector Performance in Prior Bear Market // Performance of Stock Alternatives in Prior Bear Market // Webinar Highlights ////
Hammers Still Hanging Around
There was no follow-through to last week's hammers as stocks fell back on Monday. The hammers, however, remain in play and we can expect a little extra volatility in the coming days. Note that the Fed starts its two-day meeting today and makes its policy statement on Wednesday afternoon. We are also in the middle of earnings season. I have no idea what the Fed will do or how the markets will react to the Fed, nor do I have a view on earnings. The long-term trends are down for the major stock indices, most sectors and most industry groups. This is the most important factor to consider right now. There will likely be an oversold bounce at some point, but any bounce would still be considered a counter-trend move. It could be sharp and extend 5-8% or be dull and flat.
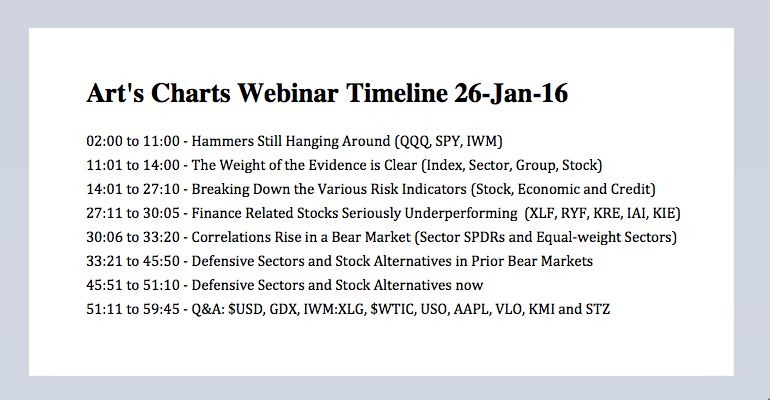
The first chart shows QQQ forming a hammer with a dip below 100 early in the week and a recovery back above 103 on Friday. Notice that QQQ has dipped below 100 ten times since December 2015 and closed below 100 just once on this weekly chart (January 2015). Even though QQQ fell back on Monday, last week's hammer affirms this level as a potential reversal zone and we could still see follow through. I am using the Friday-Monday highs to mark short-term resistance at 104. A break here could lead to an oversold bounce with the first target at broken support (~109). Note that some fruit company called Apple is reporting today after the close.
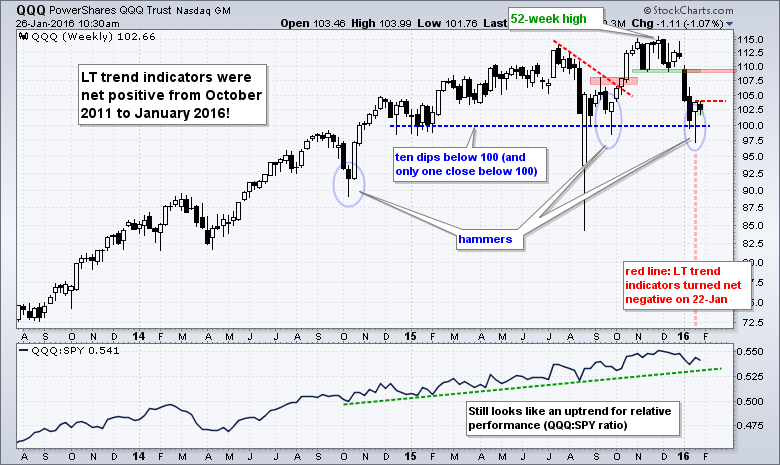
 The second chart shows SPY with a hammer last week and small decline so far this week. Notice that the high-low range last week was 9.74 points or around 5% of Friday's closing price. That is a very wide range for just one week and confirms the currently volatility. Hammers are single candlestick patterns that require confirmation with further upside. Even though SPY did not follow through on Monday, we now have a short-term resistance level to watch. A move above 191 would break Friday's high and provide the first sign of bullish confirmation. This would be enough to reverse the short-term downtrend, but certainly not enough to reverse the long-term downtrend. Broken support marks first resistance in the 200 area.
The Weight of the Evidence is Clear
Even if we get a bounce in the stock market, the bulk of the evidence indicates that we are in a bear market right now. There are numerous definitions for bear markets out there so perhaps I should weigh in with one. A bear market exists when the majority of stocks, broad stock indices and stock sectors are in long-term downtrends. This is a weight of the evidence approach that I prefer. Now we must quantify a long-term downtrend. We could use the price charts and look for lower lows and lower highs. We could use the classic moving average pairs, such as 50-day and 200-day. I am going to use my long-term trend indicators, which are shown on the weekly SPY chart above. These include the weekly PPO(5,52,1), the 5 week slope of the 52-week EMA and the 52-week CCI. The long-term trend is down when two of the three weekly indicators are negative and the long-term trend is up when two of the three are positive. Here is what we have right now:
- 10 of 10 Broad-Index ETFs are in downtrends
(DIA, IJR, IWC, IWM, MDY, OEF, QQEW, QQQ, RSP, SPY) - 14 of 18 Sector ETFs in downtrends
(XLU, XLP, RHS and RYU are in uptrends) - 48 of 50 Industry Groups ETFs in downtrends
(IHI and RTH are still in uptrends) - 1081 of 1500 S&P stocks are in long-term downtrends
(S&P 500, S&P MidCap 400, S&P Small-Cap 600)
The weight of the evidence has been bearish since the week ending January 8th. With a downtrend in place, it is a good time to review my general assumptions regarding trends. First, nobody knows how long these downtrends will last or how far they will extend. This basic concept goes back to Charles Dow and the Dow Theory. Second, the concept of support is inconsistent with the existence of a downtrend. In other words, lower lows are expected in a downtrend and prior lows are not expected to hold (offer support). There will be counter-trend bounces along the way, but playing them will be a challenge. And finally, cash really is a position in a bear market because we need dry powder for the next bull market.
Correlations Rise in a Bear Market
There is also a tendency for correlations of risk assets to rise during a bear market. A positive correlation means two assets move in the same direction. A negative correlation means two assets move in opposite directions. Even though the utilities sector is up year-to-date and showing negative correlation this year, this could change because utility stocks are still stocks (risk assets). When looking for alternatives to stocks, it is important to keep three things in mind: trend, relative performance and correlation (in that order). Even if something is outperforming, there is no sense considering a long position if it is in a downtrend and positively correlated to the S&P 500. The next charts will look at trend, relative performance and correlation for the defensive sectors and some stock alternatives during the bear market from 2000 to 2002.
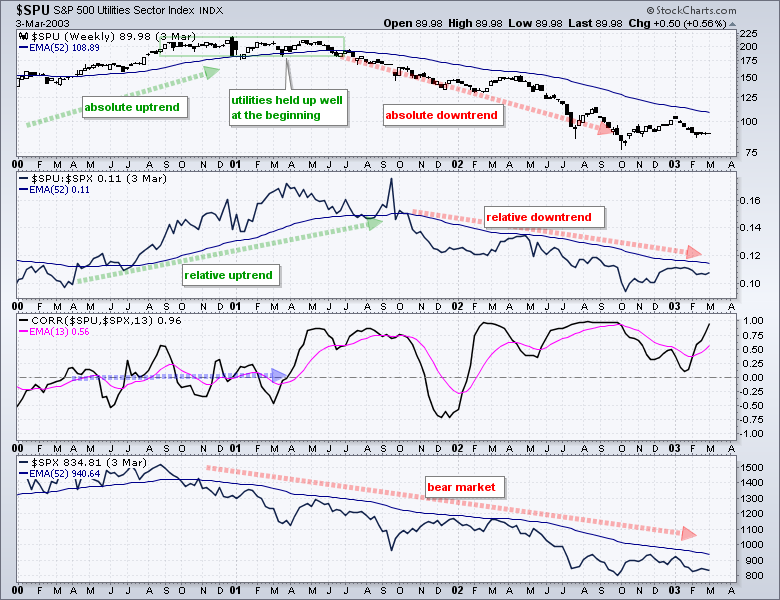
The S&P Utilities Sector ($SPU) was a viable defensive position from September 2000 until June 2001. Notice that the absolute trend was up, the relative trend was up and correlation was mixed. This all changed in the summer as the absolute trend turned down, the relative trend turned down and correlation rose. Overall, $SPU fell over 50% during this bear market.
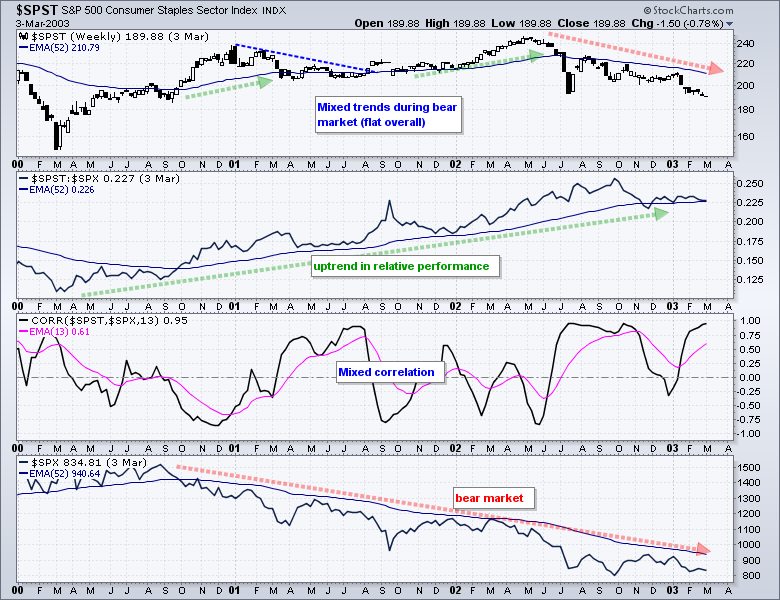
 The Consumer Staples Sector ($SPST) outperformed the S&P 500 during the bear market, but did not make much headway in absolute terms. The index began the bear market near 200 and ended the bear market near 200. Correlation was all over the place, but did turn mostly positive at the end of the bear market. Truth be told, it would have been better to sit in cash than carry the added risk of owning this defensive sector.
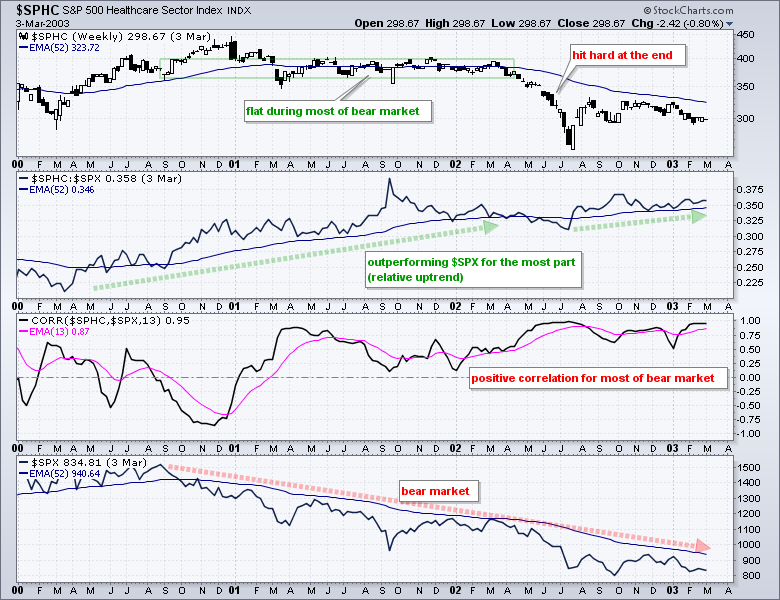
 The S&P HealthCare Sector ($SPHC) outperformed the S&P 500 for most of the bear market, but the absolute trend turned down in April 2002 and the sector ended with a sizable loss. Notice that correlation was positive from January 2001 until early 2003. Even though the relative trend was up and the sector held up from March 2001 until March 2002, correlation with the S&P 500 was positive and this is not a bullish trait in a bear market. Overall, $SPHC was down over 30% during the bear market.
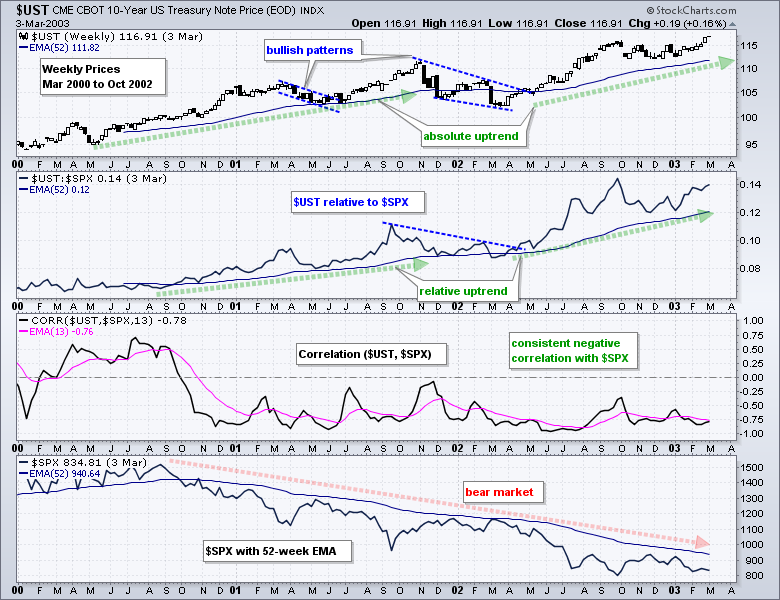
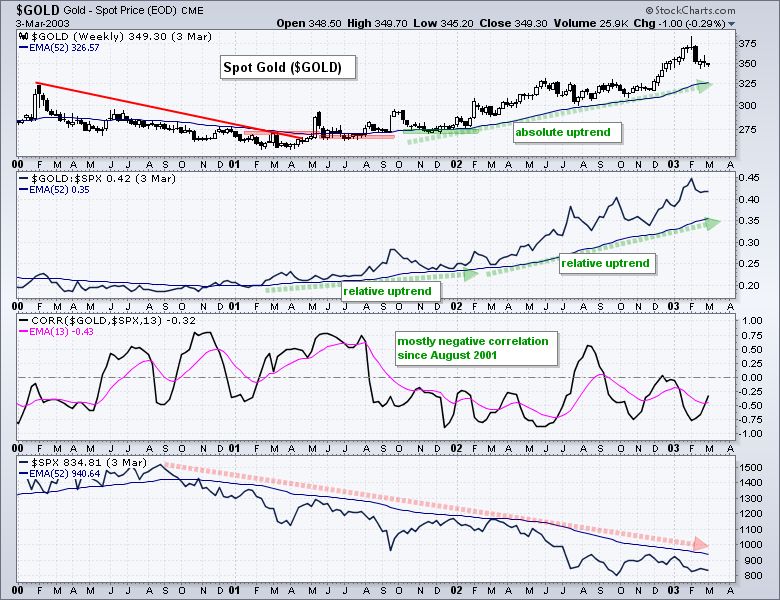
 The trend for the broad stock indices is the single most important factor for an individual stock, sector or industry group. Estimates vary, but most estimates suggest that over 80% of stocks participate in a bear market. This means your chances of picking a winning stock are less than 20% in a bear market. The only alternative to stocks is something that is not a stock (really!). The next three charts will look at the US Treasury Note ($UST), the Yen Index ($XJY) and Spot Gold ($GOLD) during the bear market from 2000 to 2002.
The US Treasury Note ($UST) is the natural alternative to stocks during a bear market and this is reflected in the chart below. The overall trend was up with a small correction in late 2001 and early 2002. The relative trend was also up for the most part as $UST outperformed $SPX during the bear market. The Correlation Coefficient ($UST,$SPX) turned negative in October 2000 and remained negative throughout the bear market. Thus, the three criteria for a bullish position during a bear market were met: absolute uptrend, relative uptrend and negative correlation.
 Spot Gold ($GOLD) did not perform well at the beginning of the bear market, but found its footing in April 2001 as the absolute trend turned up. This clarifies an important point, and perhaps the single most important point. The absolute trend is the single most important indication. The absolute trend trumps relative performance and correlation any day of the week. Gold was in an absolute downtrend until the spring-summer of 2001.
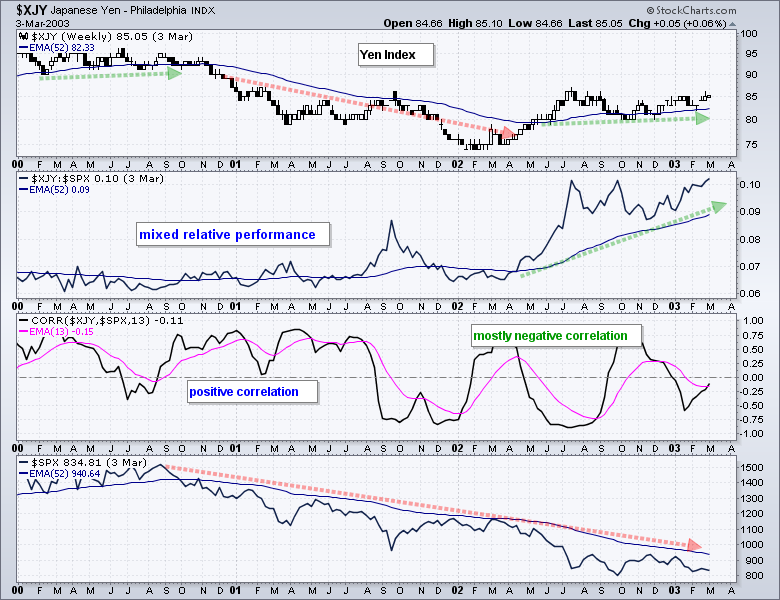
 The Yen Index ($XJY) was not a good stock alternative for most of the bear market. Notice that the absolute trend was down from November 2000 to May 2002. Relative performance was mixed until April 2002 when the price relative surged higher and the Yen started outperforming. Correlation also turned negative during this period, but did not stay negative for long. In short, the Yen was not a great alternative.
 I will look at these same charts for the bear market from October 2007 to March 2009 in today's webinar. I will also look at these charts as they stand today.
Webinar Highlights
In addition to the topics and charts above, I covered the following in the webinar on Tuesday, 26-January, at 1PM ET.
- Utilities, Healthcare, Staples, Yen, Gold and Bonds during the last Bear Market
- Breaking Down the Various Risk Indicators (Stock, Economic and Credit).
- Finance Related Stocks Seriously Underperforming
Click here to view the recording.
Links
Measuring Risk On-Off - Using charts to quantify stock, economic and credit risk.
PPO Trading Strategy - How to use 3 PPOs to develop a trend-reversion trading strategy.
Long-term Trend Indicators - Using the PPO, EMA Slope and CCI to determine the trend.
ETF Master ChartPack - 300+ ETFs organized in a Master ChartList and in individual groups.
Follow me on Twitter @arthurhill - Keep up with my 140 character commentaries.
****************************************
Thanks for tuning in and have a good day!
--Arthur Hill CMT
Plan your Trade and Trade your Plan
*****************************************


