Breadth Surge Falls Short of Bullish Signal // Another Gap to Mind // Stocks of Interest (CHKP, FB, SYK, UNH) ////
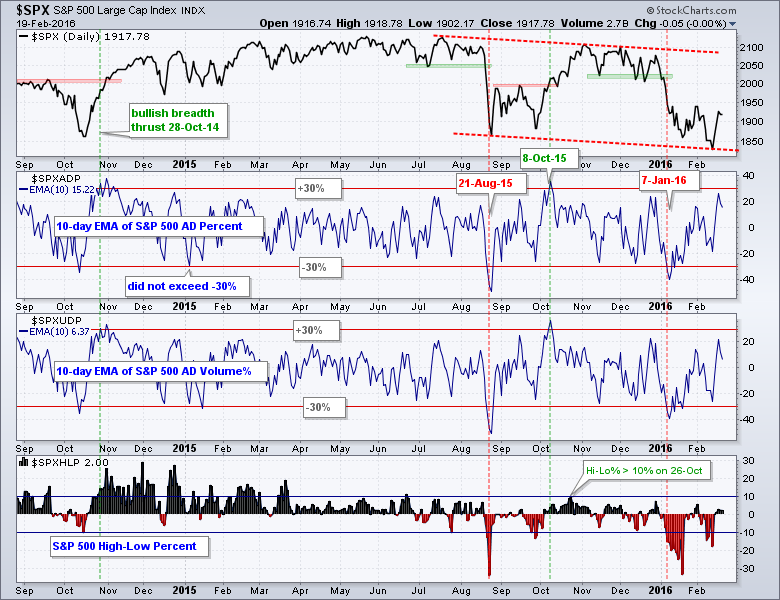
The long-term evidence remains bearish, but the short-term evidence turned bullish with the reversals and gaps in mid February. As noted in Friday's commentary, I use a three-prong approach to distinguish between bull and bear markets. These include basic trend analysis for the major stock indices, breadth and the risk environment. The weight of the evidence turned bearish on January 7th and I have yet to get a counter signal. The first chart shows an example using the S&P 500 with three breadth indicators. The index formed a lower high in November, broke support in early January and recorded a 52-week low in mid January (and again mid February). The big trend is clearly down. The 10-day EMAs for AD Percent and AD Volume Percent plunged below -30% to turn bearish on January 7th. These two now need to exceed +30% to show strong enough buying pressure to turn bullish again. High-Low Percent plunged below -10% on January 7th and needs to exceed +10% to turn bullish again. At the very least, the S&P 500 needs a strong close above 1950 AND the 10-day EMAs for AD Percent and AD Volume Percent need to exceed +30% before I consider reversing my bear market call. Note that I analyze these breadth metrics for the S&P MidCap 400, S&P Small-Cap 600, Nasdaq 100 and S&P 1500 as well. Simply substitute $SPX for the index symbol to change the breadth indicator. For example, $SPXADP becomes $MIDADP for S&P MidCap 400 AD Percent.
With the long-term evidence still bearish, the short-term advance is viewed as a bear market rally. As with any trend, I never know how far it will extend or how long it will last. Note that all bull markets begin with a short-term uptrend, but not all short-term uptrends result in bull markets. I can estimate resistance levels using prior support breaks and prior peaks. I can also estimate reversal zones using the Fibonacci Retracements Tool. The short-term trend, even though it is short-term, is still more important than a resistance or reversal zones. In other words, I need a bearish signal or some sort of reversal before turning short-term bearish again.
Another Gap to Mind
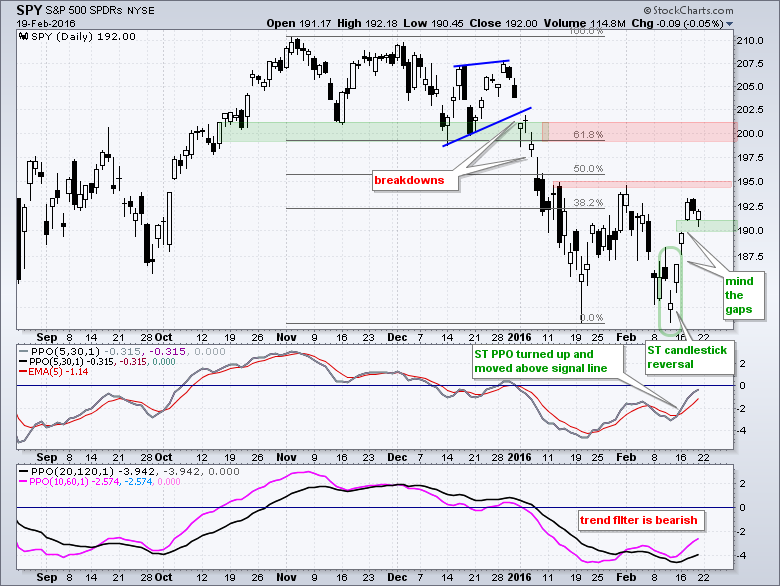
On the SPY chart, I see resistance coming into play in the 195 area from the prior peak and in the 200 area from the 61.8% retracement and broken support zone. Despite these resistance zones, the short-term trend is clearly up after the 3-candlestick reversal and gap above 187.5. There is now a second gap in the 190 area that is holding. Actually, there are three gaps and three 1+ percent advances over the last five days. Even though this surge is not enough to affect the long-term situation, it shows some serious short-term strength. Also notice that the short-term PPO (5,30,5) is rising and above its signal line. There are two things I would watch for a short-term trend reversal. First, a close below 189.7 would fill the last gap. Second, a bearish signal line crossover in the PPO (5,30,5) would signal a downturn in price.
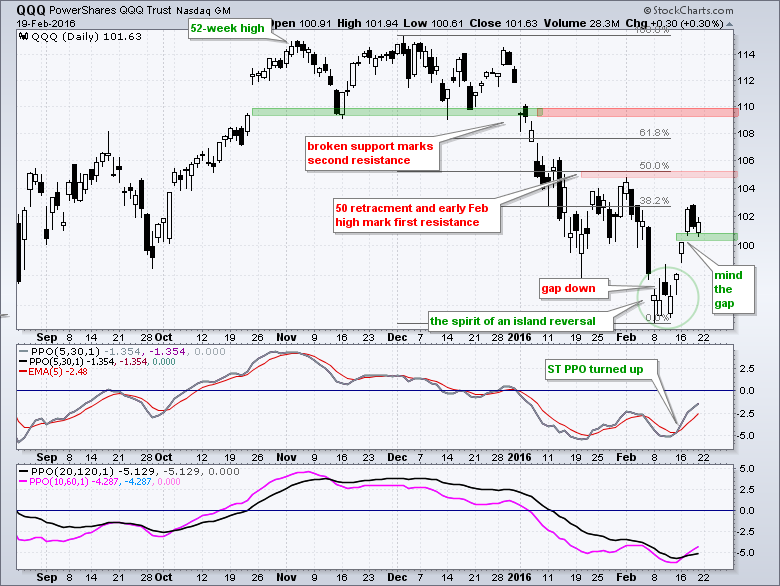
The QQQ chart shows first resistance in the 105 area and second resistance in the 110 area. QQQ gapped up again on Thursday and this gap is holding. A close below 100 would clearly fill the gap and reverse the short-term uptrend. Chartists can also watch for a bearish signal line crossover in the short-term PPO (5,30,5).
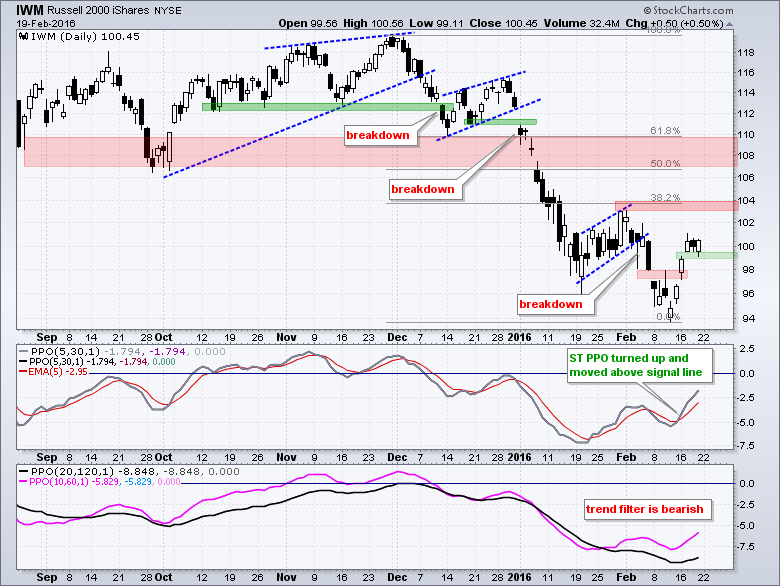
First resistance for IWM is set in the 104 area and second resistance in the 108-110 area. A close below 98.5 would fill the gap and chartists can also watch for a bearish signal line crossover in the short-term PPO (5,30,5).
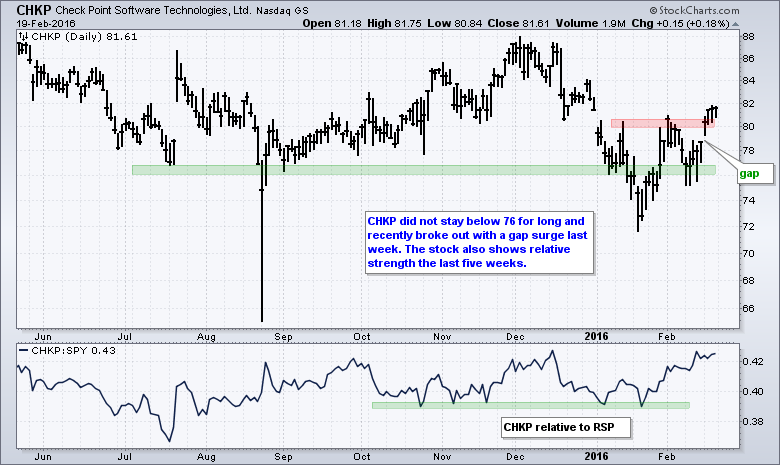
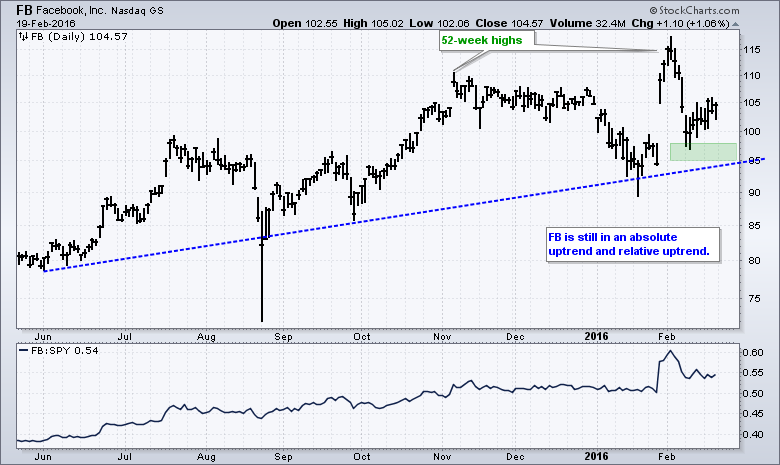
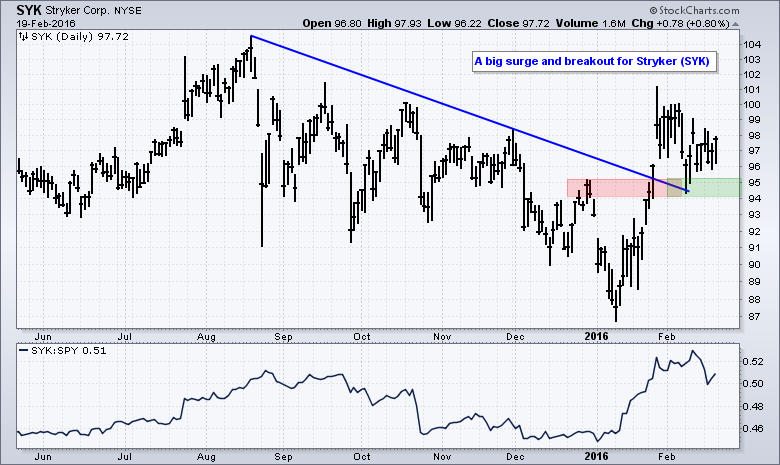
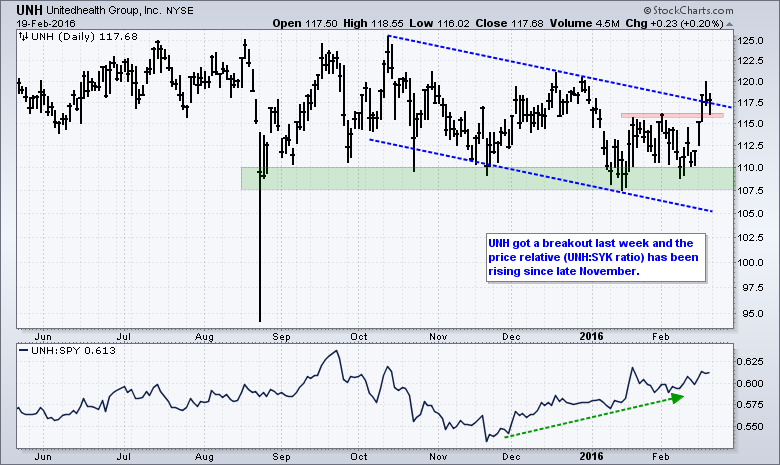
Stocks of Interests
Other Commentary Links
Bear Market Bounces - Understanding Bear Market Patterns, Signals and Retracements.
Measuring Risk On-Risk Off - Using charts to quantify stock, economic and credit risk.
PPO Trading Strategy - How to use 3 PPOs to develop a trend-reversion trading strategy.
Long-term Trend Indicators - Using the PPO, EMA Slope and CCI to determine the trend.
ETF Master ChartPack - 300+ ETFs organized in a Master ChartList and in individual groups.
Follow me on Twitter @arthurhill - Keep up with my 140 character commentaries.
****************************************
Thanks for tuning in and have a good day!
--Arthur Hill CMT
Plan your Trade and Trade your Plan
*****************************************


