Three Prong Approach // Major Index Trends Remain Down // Breadth Indicators remain Net Bearish // Some Risk Indicators Stabilize, but have yet to Turn Up // Staples and Utilities Still Holding Up // XLP Struggles since Market Peak // XLU Benefits from Two Negative Correlations // A Bounce within a Downtrend for XLU // XLK Battles Support with Bullish Candlesticks // Long-term Trend Turns Up for Gold // Early Bird or Second Mouse // Gold versus Gold Miners // Friday Food for Thought ////
Three Prong Approach
As a whole, the stock market has many moving parts so it is important not to become fixated on one indicator or one signal. I favor a weight of the evidence approach using three indicator groups: the major index trends, broad market breadth and the risk environment. A bear market exists when the long-term trends are down for the major stock indices. This downtrend is reinforced when breadth is bearish and the risk indicators point to risk aversion. Ideally, all three groups should be on the same page (bullish or bearish). Right now, the long-term trends are down for the major index ETFs, the breadth indicators are bearish and the risk indicators show risk aversion (risk off). The weight of the evidence has been bearish since January 7th and remains so.
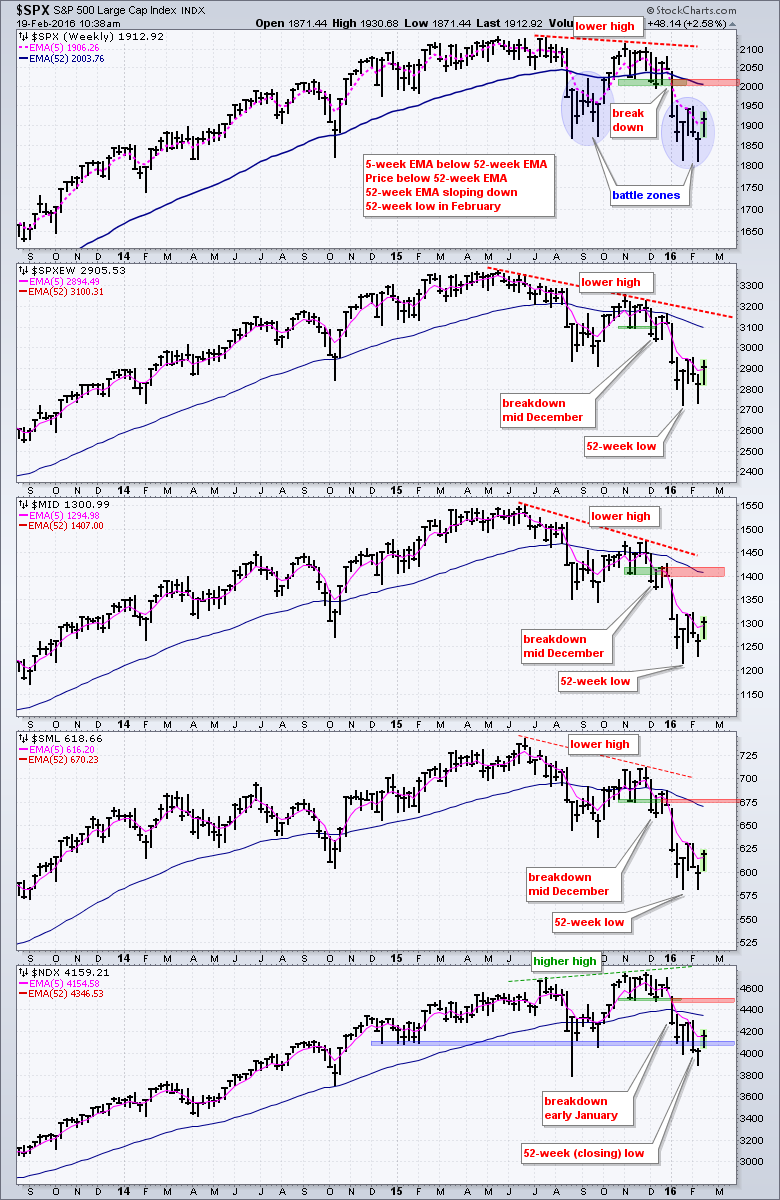
Major Index Trends Remain Down
Let's start with the trend for the major stock indices. The S&P 500 formed a lower high and broke down in early January with a sharp decline below 2000. The index has since turned volatile around the 1900 area by crossing this level five times in the last seven weeks (2016). This battle zone looks similar to the choppy range from mid August to early October 2015. In any case, the trend evidence is clearly bearish because the 5-week EMA is below the 52-week EMA, price is below the 52-week EMA and the 52-week EMA is pointing down. We can also throw in a lower high in November and a lower low in February. I could mark resistance around 1950, but I prefer to mark the first really important level in the 2000 area. The downtrends are more pronounced for the S&P 500 EW Index, the S&P MidCap 400 and the S&P Small-Cap 600. Notice that they broke down in mid December and recorded new lows in early January. The Nasdaq 100 is holding up the best, but it too recorded a 52-week closing low this month.
Breadth Indicators remain Net Bearish
I wrote a detailed commentary on breadth indicators yesterday (Thursday, 18-Feb) and these indicators remain bearish. Today I will just show the 10-day EMAs for AD Percent for the major stock indices. I am using 10 days because a trend reversal requires more than just a 3-day oversold bounce. Short covering and bargain hunting is enough to trigger a 3-5 day bounce. A bounce that extends two weeks with strong breadth suggests more than just short covering and bargain hunting. Basically, I am looking for a meaningful thrust that could signal the start of a bigger trend. A bullish thrust occurs when the 10-day EMA for AD Percent moves above +30% and a bearish thrust occurs when the indicator moves below -30%. Breadth turned bearish on January 7th when the 10-day EMA for S&P 1500 AD Percent ($SUPADP) plunged below -30%. The indicator surged over the last two weeks, but remains short of a bullish signal, which would require a move above +30%.
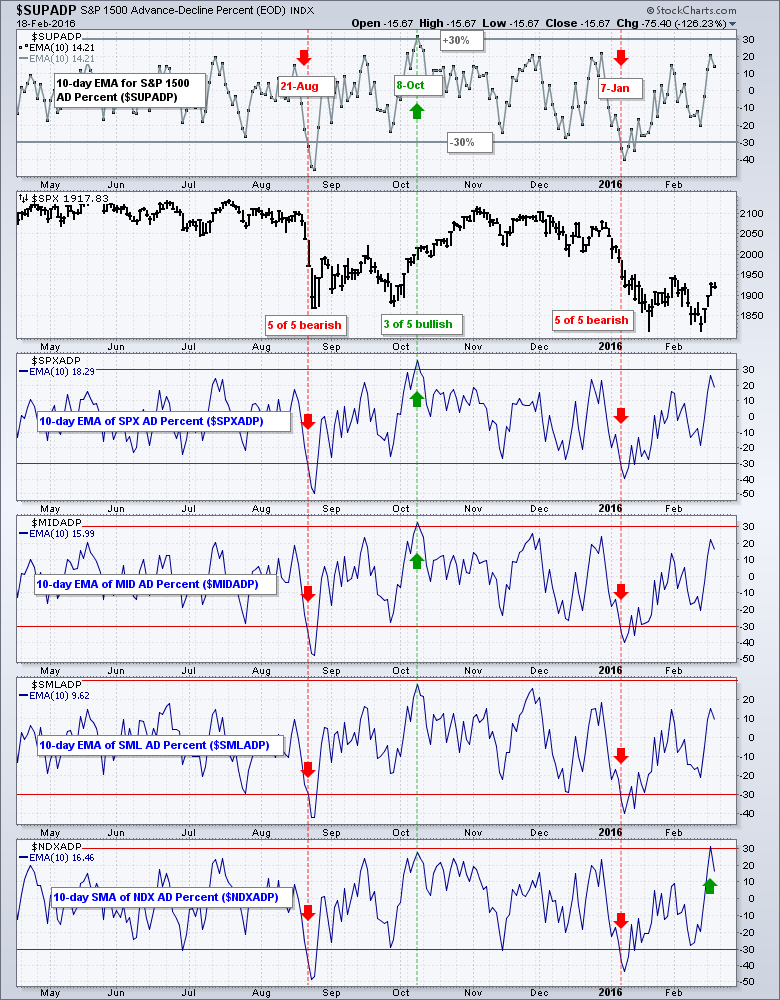
Looking at the other indices, we can see that three of four remain on bearish signals ($SPX, $MID, $SML). The 10-day EMA for Nasdaq 100 AD Percent ($NDXADP) moved above +30% to trigger a bullish signal. Note that this is the first time the indicator has been above +30% since February 2015. As the lone signal, this suggests more strength in the Nasdaq 100 than the other indices right now. The majority of indices, however, are still in bear mode and this keeps broad market breadth bearish. Also note that the weight of the evidence for AD Volume Percent and High-Low Percent is also bearish right now.
Some Risk Indicators Stabilize, but have yet to Turn Up
Despite an increase in risk appetite over the last four trading days, the risk environment remains negative for stocks overall. The chart below shows eight ratios to measure the risk appetite. The numerator represents the riskier asset (i.e. SPY) and the denominator represents the safer asset (i.e. IEF). The ratio rises when the riskier asset outperforms and falls when the safer asset outperforms. For example, stocks are still underperforming bonds as the SPY:IEF ratio trends lower. Four of these ratios are clearly trending lower and below their 50-day SMAs (pink lines). Four moved above their 50-day SMAs, but I would just call them flat at best because we have yet to see breakouts. The red annotations highlight risk-off status and the blue annotations highlight flattening ratios.
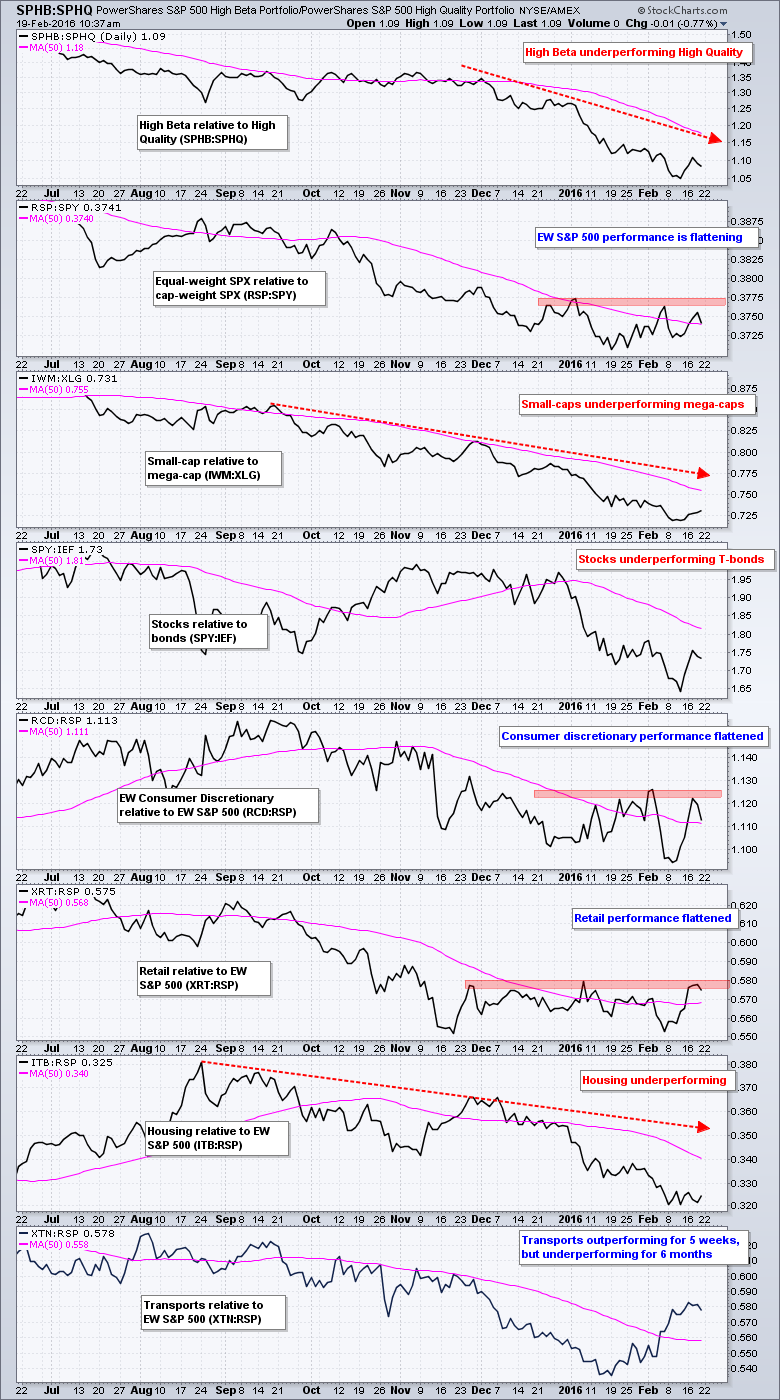
It is interesting to note that the Retail SPDR (XRT) and the EW Consumer Discretionary ETF (RCD) have stopped underperforming the EW S&P 500 ETF (RSP) recently. They have not, however, started outperforming because their ratios have yet to exceed an important high. Relative strength in retail, consumer discretionary and transports would be positive, but strength in these three alone would not be enough to turn the risk indicators net bullish (think weight of the evidence). We also need relative strength out of small-caps, junk bonds, housing and high beta stocks to really get bullish on the risk environment. Here is a link to a chart with some bond-related risk indicators.
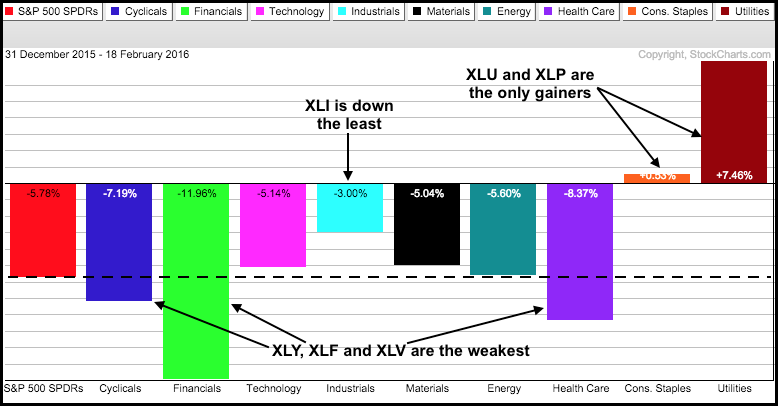
Staples and Utilities Still Holding Up
It has been a rough year for most of the stock market with seven of the nine sector SPDRs down year-to-date. The Consumer Staples SPDR (XLP) is up around .50% and the Utilities SPDR (XLU) is up an astounding 7.5%. Among the negative sectors, the Industrials SPDR (XLI) is holding up the best (down the least). The Technology SPDR (XLK), Energy SPDR (XLE) and Materials SPDR (XLB) are down slightly less than the S&P 500 SPDR (SPY) and showing a little relative strength this year. Even though the trends for XLU and XLP are still up, I would watch them closely because we are in a bear market environment and correlations can rise during bear markets. XLU and XLP still consist of stocks and could become vulnerable to the broad market trend.
XLP Struggles since Market Peak
The Consumer Staples SPDR (XLP) remains in an uptrend, but the going has gotten more difficult since July, which is when SPY peaked. Notice that XLP moved above 49 in early July and then plunged to the 45-46 area in August. The ETF moved back above 49 in October, but has little to show since first moving above 49 seven months ago. XLP closed at 50.76 on Thursday and is just 3.5% above the 49 level. It has been choppy trading the last few months and one must wonder if the ETF is worth holding when the broader market is in bear mode. As far as the uptrend is concerned, a close below 48 would argue for a reassessment. The indicator window shows the Correlation Coefficient (SPY,XLP) in positive territory, which means XLP and SPY tend to move in the same direction. The Correlation Coefficient is relatively low, but clearly not negative. This shows that XLP is not completely insulated from broad market moves.

Two Negative Correlations to Watch for XLU
In contrast to XLP and the other seven sector SPDRs, XLU has been negatively correlated to SPY, which means it has moved in the opposite direction of SPY. SPY is down sharply since late December and XLU is up. On the price chart XLU broke wedge resistance in mid December and channel resistance in late January. The January lows mark support in the 42-43 area.
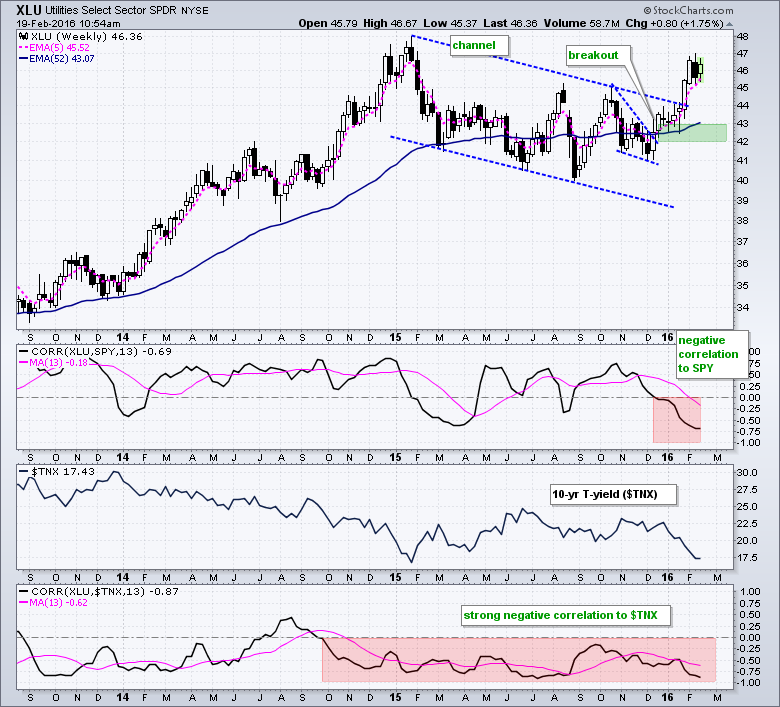
XLU is in good shape as long as it holds the breakout, continues to show relative strength and remains with a negative correlation to SPY. I would also watch the 10-YR Treasury Yield ($TNX) because XLU has an even stronger negative correlation with Treasury yields. Notice that the Correlation Coefficient ($TNX, XLU) has been negative since September 2014. This means XLU tends to rise when Treasury yields fall. A downtrend in $TNX, therefore, supports an uptrend in XLU.

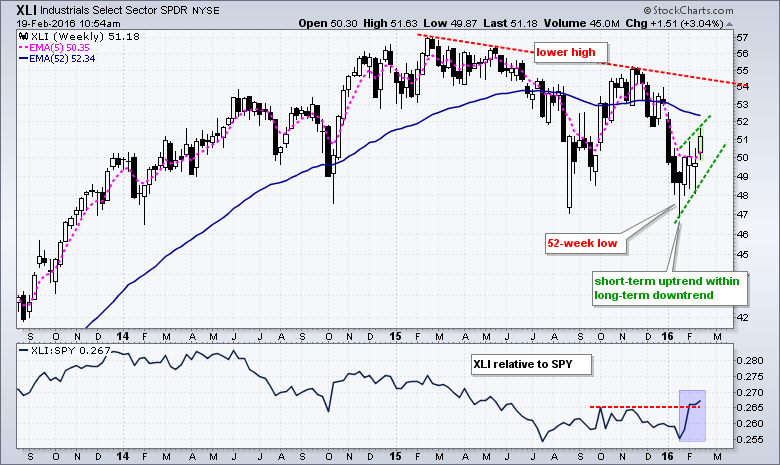
A Bounce within a Downtrend for XLI
The Industrials SPDR (XLI) got a nice bounce the last four weeks, but this bounce still pales relative to the prior decline (55 to 48). This short-term uptrend looks like a bear flag or wedge and a break below the lower trend line would signal a continuation lower. The indicator window shows the price relative (XLI:SPY ratio) breaking above its October high, but I cannot get too excited because the long-term trend on the price chart is down and we are in a bear market environment.
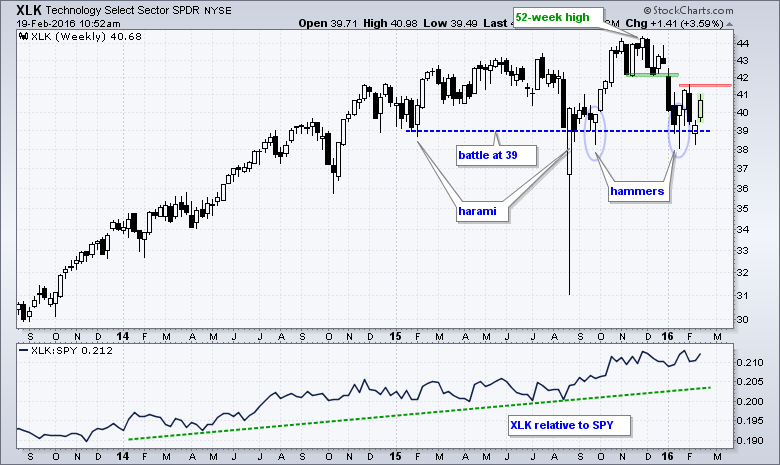
XLK Battles Support with Bullish Candlesticks
The Technology SPDR (XLK) is worth a close watch because it continues to battle the 39 level, much like QQQ is battling the 100 level. The ETF formed hammers at this level in September and January, as well as harami in February and August. Most recently, there is a three candlestick reversal over the last three weeks. A follow through breakout at 41.6 would suggest a successful support test and be bullish. The indicator window shows the price relative flattening over the last few months, but the overall trend is up as XLK continues to outperform SPY.
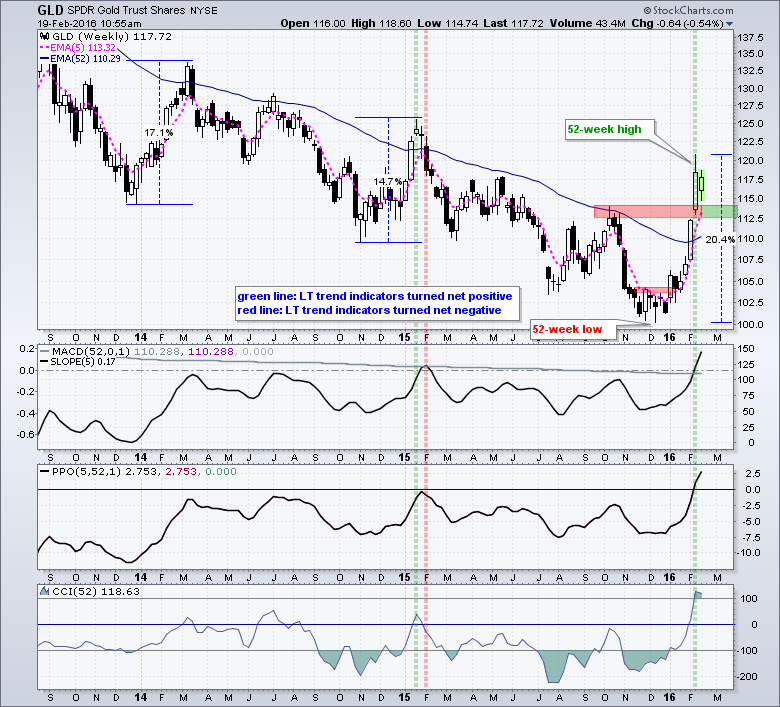
Long-term Trend Turns Up for Gold
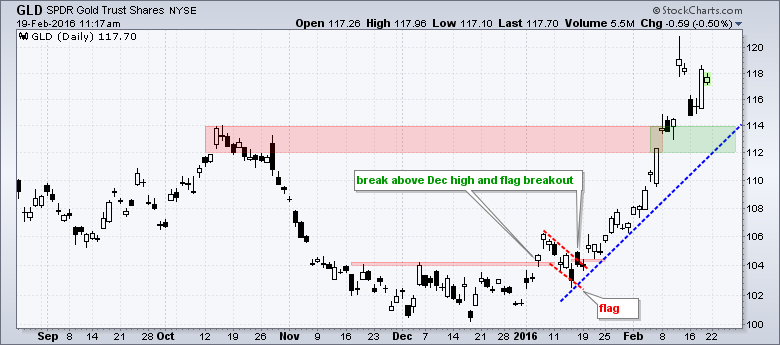
The Gold SPDR (GLD) exceeded its October high and the long-term trend indicators turned positive last week. This means gold is in a long-term uptrend. So now what? The last short-term signal for gold was the flag breakout in mid January. Note that this flag breakout was shown in Art's Charts on January 15th. GLD became overbought after a 20% advance from mid December to mid January and I am now waiting for the next short-term setup. I don't know when it will happen so I just have to wait and watch the chart. Broken resistance turns into first support in the 112-114 area. Perhaps a pullback to this area will provide a bullish setup.
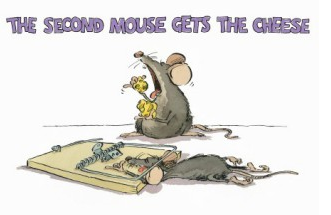
Early Bird or Second Mouse?
Are you and early bird or a second mouse? Most of us know the saying: the early bird gets the worm. In trading, we could suggest that bottom pickers get the best prices. Bottom picking, of course, is a risky endeavor because it usually means trading against the prevailing trend. The alternative anecdote would be: the second mouse gets the cheese. The GLD flag breakout in January was for the early bird and the gold how gotten quite extended. Second mice types are waiting for the pullback.
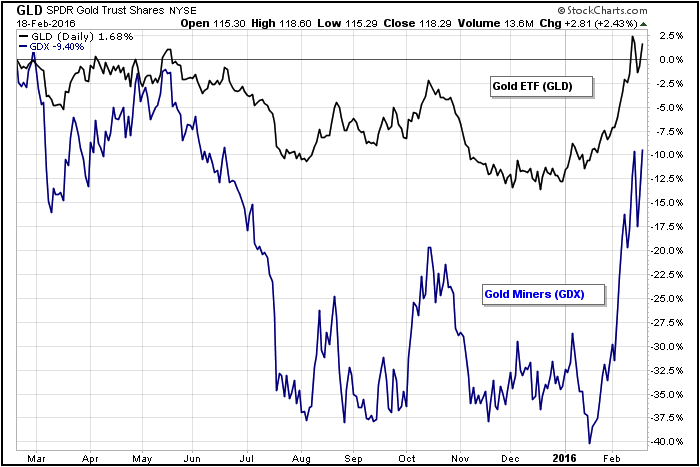
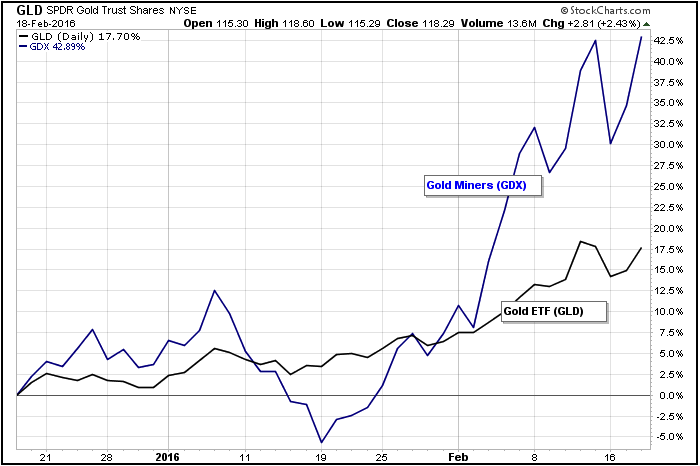
Gold versus Gold Miners
If you like gold and leverage, you do necessarily need to buy a leveraged gold ETF. Instead, you can just by the Gold Miners ETF (GDX). Note that I am not recommending GDX or GLD. I am just pointing out the relative volatility and risk. With a 17.5 advance the last two months, GLD is actually up over the past year and sporting a small gain. GDX is up over 40% the last two months, but the ETF is still down around 10% over the past year.
Friday Food for Thought
Silver Linings Playbook (Charlie Bilello, Pension Partners)
But what if the U.S. doesn’t enter a recession here? Yes, that is the question. Then the analysis becomes much more complicated. While there have been a number of bear markets without a recession (most recently in 2011), they tend to be shorter (average of 12 months) and shallower (average of 30%). With the median stock in the Russell 3000 already down 34% from its 52-week high, there’s no guarantee of significant further losses even if this is a non-recessionary Bear Market.
15 Best Practices Observed a Peak Performance Coach to Hedge Funds (Doug Hirschhorn, Edge Consulting LLC)
13) Making money is easy, keeping it is hard.
14) The market does not “owe” you anything.
15) H + W = P = E (Hoping + Wishing + Praying = Exit the Trade!)
Interview with Ed Borgato (Richard Chignell, The Pro's Process)
On the short side I look for the vulnerable or broken. I never short on valuation – leave it to the valuation dogmatists to waste time and money fighting momentum. I favor three-legged chairs that are destined to tip (and they’re not always expensive). However, I short fewer stocks than I used to. The landscape for shorting has gotten harder for a number of reasons, so I focus on fewer names.
Avoid Consensus Thinking plus 10 Rules Learned over 33 Years (Hedge Fund Intelligence, Bill Richards)
Everyone is bearish and everyone thinks we are heading into a recession. If you are thinking either of those right now, you are consensus thinking. On top of all that, everyone thinks the Federal Reserve got it wrong when they raised rates and that China is a mess. There is nothing unique or differentiated in these views of the world. They all would have been more helpful much earlier this year, but not now when everyone has them
Other Commentary Links
Bear Market Bounces - Understanding Bear Market Patterns, Signals and Retracements.
Measuring Risk On-Risk Off - Using charts to quantify stock, economic and credit risk.
PPO Trading Strategy - How to use 3 PPOs to develop a trend-reversion trading strategy.
Long-term Trend Indicators - Using the PPO, EMA Slope and CCI to determine the trend.
ETF Master ChartPack - 300+ ETFs organized in a Master ChartList and in individual groups.
Follow me on Twitter @arthurhill - Keep up with my 140 character commentaries.
****************************************
Thanks for tuning in and have a good day!
--Arthur Hill CMT
Plan your Trade and Trade your Plan
*****************************************


