Long-term Trend Trumps // Short-term Wedges Taking Shape // Key Ratio Charts Still Trending Lower // Smattering of New Highs // New Highs Concentrated in Three Groups // Relative and Absolute Uptrends // Webinar Highlights ////
Long-term Trend Trumps
Stocks firmed in mid January as the major index ETFs formed big hammers and we even saw some follow through last week. There is just one problem, and it is a big one. The big trends are down for the major stock indices and these downtrends are the dominant force. Short-term oversold conditions and hammers set the stage for a bounce and that bounce is now underway. This bounce, however, could become an uphill struggle with the downtrend adding a headwind. First, let's review the long-term bearish evidence. The S&P MidCap 400 and S&P Small-Cap 600 lead the way with significantly lower highs in November and breakdowns in mid December. The S&P 500 formed a slightly lower high in November and broke down in early January. The Nasdaq 100 held out with a higher high in November, but also broke support in early January. Also notice that the 5-week EMAs (pink) are all below the 52-week EMAs (blue) and three of the four 52-week EMAs are clearly pointing down. The 52-week EMA for the Nasdaq 100 did move lower over the last five weeks and its 52-week EMA is also tilting lower.
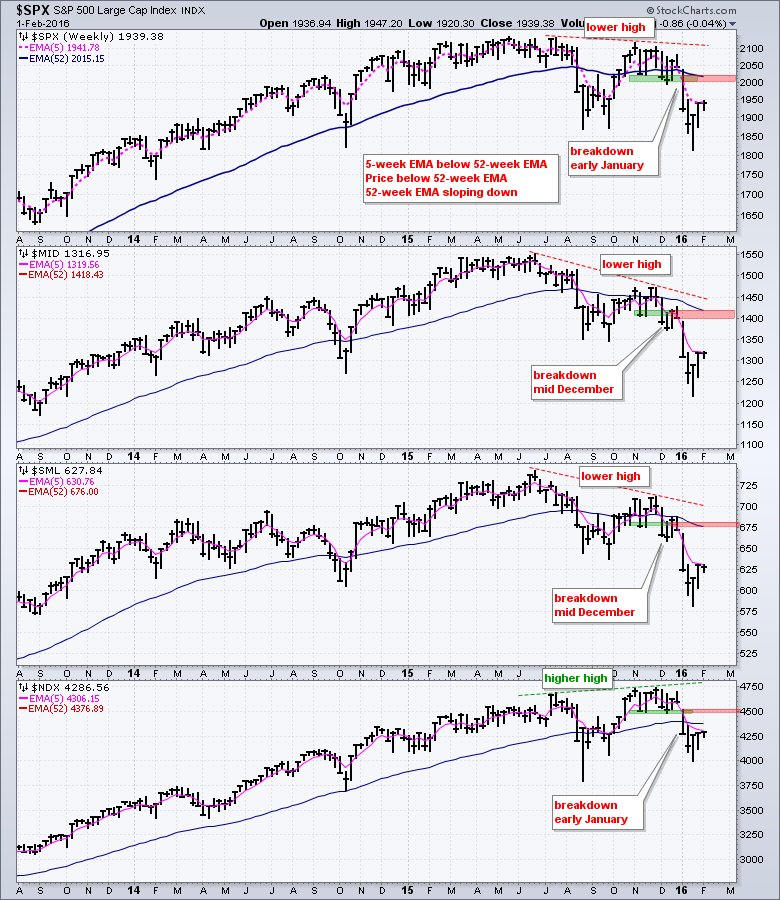
With the trends down and the evidence clearly bearish, I am not marking potential support levels because lower lows are expected in a downtrend. In other words, prior lows are not expected to hold in a downtrend. The red zones mark the first resistance levels to watch. Notice that broken support and the 52-week EMA mark first resistance for the S&P 500 in the 2000 area. I would not use these resistance levels as targets for an oversold bounce. Instead, chartists should reassess the downtrend if these indices break above these resistance levels.
Short-term Wedges Taking Shape
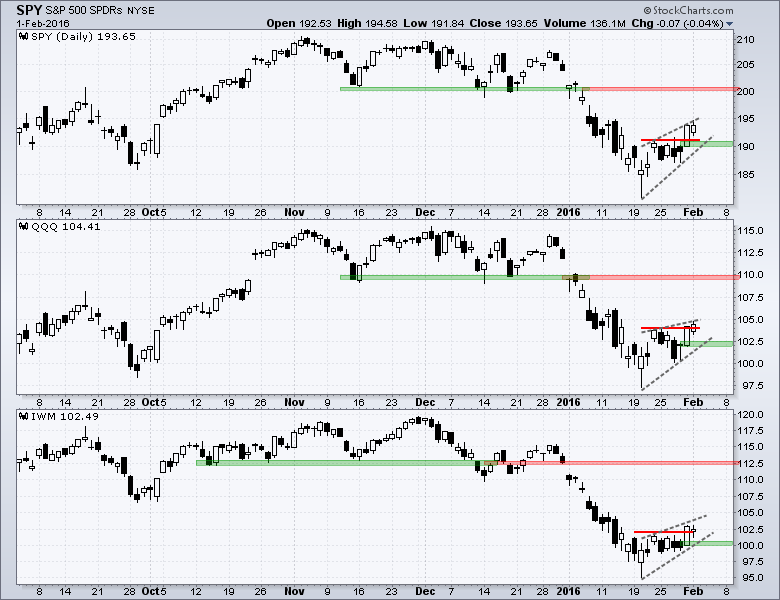
The next chart shows daily candlesticks for SPY, QQQ and IWM. Notice that this is the first oversold bounce since the January breakdown. All three broke above short-term resistance after the mid January hammers, but there was not much follow through on Monday. SPY and IWM were down a fraction, while QQQ was up a fraction and IWM. Overall, it is possible that rising wedges are taking shape. The short-term trend is up as long as these wedges rises. A close below Friday's low would negate last week's little breakout and break the wedge trend line. This would be the first sign that the oversold bounce is failing and the bigger downtrend is prevailing.
Key Ratio Charts Still Trending Lower
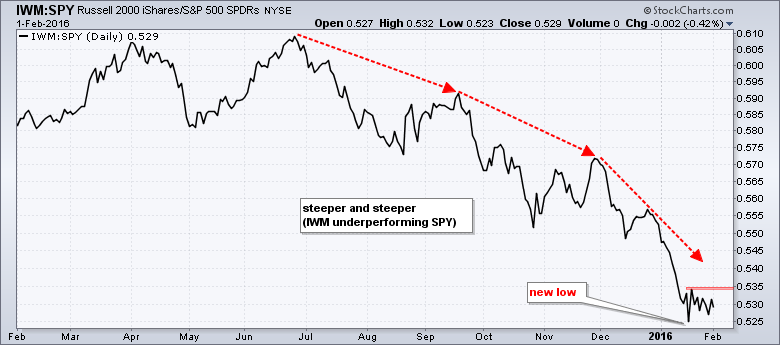
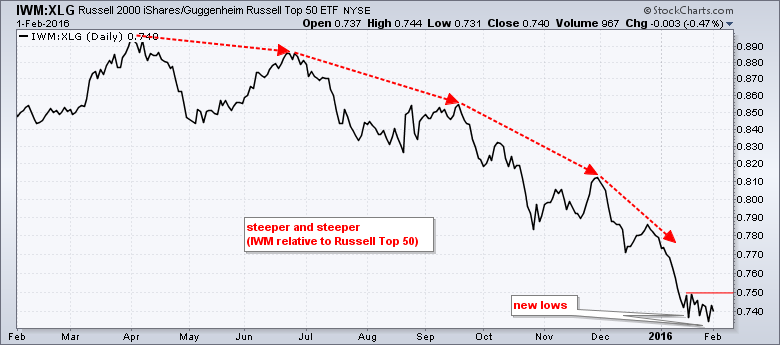
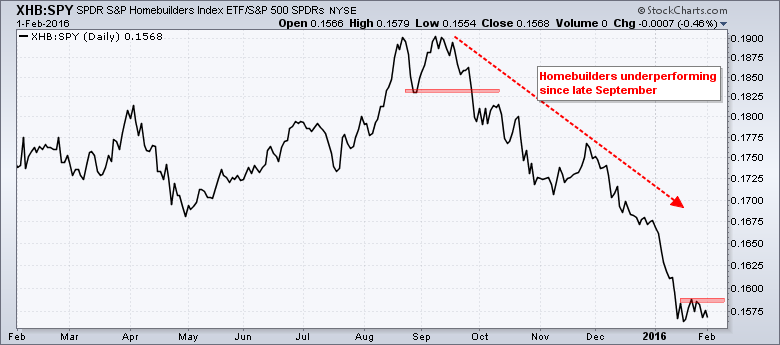
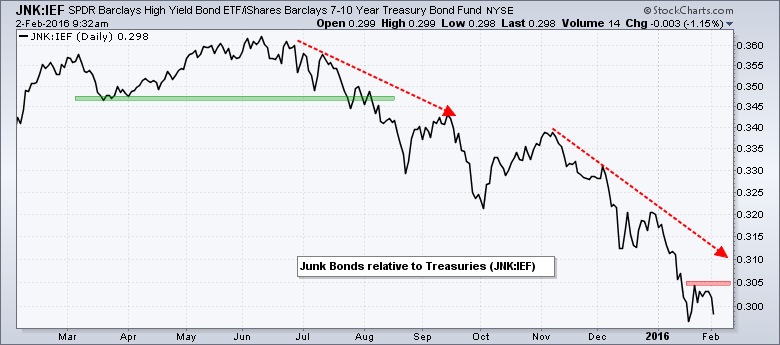
Even though stocks bounced the last eight days, important parts of the stock market are still struggling. We can see this by looking at some key ratio charts, which compare the performance of two securities (ETFs, stocks, bonds etc..). A risk-on environment favors stocks and this is what we want to see in a bull market. A risk-off environment does not favor stocks because it reflects risk-aversion within the market. I am measuring the risk appetite by comparing the Russell 2000 iShares (IWM) to the S&P 500 SPDR (SPY), the Russell 2000 iShares (IWM) to the Russell Top 50 ETF (XLG), the Home Builders SPDR (XHB) to SPY and the High Yield Bond SPDR (JNK) to the 7-10 YR T-Bond ETF (IEF). Even though some of these ratios bounced over the last few days, they remain in downtrends overall and much more strength is needed to get back to a risk-on environment.
Small-caps are underperforming large-caps because the IWM:SPY ratio remains in a clear downtrend.
Small-caps are underperforming mega-caps because the IWM:XLG ratio hit a new low last week.
Homebuilders are underperforming because the XHB:SPY ratio remains in a clear downtrend.
Junk bonds are underperforming Treasuries because the JNK:IEF ratio hit a new low in mid January.
Smattering of New Highs
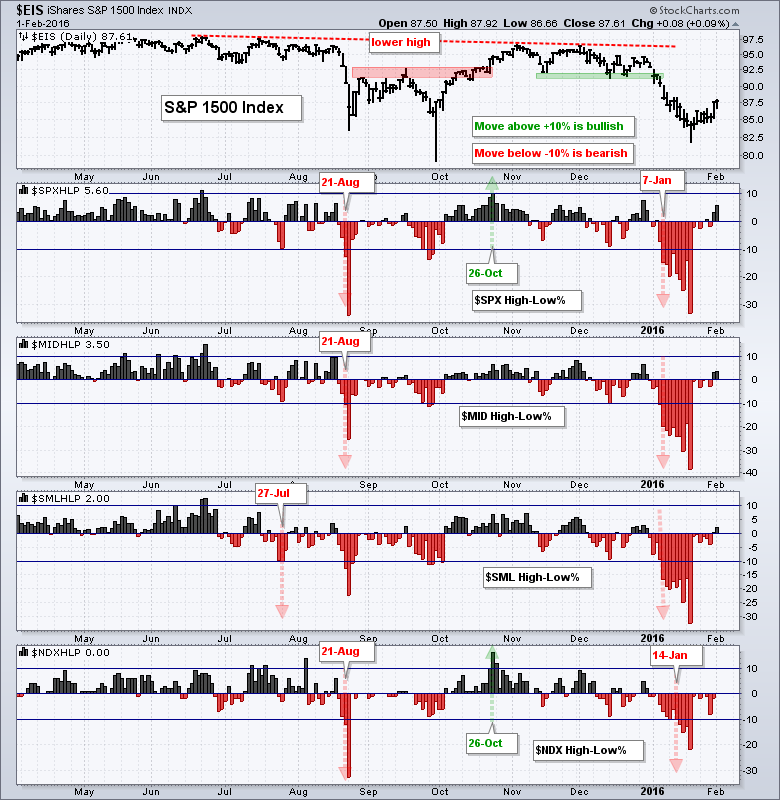
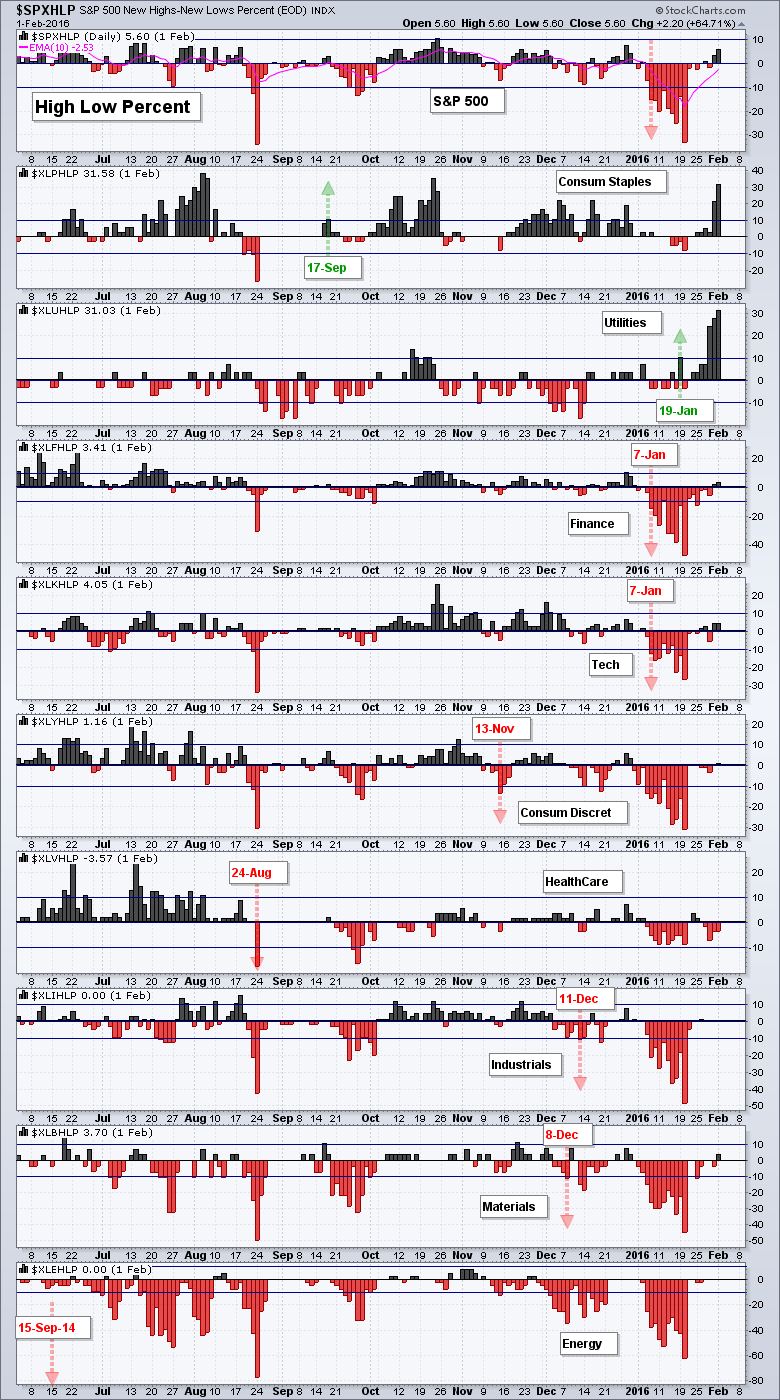
The bounce over the last two days was enough to push High-Low Percent into positive territory for the S&P 500, S&P MidCap 400 and S&P Small-Cap 600, but not the Nasdaq 100. Note that a move above +10% is bullish and remains bullish until a move below -10%, which is bearish. The High-Low Percent indicators were all bearish by 21-August when all four moved below -10% (red arrows). High-Low Percent for the S&P 500 and Nasdaq 100 moved back above +10% to turn bullish in late October (green arrows), but small-caps and mid-caps did not confirm. S&P 500 High-Low Percent moved below -10% to turn bearish again in early January and Nasdaq 100 High-Low Percent followed suit a week later. Despite some positive readings the last two days, the High-Low Percent indicators are not anywhere near +10% and not close to turning bullish again.
New Highs Concentrated in Three Groups
A scan for new highs over the past week shows most coming from consumer staples, utilities and REITs, which are part of the finance sector. The next chart confirms this because High-Low Percent exceeded +30% for the consumer staples and utilities sectors. These are the only two sectors with bullish signals based on High-Low Percent. The green arrows show when the indicator moved above +10% and the date. For the other seven sectors, the red arrows show when High-Low Percent moved below -10% and the date. The market as a whole is clearly net bearish with seven of the nine High-Low Percent indicators in bear mode. The finance and technology sectors managed a few new highs the last two days. For the rest of the sectors, new highs are very few and far between outside of consumer staples and utilities.
Scan Code for New Highs
Below is scan code to find new highs in the S&P 1500 over the last five trading days.
[group is SP500] or [group is SP400] or [group is SP600]
and [[today's high > yesterday's daily max(252,high)]
or [yesterday's daily high > 2 days ago daily max(252,high)]
or [3 days ago daily high > 4 days ago daily max(252,high)]
or [4 days ago daily high > 5 days ago daily max(252,high)]
or [5 days ago daily high > 6 days ago daily max(252,high)] ]
Relative and Absolute Uptrends
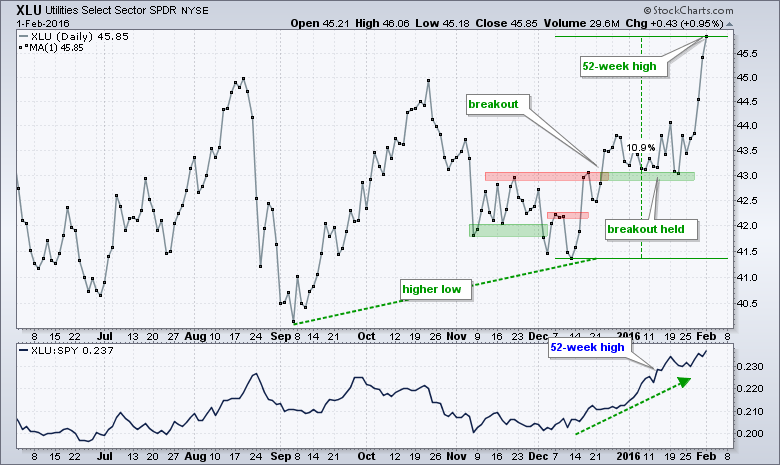
The consumer staples and utilities sectors are currently the only two sectors that show relative strength and are in uptrends on the price charts. Chart XX shows XLU breaking out in mid December, holding this breakout and surging to new highs this week. This means price is in a clear uptrend. The price relative (XLU:SPY ratio) hit a new high the second week of January and this is a relative performance uptrend (relative strength). XLU is currently up over 10% from its mid December low and getting a little over extended. Note that the utilities sector accounts for less than 4% of the S&P 500 so it does not take much to push this group sharply higher.
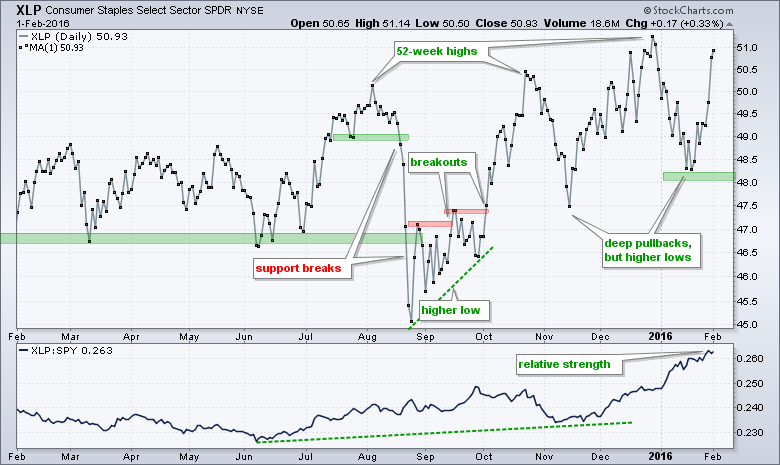
The Consumer Staples SPDR (XLP) hit a new high in late December and then pulled back rather sharply with the broader market in early January. XLP managed to hold above the mid November low to keep the uptrend alive and the ETF surged towards its prior highs. The price relative (XLP:SPY ratio) hit new highs in early January as XLP held up better than the market. Relative strength continued as the price relative hit new highs again in late January.
Webinar Highlights
In addition to the charts above, I will also covered the following in the webinar. Click here for the recording.
- Overview of 2000 and 2007 Bear Markets
- Equal-weight Sector Charts
- 10 Key Industry Group ETF Charts
- Gold Miners ETF and Gold SPDR
- Market in a NutShell ChartPack
Other Commentary Links
Bear Market Bounces - Understanding Bear Market Patterns, Signals and Retracements.
Measuring Risk On-Risk Off - Using charts to quantify stock, economic and credit risk.
PPO Trading Strategy - How to use 3 PPOs to develop a trend-reversion trading strategy.
Long-term Trend Indicators - Using the PPO, EMA Slope and CCI to determine the trend.
ETF Master ChartPack - 300+ ETFs organized in a Master ChartList and in individual groups.
Follow me on Twitter @arthurhill - Keep up with my 140 character commentaries.
****************************************
Thanks for tuning in and have a good day!
--Arthur Hill CMT
Plan your Trade and Trade your Plan
*****************************************


