Wrong Sectors Leading // Key Industry Groups Lagging // Is the FORCE Bullish or Bearish? // Testing Wedge Support (SPY, QQQ, IWM) // Overview of the Nine Sector SPDRs // Oversold Bounces for Housing and Semis // Showing Patience with the Gold Miners ETF (and gold) ////
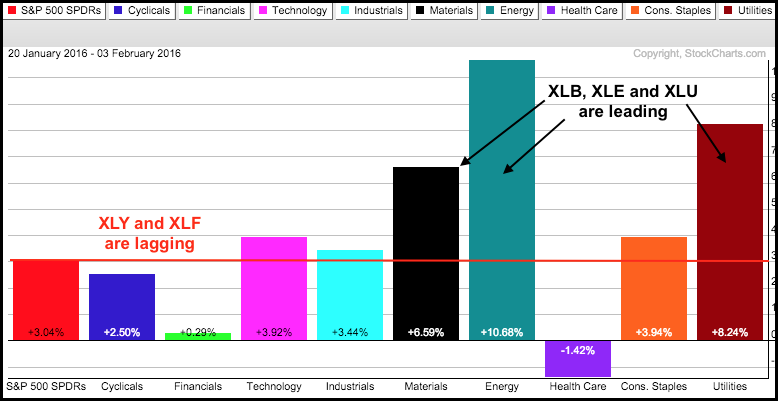
Wrong Sectors Leading
The stock market is in the midst of an oversold bounce with the S&P 500 SPDR (SPY) up around 3% the last two weeks. The bounce is actually quite lopsided with the vast majority of gains concentrated in three sectors: materials, energy and utilities. XLE is up over 10%, XLU is up over 8% and XLB is up over 6%. These are not the three sectors we want to see leading the rebound. XLE and XLB were the most beaten down and, therefore, had the most to recover. The big concern remains relative weakness in the Consumer Discretionary SPDR (XLY) and Finance SPDR (XLF), both of which are underperforming SPY. Also notice that the HealthCare SPDR (XLV) is actually down over the last two weeks and not even participating in the bounce.
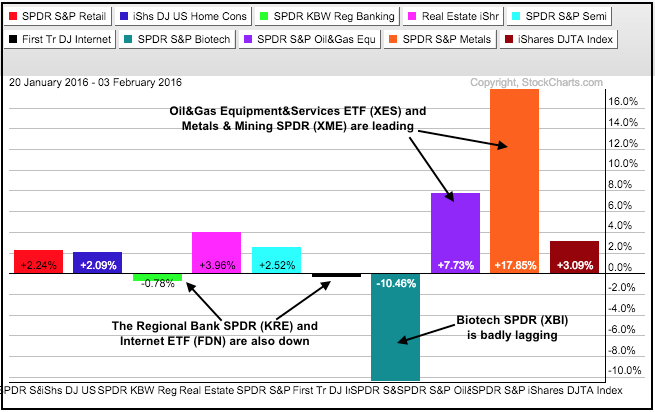
Key Industry Groups Lagging
The picture becomes even more mixed when we look at some key industry group ETFs over the last two weeks. Only four of these ten are up more than 3% and keeping pace with SPY. The Oil & Gas Equip & Services SPDR (purple +7.73%) and the Metals & Mining SPDR (orange +17.85%) are leading the way. These are indeed big bounces, but still bounces within bigger downtrends. The Biotech SPDR (XBI) is down over 10% and severely lagging. Also notice that the Regional Bank SPDR (KRE) and Internet ETF (FDN) are down.
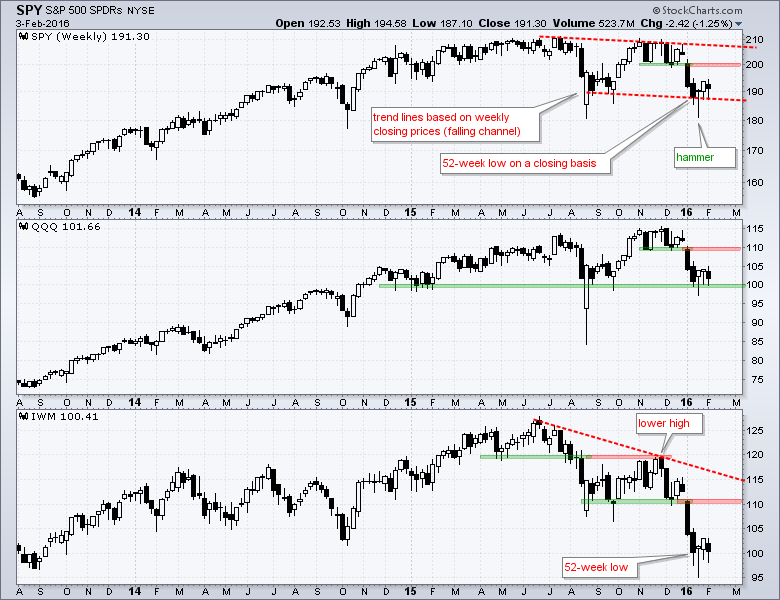
May the FORCE Be With You
I will start with the weekly candlestick charts for SPY, QQQ and IWM for some perspective on the broader market. There were hammers three weeks ago, modest gains last week and modest losses so far this week. On a closing basis, we have not seen much progress. The hammers are still alive, but the short-term trading environment remains choppy to say the least. This is actually quite normal after a shock to the system (aka the sharp declines from late December to mid January). Overall, a falling channel and 52-week closing low define the downtrend in SPY. In Star Wars terms, this downtrend is the dominant FORCE right now and we should keep this in mind when looking at the short-term picture. QQQ broke down in January as well, but did hit a 52-week high in November and has support in the 100 area. IWM remains the weakest of the three with a significantly lower high in November and clear 52-week low in mid January. Broken supports turn first resistance for all three.
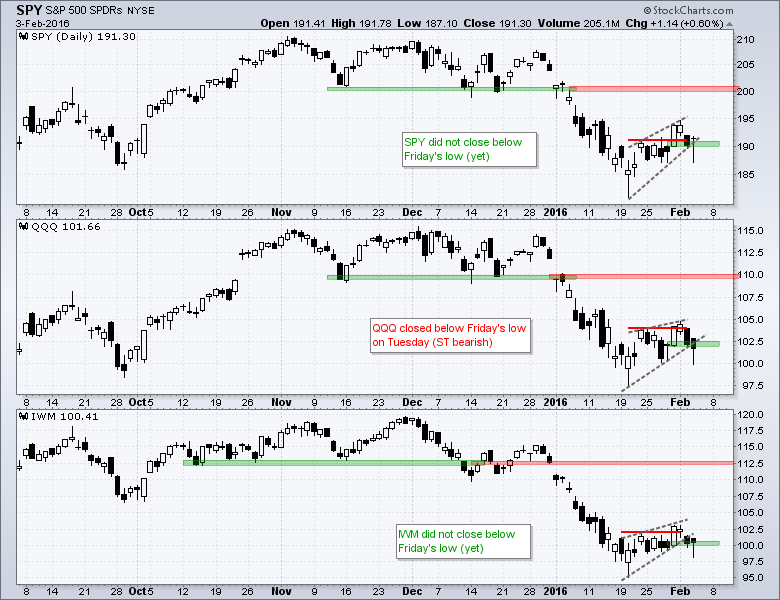
Testing Wedge Support (SPY, QQQ, IWM)
The short-term is a mess when looking at intraday price action, but SPY and IWM remain in short-term uptrends based on closing prices. The gray trend lines mark rising wedges over the last two weeks. The lower lines are quite steep because of the spike low in mid January. Note that I do not use trend lines to mark hard support or resistance levels. Instead, I use them to identify patterns and define the Rate-of-Change. The steepness of the trend line reflects the Rate-of-Change. The steeper the trend line, the higher the Rate-of-Change. A break below a trend line indicates that the Rate-of-Change is, well, changing. For short-term bearish signals, I am looking for a break below a prior low (hard support) or the negation of a prior signal. Note that last Friday's surge triggered short-term bullish signals with a break above the prior high and a confirmation of the weekly hammers. A close below Friday's low would negate this signal and be construed as short-term bearish. SPY and IWM dipped below these lows on Wednesday, but did not close below them. QQQ closed below Friday's low on Tuesday to negate its short-term signal. Thus, two of the three are still holding out and this keeps the short-term uptrend alive. Careful though. The FORCE is not with this short-term bounce because the FORCE is bearish.
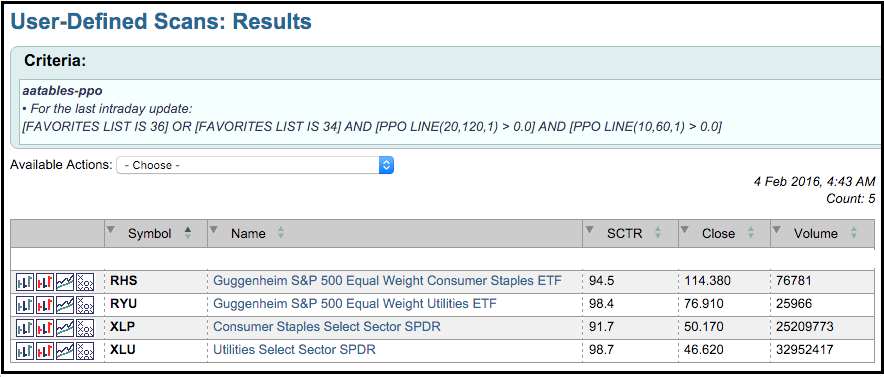
Overview of the Nine Sector SPDRs
The image below shows the results for a Percentage Price Oscillator (PPO) scan. Overall, seven of the nine sector SPDRs are in clear downtrends as defined by the medium-term PPO (10,60,1) and long-term PPO (20,120,1). Note that the medium-term PPO (10,60,1) is negative when the 10-day EMA is below the 60-day EMA and the long-term Percentage Price Oscillator (PPO) is negative when the 20-day EMA is below the 120-day EMA. 49 of the 50 industry group ETFs that I track are also in clear downtrends. The only sizable uptrends out there are in the utilities and consumer staples sectors.
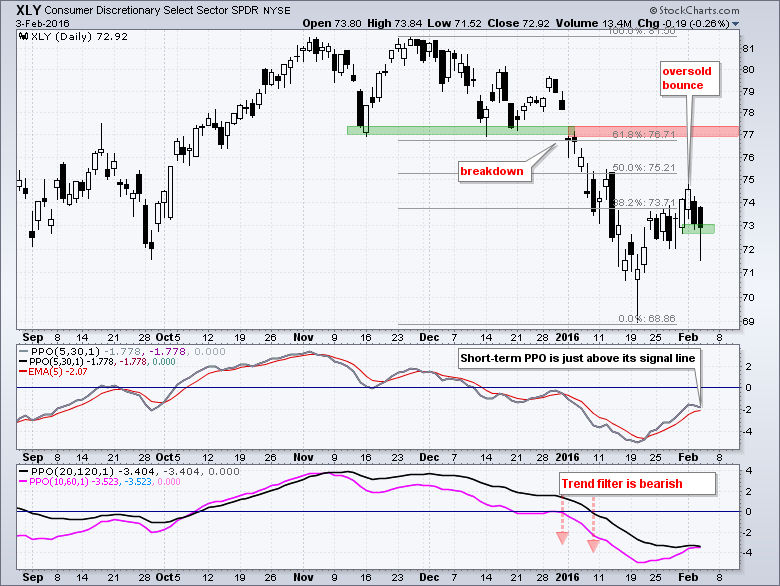
The Consumer Discretionary SPDR (XLY) is currently in the midst of an oversold bounce within a larger downtrend. The green support zone is based on Friday's low. A close below this low and bearish signal line cross would suggest that this counter-trend bounce is reversing.
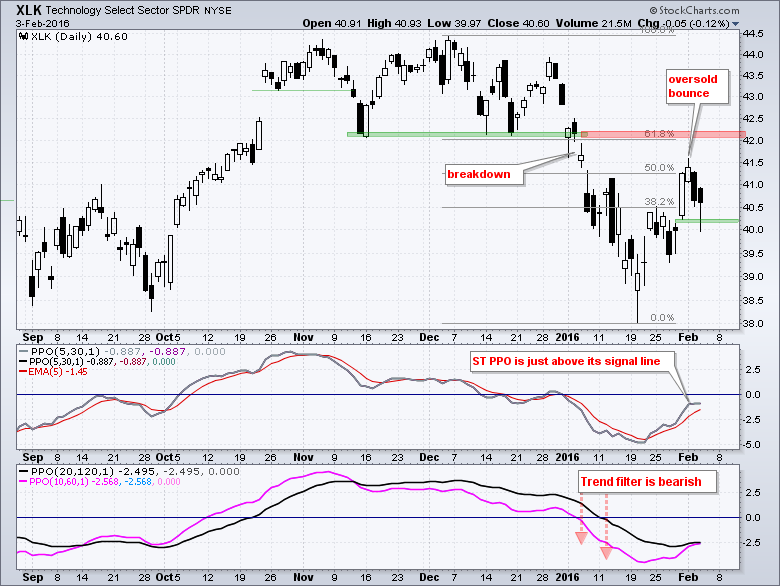
The Technology SPDR (XLK) dipped below Friday's close (green zone) during the day Wednesday, but finished well off the lows to keep the short-term bounce alive. The green zone actually marks the gap between Thursday's high and Friday's low. A close below 40.1 would fill this gap and a signal line crossover in the short-term PPO (5,30,1) would be bearish.
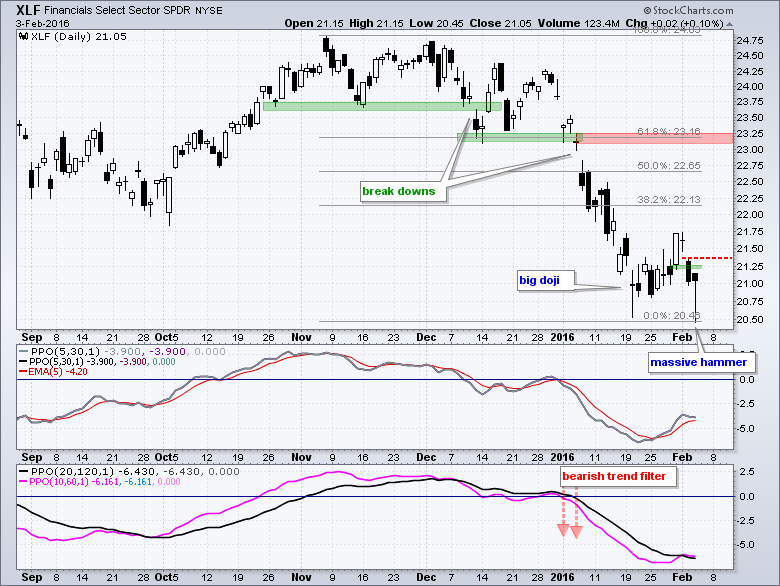
The Finance SPDR (XLF) led the market lower this week by breaking below Friday's low on Tuesday. The ETF moved below the mid January low in early trading, but rallied back to closed above 21. This means a big hammer formed and a close above Tuesday's high would confirm this hammer. Even so, it would still be a counter-trend bounce within a bigger downtrend.
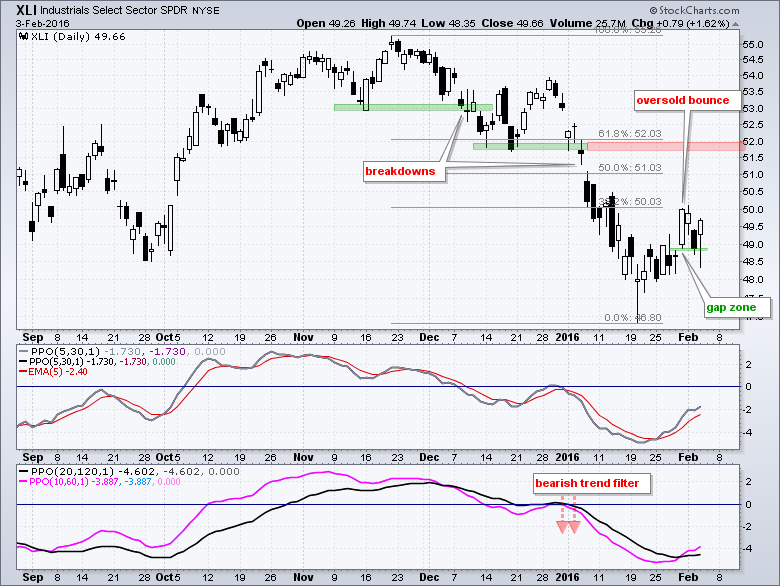
The Industrials SPDR (XLI) dipped into the gap zone between Thursday's high and Friday's low, but did not close below Thursday's high, which would fill the gap and break short-term support. Even though yesterday's strong close makes this one of the strong sectors short-term, it is still one of the weaker sectors long-term. A close below 48.8 would fill the gap and reverse the short-term upswing.
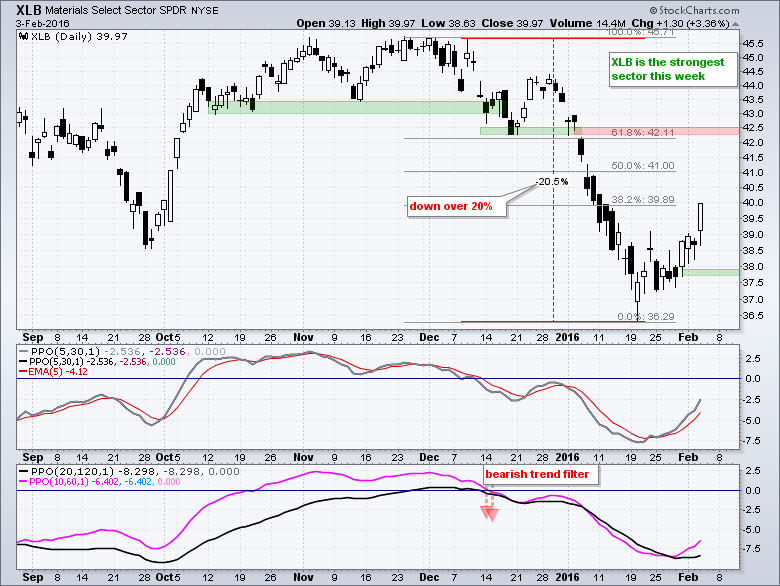
The Materials SPDR (XLB) proves that they harder than fall, the bigger they bounce. XLB fell around 20% from early December to mid January and surged around 10% from its mid January low. By the way, it would take a 26% gain to make up the prior 20.5% loss. In any case, this is still an oversold bounce within a bigger downtrend.
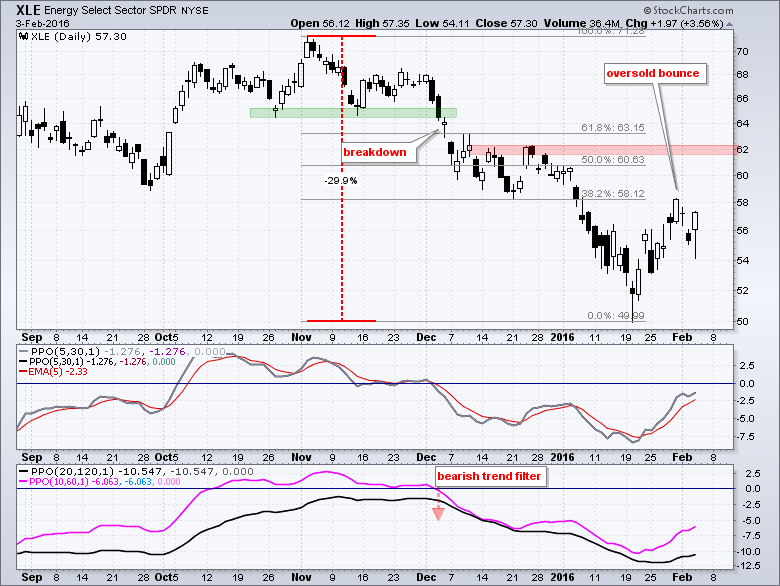
The Energy SPDR (XLE) fell around 30% from the early November high to the mid January low. It would now take a 43% advance from the mid January low to recover this loss. This is why it is important to limit your losses. It always takes a bigger gain to make up for a loss. XLE is in a long-term downtrend and getting a sharp oversold bounce. The December consolidation marks the next resistance zone in the 60 area (plus or minus $2).
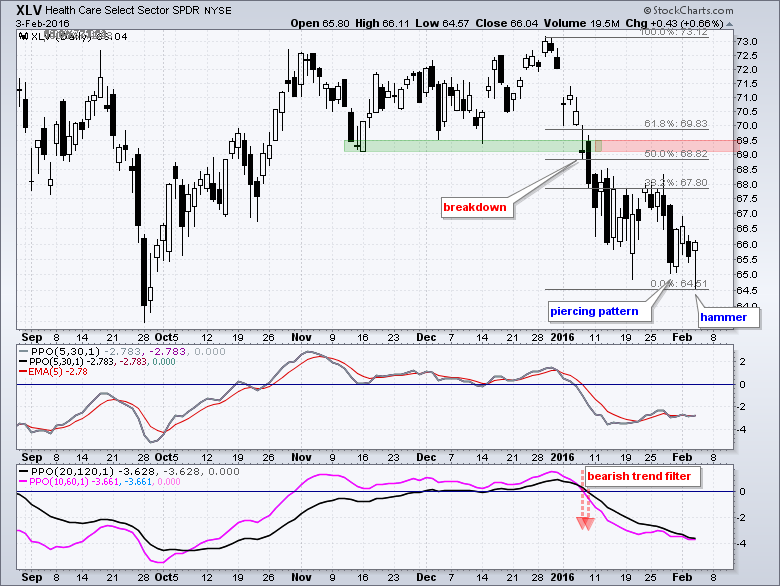
The HealthCare SPDR (XLV) is one of the weakest sectors this week and the ETF is in a downtrend overall (bearish trend filter). There are some signs of short-term stabilization with a piercing pattern on Friday and a hammer yesterday. Nevertheless, there is no sign of actual buying pressure.
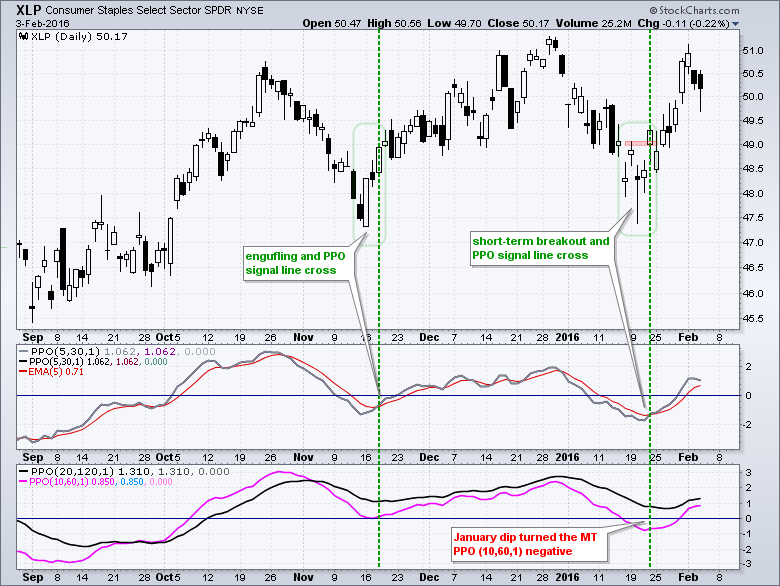
The Consumer Staples SPDR (XLP) remains one of the strongest sectors. Even though the medium-term PPO (10,60,1) turned negative in mid January, the long-term PPO (20,120,1) stayed positive and there was a short-term bullish signal on January 22nd when the short-term PPO (5,30,1) moved above its signal line and XLP broke out.
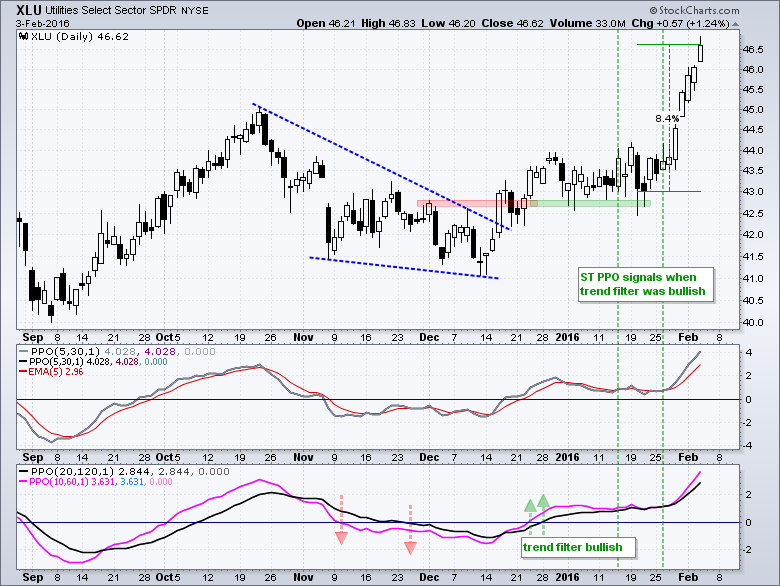
The Utilities SPDR (XLU) shows the PPO trading strategy in action with a bullish trend filter at the end of December and two short-term bullish signals in January. XLU is the strongest sector this year, but getting overbought after an 8.4% surge in two weeks.
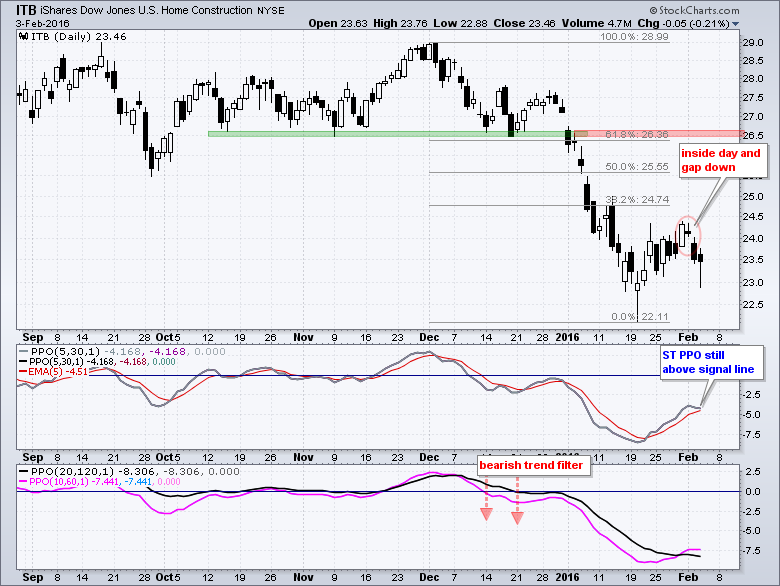
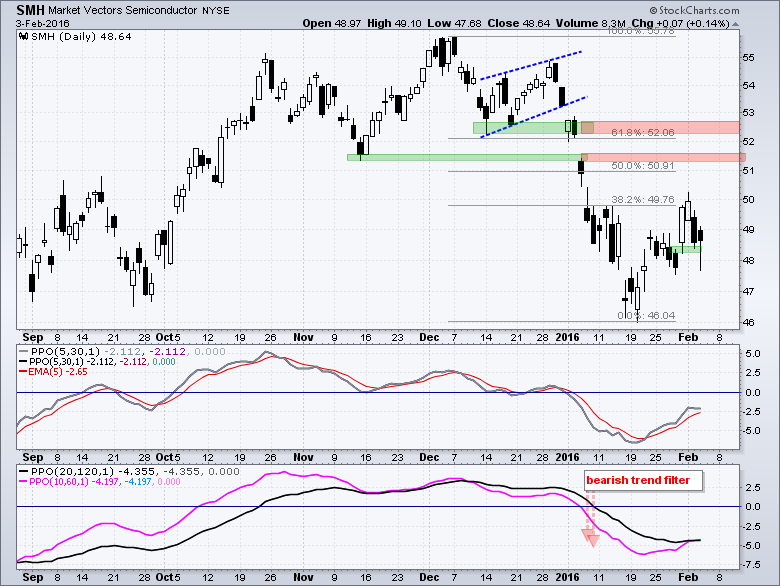
Oversold Bounces for ITB and SMH
The Home Construction iShares (ITB) became oversold after the decline from 29 to 23 and then bounced in late January. This bounce may be ending because the ETF formed an inside day and gapped down on Monday. Wednesday's intraday reversal would not be short-term bullish unless the ETF closes back above 24.1.
The Semiconductor ETF (SMH) got an oversold bounce back to the 50 area on Monday. Note that the trend filter is bearish and the short-term PPO (5,30,1) is just above its signal line. A close below 48.2 would break last Friday's low and a PPO signal line cross would turn momentum bearish.
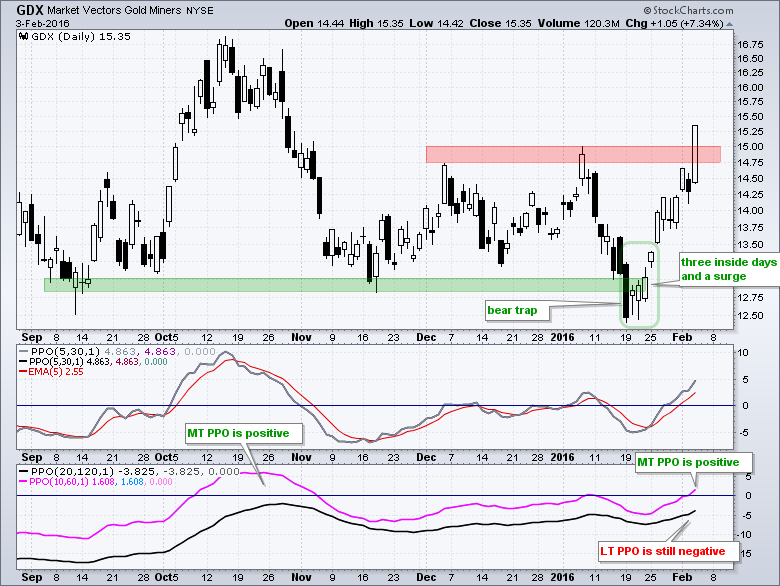
Showing Patience with the Gold Miners ETF
The Gold Miners ETF (GDX) broke above its December-January highs with a 7+ percent surge on Wednesday. This may be the start of a bigger uptrend, but it is not on my radar for long positions just yet. Why? Because the trend filter is mixed, the weekly trend indicators are still negative and gold remains in a long-term downtrend. Notice that the medium-term PPO (10,60,1) turned positive in October, but the long-term PPO (20,120,1) did not follow suit. I will simply wait to see if GDX turns bullish on the longer time frames and then wait for bullish setups on the shorter timeframe. I am not Stephen Curry so I am not looking to force the shot here. Instead, I want to let the game (setup) come to me before taking a shot. It does not work every time, but waiting for my setup kept me from getting long in late October.
Other Commentary Links
Bear Market Bounces - Understanding Bear Market Patterns, Signals and Retracements.
Measuring Risk On-Risk Off - Using charts to quantify stock, economic and credit risk.
PPO Trading Strategy - How to use 3 PPOs to develop a trend-reversion trading strategy.
Long-term Trend Indicators - Using the PPO, EMA Slope and CCI to determine the trend.
ETF Master ChartPack - 300+ ETFs organized in a Master ChartList and in individual groups.
Follow me on Twitter @arthurhill - Keep up with my 140 character commentaries.
****************************************
Thanks for tuning in and have a good day!
--Arthur Hill CMT
Plan your Trade and Trade your Plan
*****************************************


