Setting Short-term Support for the big 3 // Short-term Breadth Remains Bullish // Next Two Days Could Hold the Key for Breadth // Equal-weight, Small-caps and Mid-caps Take the Lead // Consumer Discretionary and Retail Outperform // Junk Bonds Get a Bounce // Bonds, Gold and the Yen // Rising Wedges in XLI and XLB // Stocks of Interest (ADI, CA, CMI, GE, MSFT, PPG) ////
Closes versus Candlesticks
It’s a rocky ride, but the short-term evidence remains bullish. Even with short-term analysis, I try to take a weight of the evidence approach when it comes to the broader market. A lot of time goes into broad market analysis because the direction of the major stock indices is the single biggest driver for an individual stock or ETF. Today I will start with short-term charts for the big three (SPY, QQQ, IWM), analyze short-term breadth and then look at some other broad market metrics.
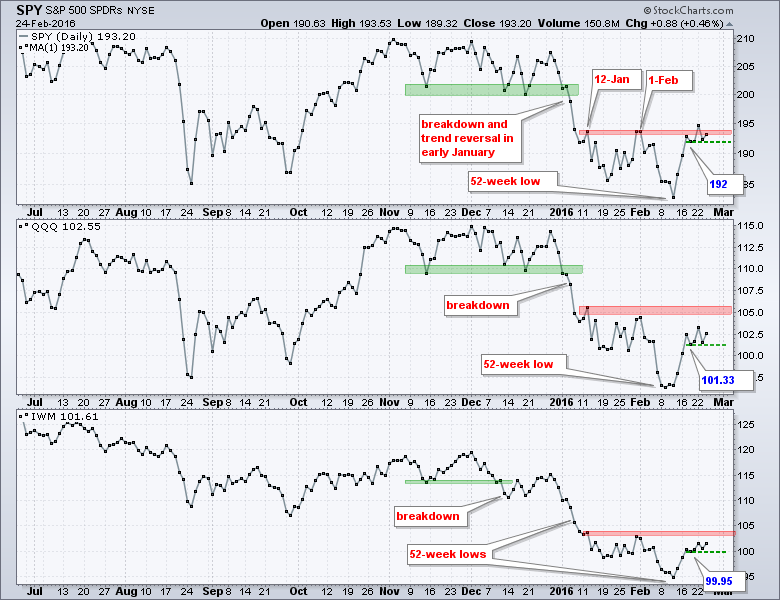
The long-term trends for SPY, QQQ and IWM are down and we are still in a bear market, which was signaled on January 7th (mid December for IWM). I do not know how long this signal will last or how far the trend will extend. All I can do is wait for a counter signal. The chart above shows closing prices to filter out some of the intraday noise. The closing low from last week marks the first closing support level to watch. A close below this closing low by all three would be short-term bearish for the broader market. Note that IWM is 1.6% above this closing low so it would take a pretty good decline to trigger a break. The red resistance zone is based on the highs from January 12th and February 1st. All three need to close above this zone before considering a bigger trend change.
SPY, QQQ and IWM Hold Support
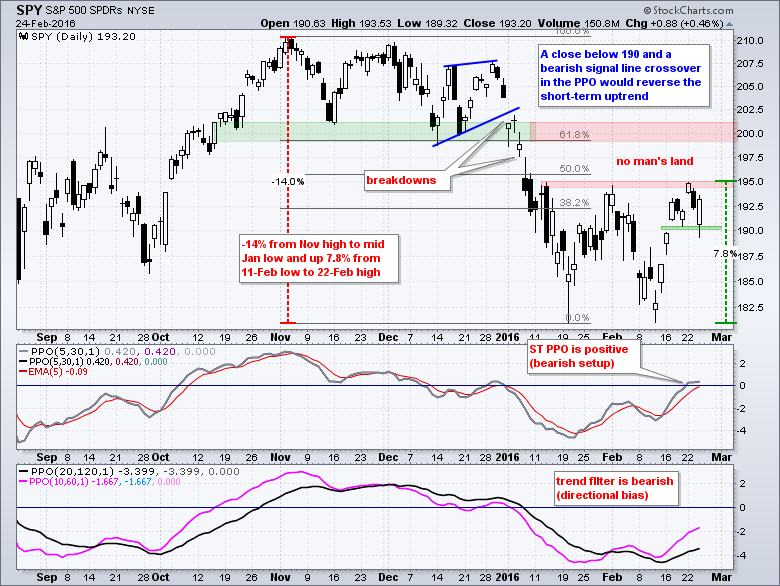
Now let's tackle the candlestick charts and feel the noise. SPY surged 7.8% from low to high in six days and gapped up four of those days. I did not want to base support on Monday's gap because the market was entitled to a rest or pullback after such a sharp advance. Instead, I opted to mark support at the second gap and set it at 190 (closing basis). SPY filled the last gap intraday, but roared back to close above 192.5 and affirm support in the 190 area. Where do we mark support now? At this point, I think we have three things to watch for a short-term reversal in SPY: a close below 192, a close below 190 and a bearish signal line cross in the short-term PPO (5,30,5). The short-term trend gets a bearish bias when at least two of these three happen.
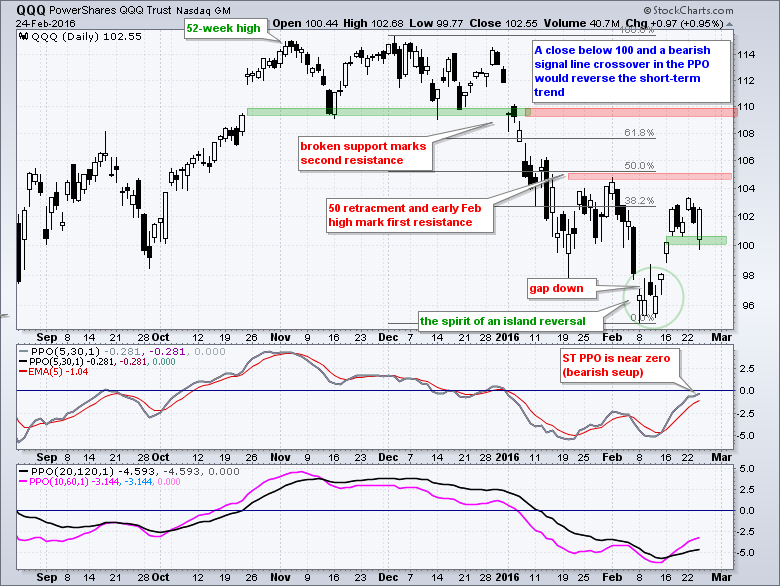
For a short-term reversal in QQQ I am watching the following: a close below 101.33, a close below 100 and a bearish signal line cross in the short-term PPO (5,30,5).
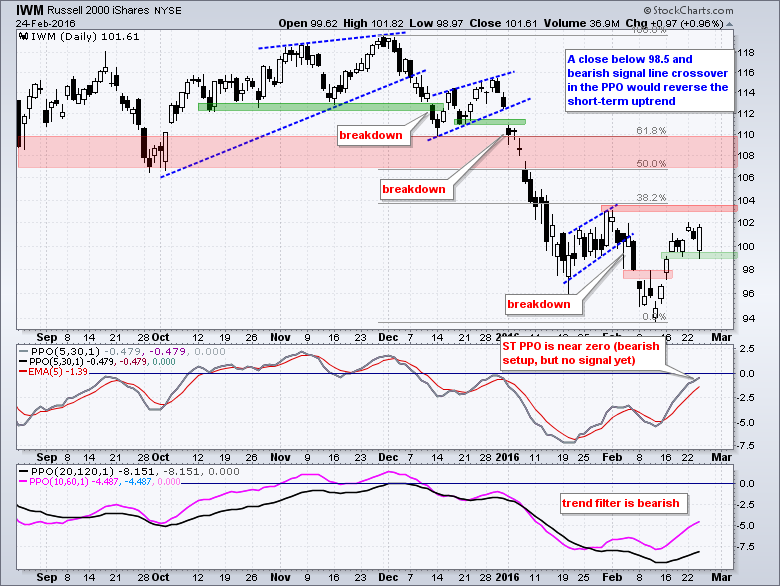
For a short-term reversal in IWM I am watching the following: a close below 99.95, a close below 98.5 and a bearish signal line cross in the short-term PPO (5,30,5).
Short-term Breadth Remains Bullish
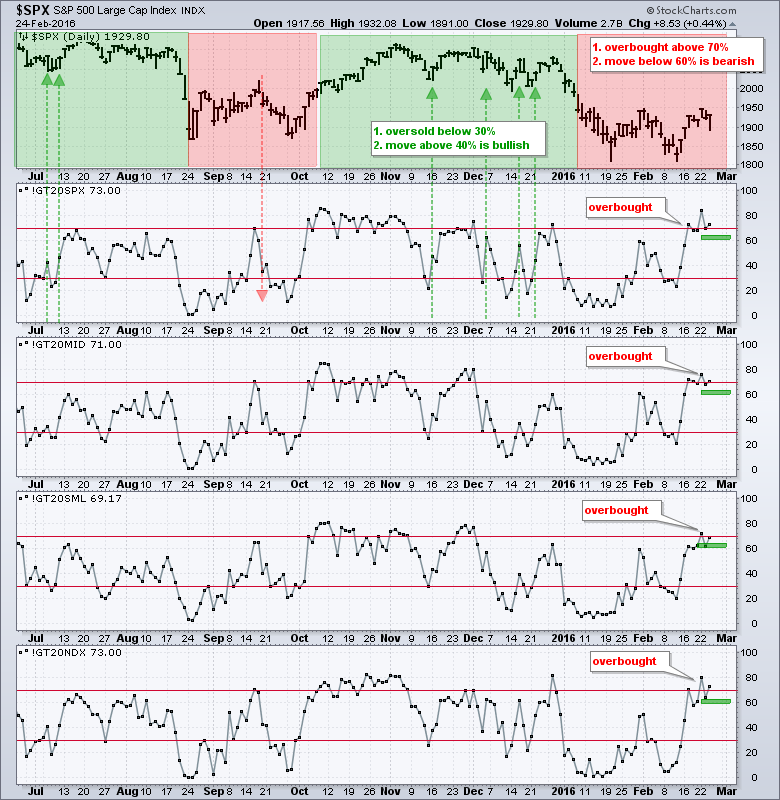
The percent-above the 20-day EMA indicators are still in bull mode. They became overbought last week and this week with moves above 70%, but they have yet to turn down and move below 60%. Thus, they are overbought and bullish. Think about this for a moment. Here are the indices and the percentage of stocks that are above the 20-day EMA: $SPX 73%, $MID 71%, $SML 69% and $NDX 73%. Clearly, the vast majority of stocks are still above their 20-day EMAs and this supports a short-term uptrend in these indices. A move below 60% would show deterioration within the indices and this would be short-term bearish.
Next Two Days Could Hold the Key
A Zweig Breadth Thrust is built on the premise that a 10-day surge in positive breadth is enough upward power to start a bigger uptrend. I tweaked the signal parameters and the underlying breadth indicator, but I also use a 10-day EMA to measure sharp shifts in market breadth. A bullish breadth thrust occurs when the 10-day EMA for AD Percent moves above +30% and a bearish breadth thrust occurs when the 10-day EMA moves below -30%. After each trading day, the first data point of the 10-day EMA drops off the calculation and a new data point is added. Even though we don't know the future data points, we can look at the first data points to see which will fall off and how that might affect the 10-day EMA.
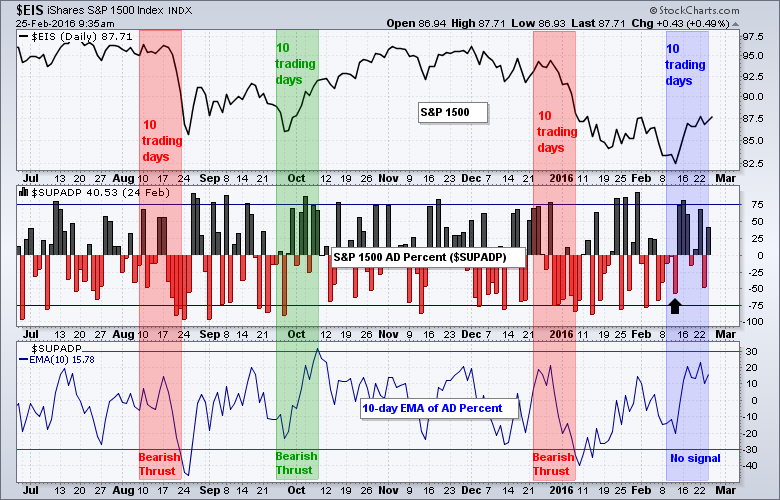 The chart above shows daily AD Percent for the S&P 1500 and four major indices. The green shading shows the 10 trading days that triggered the bullish breadth thrust on October 8th and the red shading shows the 10 trading days that triggered the bearish breadth thrust on January 7th. The blue shading shows the last ten trading days. Notice that a sizable down day (black arrow) will drop from the 10-day EMA calculation in two days (after Friday's close). This means a strong advance on Thursday or Friday could trigger a bullish breadth thrust. It hasn't happened yet so stay tuned.
Equal-weight, Small-caps and Mid-caps Take the Lead
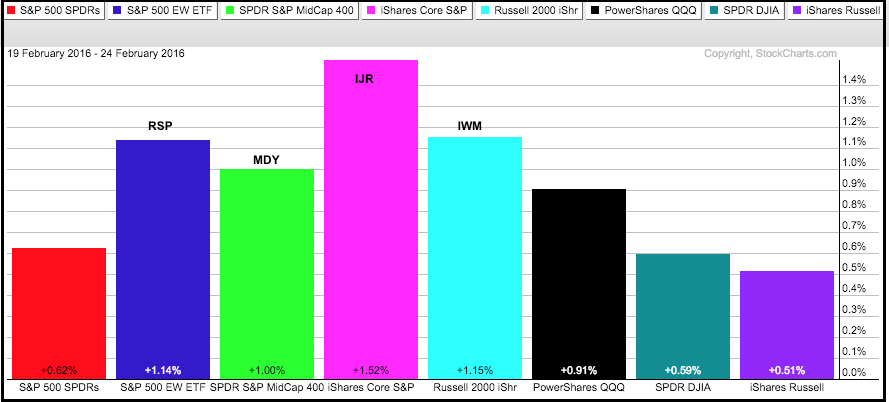
I am also seeing some short-term relative strength in a few key groups and this is short-term positive for the stock market. It is only three trading days, but note that the EW S&P 500 ETF (RSP), S&P MidCap SPDR (MDY), S&P SmallCap iShares (IJR) and Russell 2000 iShares (IWM) are leading the way higher this week. IJR is up 1.52% for the week and seriously outpacing the S&P 500 SPDR (SPY), which is up .62% this week. Relative strength in small-caps, mid-caps and equal-weights is a positive sign for the broader stock market.
Consumer Discretionary and Retail Outperform
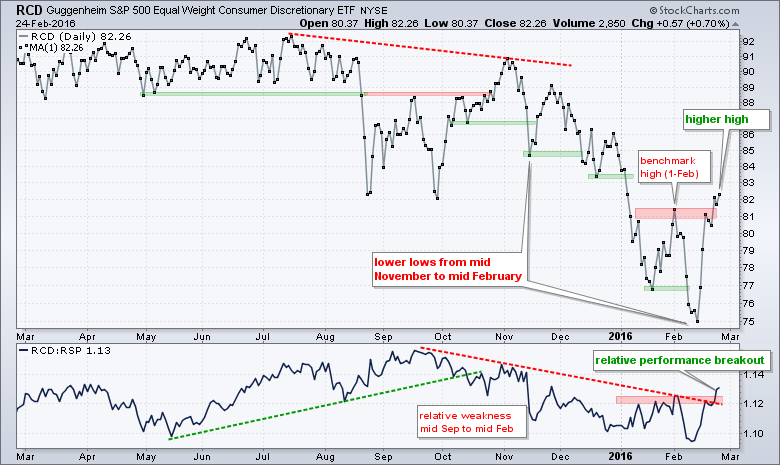
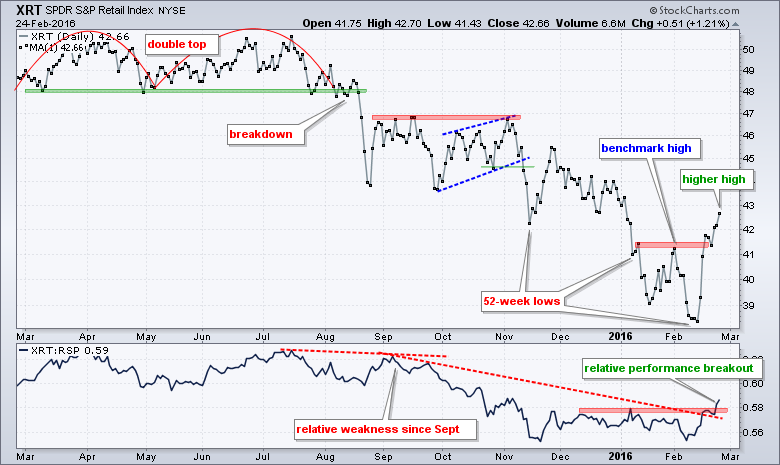
The EW Consumer Discretionary ETF (RCD) is one of the strongest sectors over the last eight days. The February 1st high is a benchmark high (peak) that shows up on most charts. Stocks and ETFs above this high show relative (chart) strength. Stocks and ETFs below this high show relative (chart) weakness. RCD broke above this high on Monday and moved above Monday's close on Wednesday. This is a higher high and the first step to an uptrend. The indicator window shows the price relative also breaking above its February 1st high and hitting its highest level of the year. This means RCD is outperforming the EW S&P 500 ETF (RSP) in 2016. A higher high on the price chart and relative strength in 2016 for the consumer discretionary sector is positive for the market because this is the most economically sensitive sector. The second shows the Retail SPDR (XRT) with a similar breakout on the price chart and the relative performance line (XRT:RSP ratio). This sector and industry group are more important than China and oil (IMHO).
Junk Bonds Get a Bounce
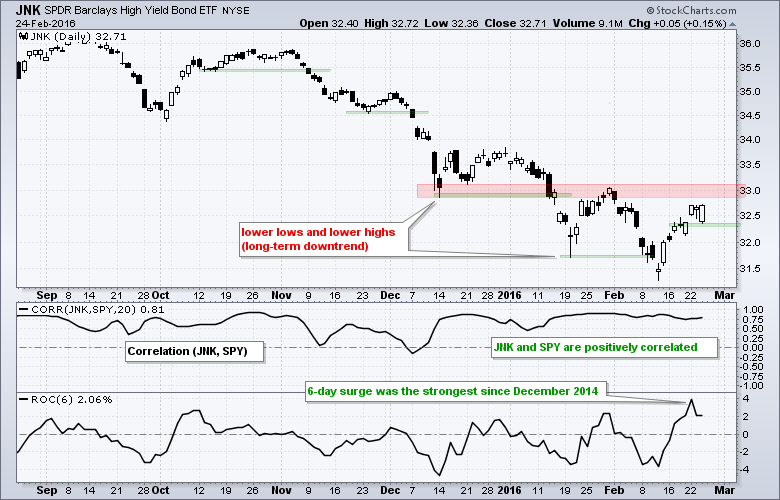
Outside of the stock market, we can see some easing in the credit markets because the High Yield Bond SPDR (JNK) got its biggest 6-day move since December 2014. The long-term trend for JNK is clearly down, but the short-term trend is up and chartists should watch 32.2 for signs of a short-term reversal. JNK is important to watch because it has a strong positive correlation with SPY. This means they tend to move in the same direction. Notice that the Correlation Coefficient is near .80 right now.
Bonds, Gold and the Yen
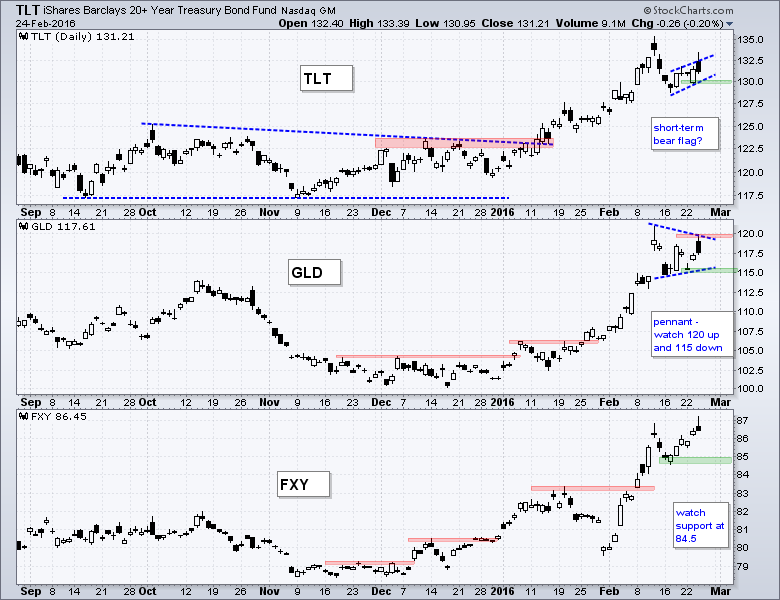
The 20+ YR T-Bond ETF (TLT), the Gold SPDR (GLD) and Yen ETF (FXY) are the star performers in 2016. FXY is up around 7% year-to-date, TLT is up around 9% and GLD is up around 16%. In contrast, the S&P 500 SPDR (SPY) is down around 5% and the USO Oil Fund (USO) is down over 20%. T-Bonds, the Yen and Gold have been the risk-off beneficiaries this year and I think a little weakness in these three is needed if the stock market is to continue its short-term advance. TLT is forming a short-term bear flag and chartists can watch 130 for a short-term breakdown. GLD is consolidating with a pennant or small triangle. FXY has support at the mid February low.
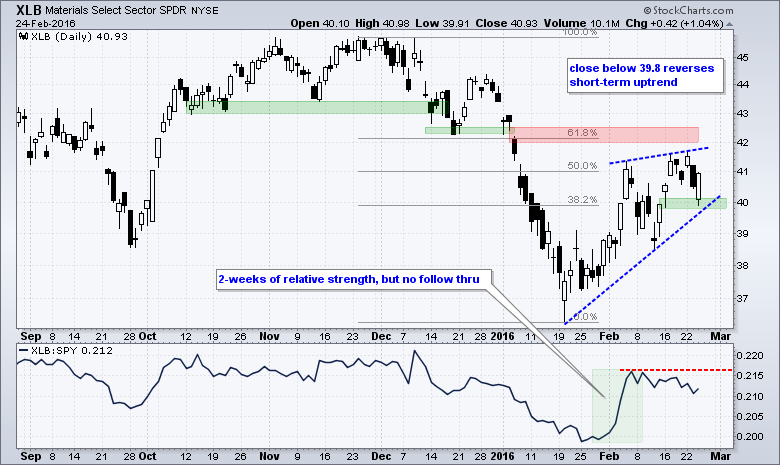
Rising Wedges in XLI and XLB
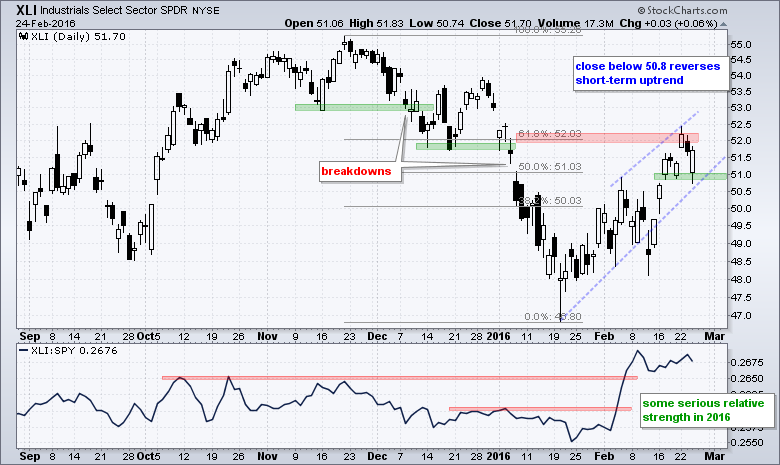
The Industrials SPDR (XLI) and the Materials SPDR (XLB) are market leaders over the last 5-6 weeks. The long-term trends are still down, but the short-term trends are up and approaching key retracements. Both have rising wedges taking shape since mid January and chartists should watch short-term support closely. Notice that I do not view these wedge trend lines as support. Instead, these simply highlight a pattern at work. I would use the lows of the last six trading days to mark support. A rising wedge is typical for counter-trend bounces and the typical retracement is 50-62%. Closes below the green support zones would break first support and provide the first sign that the short-term uptrends are reversing.
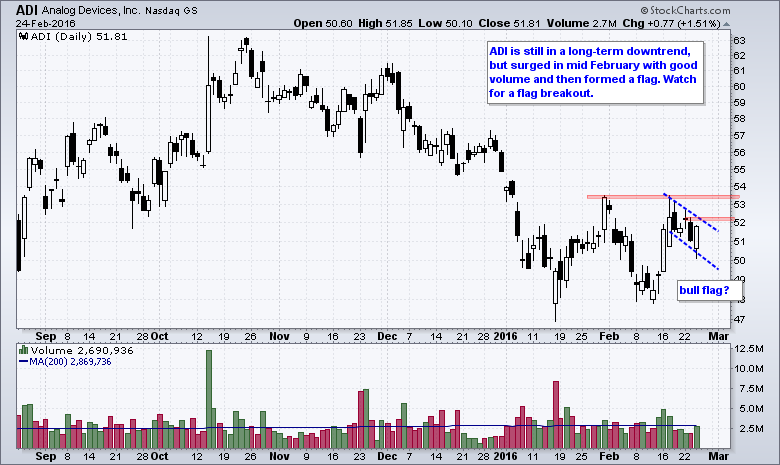
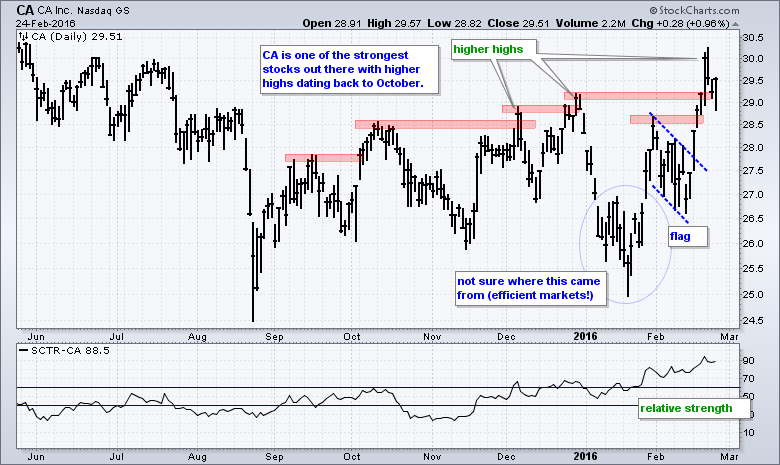
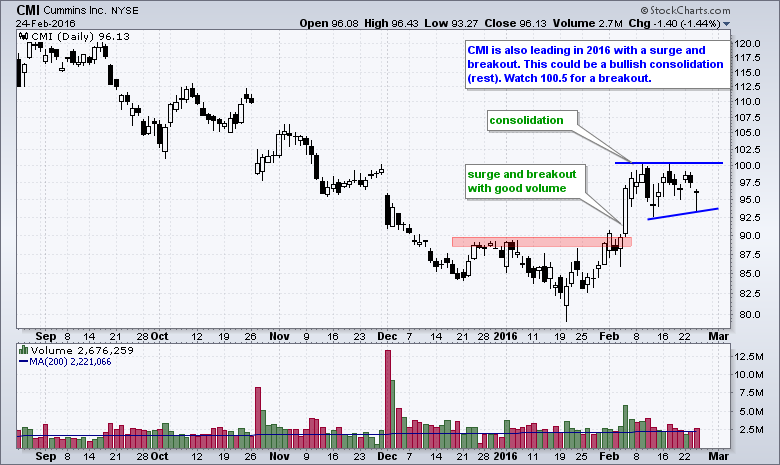
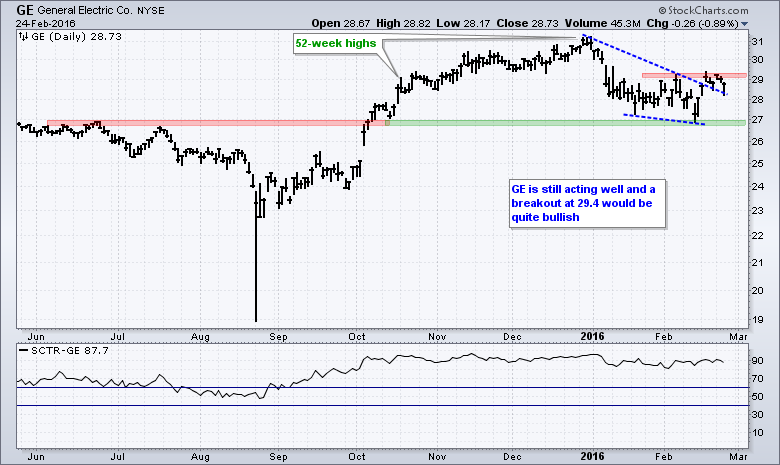
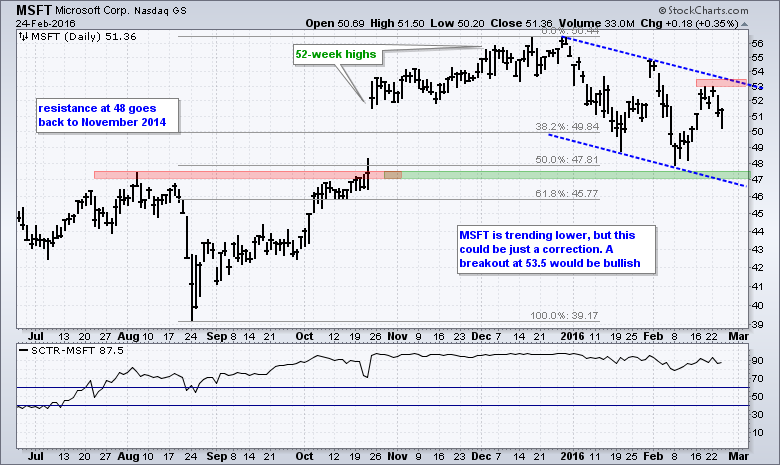
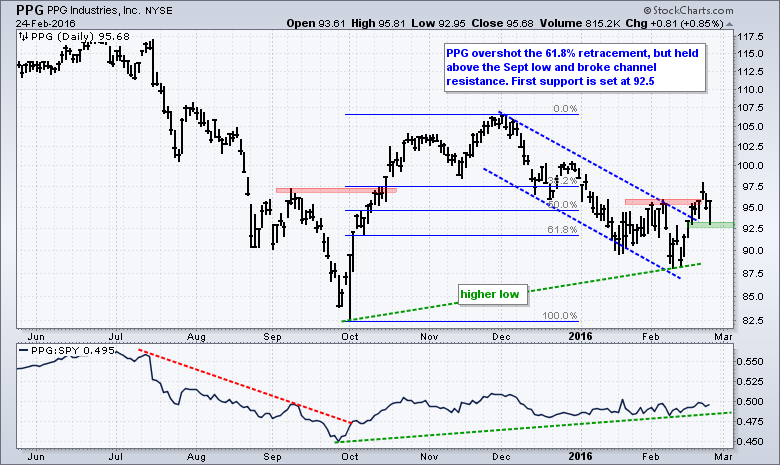
Stocks of Interest
 Other Commentary Links
Bear Market Bounces - Understanding Bear Market Patterns, Signals and Retracements.
Measuring Risk On-Risk Off - Using charts to quantify stock, economic and credit risk.
PPO Trading Strategy - How to use 3 PPOs to develop a trend-reversion trading strategy.
Long-term Trend Indicators - Using the PPO, EMA Slope and CCI to determine the trend.
ETF Master ChartPack - 300+ ETFs organized in a Master ChartList and in individual groups.
Follow me on Twitter @arthurhill - Keep up with my 140 character commentaries.
****************************************
Thanks for tuning in and have a good day!
--Arthur Hill CMT
Plan your Trade and Trade your Plan
*****************************************


