A Most Violent Range // SPY is first to Clear Prior High // Watching for the Bullish Breadth Thrust // S&P 500 Leads High-Low Percent // Signal Pecking Order // Following Crude and Junk // Consumer Discretionary and Industrials Come Alive // Finance and Energy Remain Laggards // Friday Food for Thought ////
A Most Violent Range
Most of us stick our toe in the water before jumping into the pool. Before sticking our toe (or more) in the stock market, I think it is important we understand the current character of this stock market and set realistic expectations. In short, the market is very temperamental right now. Note that I am using the S&P 500 as the market proxy because this index accounts for around 80% of the total US stock market and it is the most widely used benchmark. The S&P 500 is up sharply over the last two weeks and nearing the midpoint of its two year range, which is around 1975. In percentage terms, the index is around 8% below its two year high (May 2015) and 8% above its two year low (April 2014). Moreover, notice that the index has crossed the midpoint of this range (1975) at least 17 times since July 2014. The red and green shading highlights three extremely sharp moves since July. This is a market that requires a close watch because direction can change fast and these changes can be dramatic.
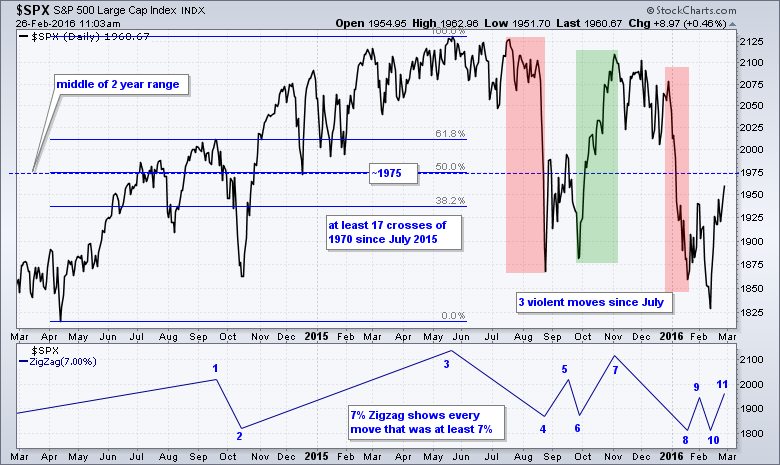
The indicator window shows the 7% Zigzag indicator to filter out price swings that are less than 7%. Notice that the number of 7% swings has increased dramatically since August 2015. Starting in September 2015, there have been seven swings of at least 7% and we have had four just this year (two months). The short-term trend is clearly up, but keep in mind that we are nearing the midpoint of this range and we are in a volatile trading environment.
SPY is first to Clear Prior High
Even though I have yet to get long-term bullish signals on breadth or trend, the bulls are in the midst of a strong run as SPY clears its early February high. On the weekly charts, I am seeing some similarities between the August-September reversal and the January-February period. A big harami formed in August and there was a test with a hammer in September. SPY then gapped up and closed above the closing high (red dotted line). This breakout ultimately failed, but we did get a counter signal with the January support break.
Turning to the current situation, SPY formed a big hammer in January and then a three candlestick reversal in February. The middle candlestick is a spinning top. Notice that there are gaps on either side of this spinning top. With this week's advance, SPY is poised to close above the closing high from late January.
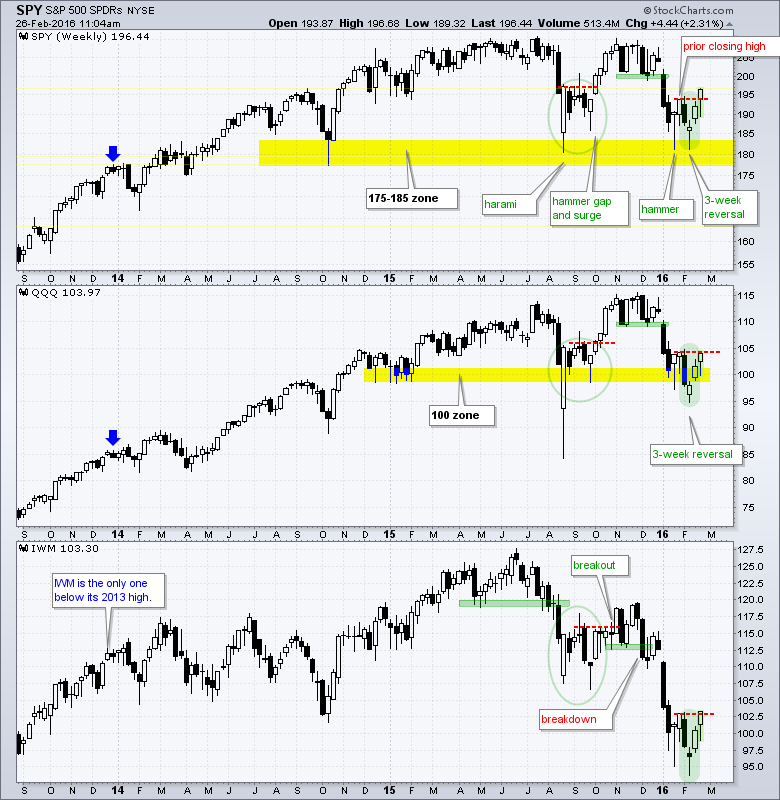
QQQ dipped to 95 in early February, but quickly recovered and moved back above 100 last week with a 3-week reversal. The ETF has yet to close above the late January closing high for a medium-term breakout. IWM is by far the weakest of the three. Notice that it is the only one that is below its 2013 high (blue arrow). Nevertheless, IWM formed a three week reversal and is challenging the late January closing high.
Watching for the Bullish Breadth Thrust
The first bullish signal of significance would likely be a breadth thrust and we could get one with a strong close on Friday. As noted in Thursday's commentary, a bullish breadth thrust occurs when the 10-day EMA of AD Percent surges above +30%. I track this indicator for the S&P 1500, S&P 500, S&P MidCap 400, S&P Small-Cap 600 and Nasdaq 100. As usual, I look at the weight of the evidence to define signals. In other words, I want to see the majority of indices trigger bullish breadth thrusts to validate a signal. S&P 1500 AD Percent ($SUPADP) has been positive seven of the last ten days and above +50% five of those up days. A big down day -57% will drop off the 10-day EMA today and we will get a bullish breadth thrust if S&P 1500 AD Percent finishes at +64% or higher.
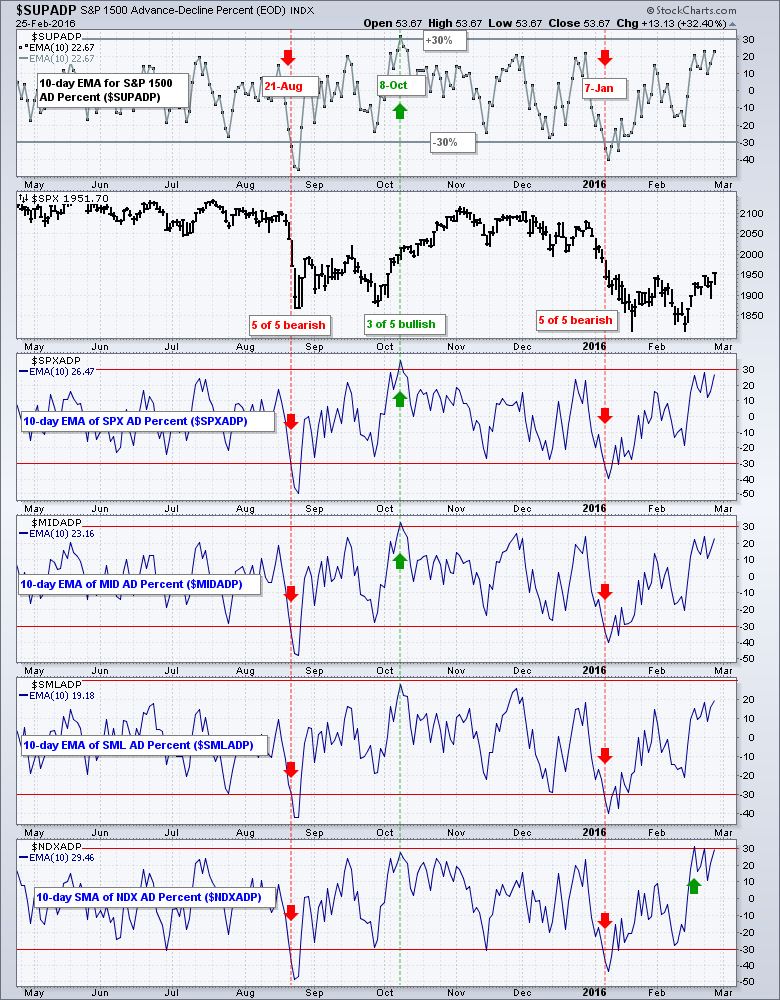
The chart above shows all five breadth thrust indicators. Notice that the 10-day EMA for Nasdaq 100 AD Percent ($NDXADP) triggered a bullish breadth thrust with a move above +30% last week. Note that the Nasdaq 100 is a relatively narrow index with a heavy weighting in technology. The 10-day EMA for S&P 500 AD Percent ($SPXADP) is very close to a signal because it finished at +26.47% on Thursday. The 10-day EMA for S&P SmallCap AD Percent ($SMLADP) is the weakest of the group because it is the furthest from the 30% level.
S&P 500 Leads High-Low Percent
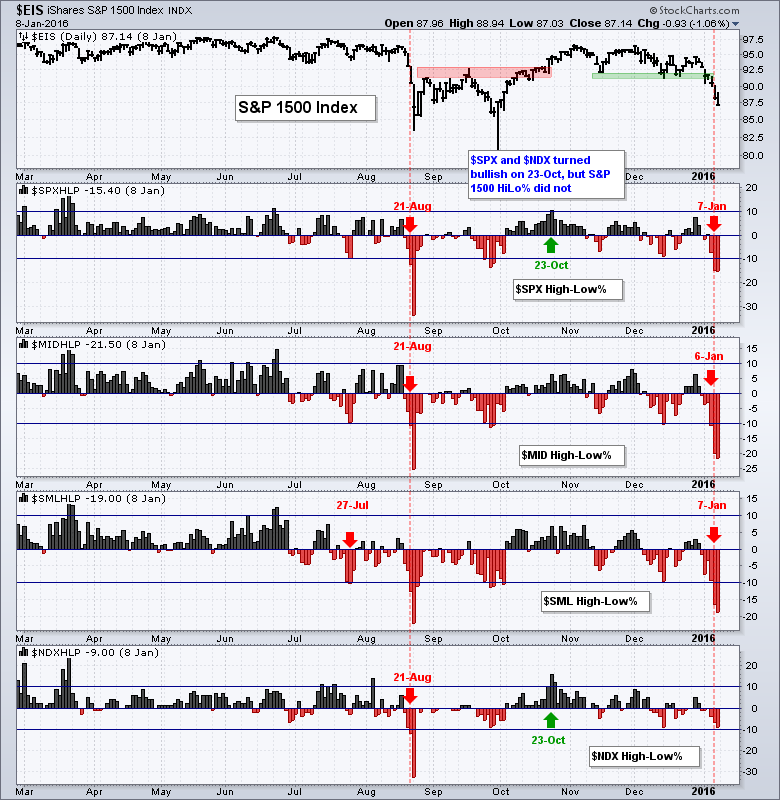
The High-Low Percent indicators remain bearish overall. A move above +10% shows broad enough strength for a bullish signal, while a move below -10% shows broad enough weakness to warrant a bearish signal. All four were bearish by August 21st, two of four were bearish in late October and three of the four were bearish in early January. The early January signals have yet to be countered with bullish signals. S&P 500 HiLo% ($SPXHLP) is the closest as it finished at +7% on Thursday. The rest are below +5% and have yet to show any material strength.
 Signal Pecking Order
I take a weight of the evidence approach when analyzing the broader market and with my indicator groups. Sometimes indicator signals trigger all at once and sometimes there is a pecking order. While I cannot be certain how a long-term bullish signal would unfold, my guess is that we would see a breadth thrust first. Judging from the current indicator levels, we are unlikely to see all five AD Percent indicators trigger at the same time. Bullish breadth thrust in three of the five would be enough to trigger a valid signal. I suspect at the High-Low Percent indicators would be next and would look for three of the four to break above +10% to trigger bullish signals. The trend indicators are likely to be last because they are lagging in nature. These include the weekly PPO(5,52,1) turning positive, the 52-week EMA turning up and CCI (52) turning positive. Elsewhere, some of the ratio charts are breaking out (RSP:SPY, RCD:RSP, XRT:RSP) and some have yet to break out (SPY:IEF, JNK:IEF, SPHB:SPHQ). These ratio charts are part of the overall risk environment and weight of the evidence is mixed at best.
Following Crude and Junk
The overall risk environment remains negative, but we are seeing relative strength in the consumer discretionary sector and the retail group. In addition, oil firmed over the last six weeks and junk bonds surged over the last two weeks. The correlation between stocks and oil is strong, as is the correlation between stocks and junk bonds. In fact, the S&P 500, April Light Crude Futures (^CLJ16) and the High Yield Bond SPDR (JNK) have moved in the same direction every single week this year.
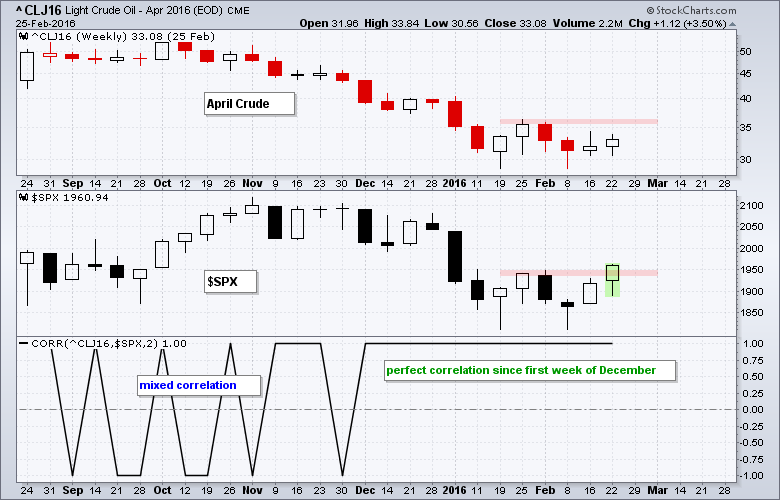
The chart above shows April Crude, the S&P 500 and the 2-period Correlation Coefficient. A value of 1 means they moved in the same direction and a value of -1 means they moved in opposite directions. The correlation was mixed in September, October and November as the Correlation Coefficient bounced from 1 to -1. Correlation hit 1 the first week of December and remained at 1 the last 12 weeks. Crude is still in a downtrend and needs to break above the late January high to show any strength of significance.
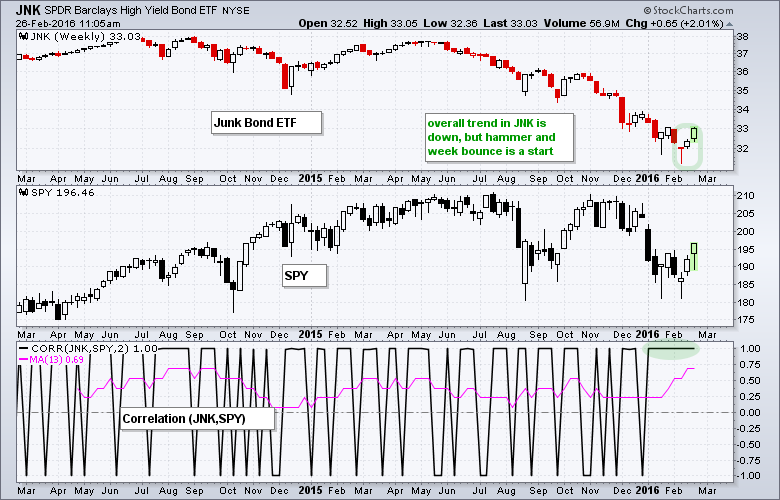
The next chart shows the High Yield Bond SPDR (JNK) with SPY and the Correlation Coefficient. Note that this is a 2-period Correlation Coefficient with a 13-week EMA (pink). I added the 13-week EMA to smooth the fluctuations and determine the general relationship, which is clearly positive. Notice that the 2-period Correlation Coefficient has been at 1 since early January and the 13-week EMA has been positive for over two years. A bounce in JNK, therefore, would be positive for stocks.
Consumer Discretionary and Industrials Come Alive
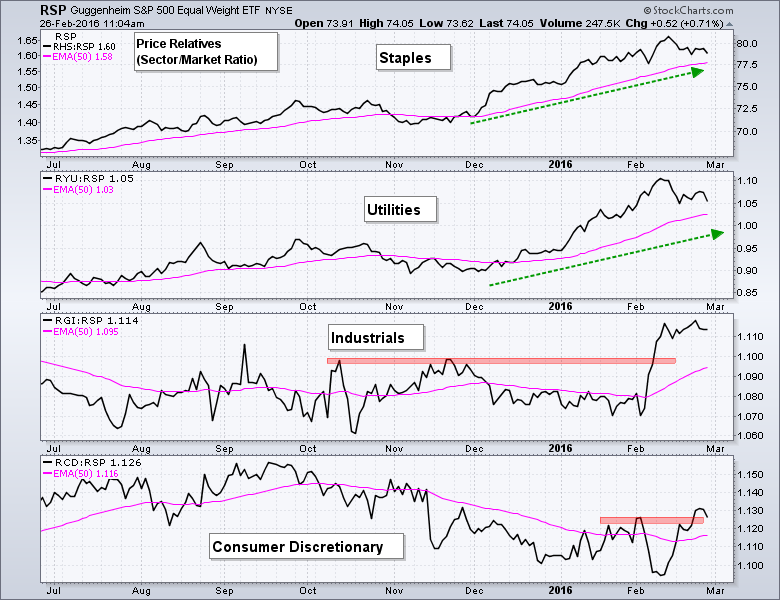
The next chart shows the price relatives for the nine equal-weight sectors. The price relative is a ratio chart that compares the performance of two symbols (i.e. RHS:RSP). I am using the equal-weight sectors because these sectors capture the performance of the "average: stocks in the sector and I am comparing each sector to the EW S&P 500 ETF (RSP). The EW Consumer Staples ETF (RHS) and EW Utilities ETF (RYU) are by far the strongest sectors overall. Their price relatives hit new highs in mid February and remain well above their 50-day moving averages. The EW Industrials ETF (RGI) is also showing some serious strength as the price relative surged to a multi-month high. More recently, the EW Consumer Discretionary ETF (RCD) is perking up as the price relative broke above the early February high. These are the four sectors we should focus on for bullish setups.
Finance and Energy Remain Laggards
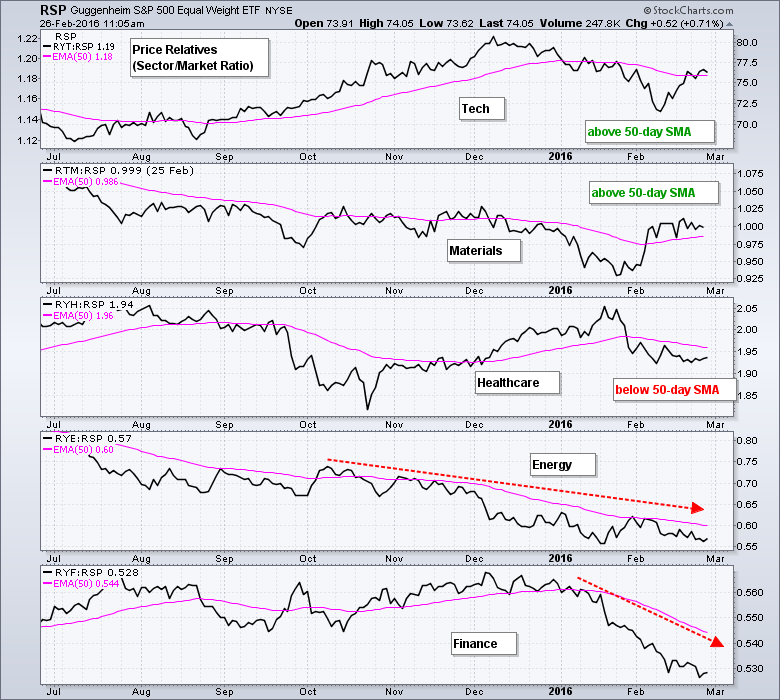
The next five sectors are either performing in line (tech, materials, healthcare) or underperforming (energy, finance). Note that the price relatives for the EW Technology ETF (RYT) and EW Materials ETF (RTM) moved above their 50-day SMAs in February. The price relative for EW Healthcare ETF (RYH) is below its 50-day SMA. The price relative for the EW Energy ETF (RYE) has been trending lower for well over a year and remains in a downtrend. The price relative for the EW Technology ETF (RYT) broke down in January and hit a new low this week. Relative weakness in the finance is the biggest concern in the stock market right now and could keep the broad market in check (flat).
Friday Food for Thought
Another Oil Crash Is Coming, and There May Be No Recovery (Tom Randall, Bloomberg)
It’s time for oil investors to start taking electric cars seriously. In the next two years, Tesla and Chevy plan to start selling electric cars with a range of more than 200 miles priced in the $30,000 range. Ford is investing billions, Volkswagen is investing billions, and Nissan and BMW are investing billions. Nearly every major carmaker—as well as Apple and Google—is working on the next generation of plug-in cars.
Facebook's Huge Plan to Shake Up Dull World of Telecoms (Stacy Higginbotham, Fortune)
Cisco isn’t going to like this. Facebook has teamed up with Nokia, Intel, and several telcos to create an open source hardware and software platform for the telecommunication industry designed to make it easier and faster to build communications networks. The program is modeled after a similar effort the social network created five years ago for its data center.
Dumb Alpha: Accelerating Momentum (Jaochim Klement CFA, Enterprising Investor)
While winning investments of the last three to five years tend to underperform as mean reversion kicks in and winning investments of the last month tend to underperform as well, winning investments of the last three to 12 months tend to outperform in the subsequent months.
Jon Steinberg launches Cheddar, a CNBC for millennials, with $3 million in Funding (Alyson Shontell, BusinessInsider)
But unlike most of today's media startups, which believe short viral Facebook clips or native Snapchat content will someday attract big ad dollars, Steinberg thinks the days of big audiences are over. Instead, he's focused on attracting a smaller, savvier audience — business-minded millennials. And he's going to try to hook them where people have traditionally watched video: on television.
Predicting Stock Market Returns Using the Shiller CAPE (Norbert Keimling, StarCapital AG)
Abstract: Existing research indicates that it is possible to forecast potential long-term returns in the S&P 500 for periods of more than 10 years using the cyclically adjusted price-to-earnings ratio (CAPE). This paper concludes that this relationship has also existed internationally in 17 MSCI Country indexes since 1979. In addition, the paper also examines the forecasting ability of price-to-earnings, price-to-cash-flow and price-to-book ratio, as well as that of dividend yield and of CAPE adjusted for changes in payout ratios. The results indicate that only price-to-book ratio and CAPE enable reliable forecasts on subsequent returns and market risks. In countries with structural breaks, price-to-book ratio even exhibits some advantages compared to CAPE.
Other Commentary Links
Bear Market Bounces - Understanding Bear Market Patterns, Signals and Retracements.
Measuring Risk On-Risk Off - Using charts to quantify stock, economic and credit risk.
PPO Trading Strategy - How to use 3 PPOs to develop a trend-reversion trading strategy.
Long-term Trend Indicators - Using the PPO, EMA Slope and CCI to determine the trend.
ETF Master ChartPack - 300+ ETFs organized in a Master ChartList and in individual groups.
Follow me on Twitter @arthurhill - Keep up with my 140 character commentaries.
****************************************
Thanks for tuning in and have a good day!
--Arthur Hill CMT
Plan your Trade and Trade your Plan
*****************************************


