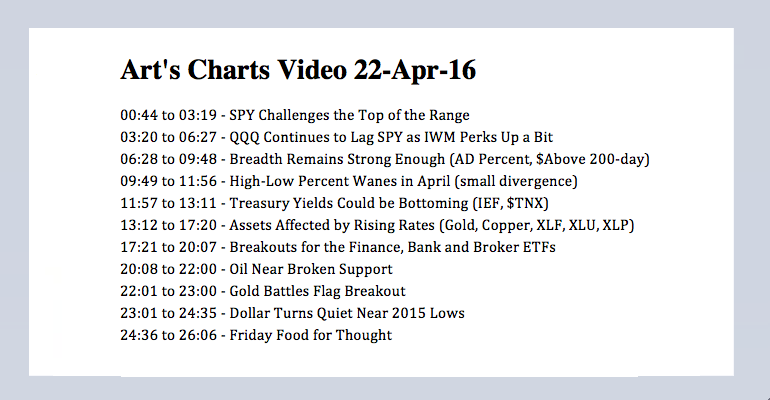
SPY Challenges the Top of the Range // QQQ Continues to Lag SPY // Breadth Remains Strong Enough // High-Low Percent Wanes in April // Treasury Yields Could be Bottoming // Assets Affected by Rising Rates // Breakouts for the Finance, Bank and Broker ETFs // Oil Hits Prior Support Breaks // Gold Battles Flag Breakout // Dollar Turns Quiet Near 2015 Lows // Friday Food for Thought ////
Large-caps continue to lead the stock market with the total-return Dow Industrials SPDR (DIA) and the total-return S&P 500 SPDR (SPY) hitting new all time highs. Total return is just another way of saying dividend-adjusted data. The S&P 500 and Dow Industrials remain around 2% from their all time highs. Even though small-caps and large-techs are lagging, the weight of the evidence remains bullish for stocks. Breadth remains on a bullish signal and more stocks are above their 200-day moving average than not. The stock market does seem overbought after a 10-week surge, but the ability to advance eight of the last ten weeks reflects strong buying pressure. This is why overbought is actually more bullish than bearish. It takes strong buying pressure to become overbought. Moreover, overbought conditions occur more often in uptrends than downtrends.
SPY Challenges the Top of the Range
SPY is trading near the top of an eighteen month range and the swing within this range is clearly up. After a steady advance from late 2011 to mid 2015, SPY moved into a rather volatile range with four double-digit swings. The downswings are marked with the breakdowns and both bottomed in the 180 area. The first upswing peaked near the 2015 highs and the current swing is back at these highs.
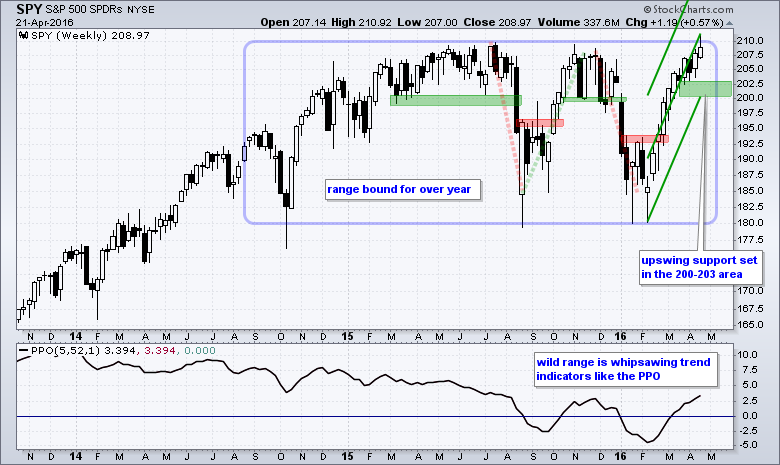
I remain focused on the current upswing for my directional bias. This upswing is quite steep so I am using a Raff Regression Channel to help define the move. Based on Thursday's close, the lower line ends just above 2000. There are also some candlestick lows in the 202-203 area from late March to early April. I will therefore mark support in the 200-203 area. A weekly close below 200 would call for a re-evaluation. The indicator window shows the PPO(5,52,1) moving above/below the zero line four times since August. Trend-following indicators get whipsawed during trading ranges. It is probably best to stick with the price chart at this stage.
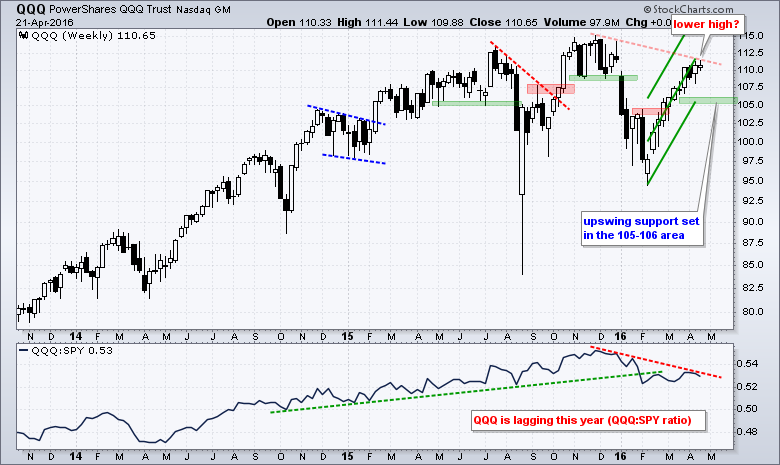
QQQ Continues to Lag SPY
QQQ is lagging SPY this year with a lower high and a weak price relative. QQQ led the market in late 2015 with a new high in November, but the ETF remains well short of this high now and lags SPY, which hit a new high this week. I could draw a head-and-shoulders pattern on this chart, but will refrain as long as the current swing remains up. The Raff Regression Channel and late March lows mark support in the 105-106 area.
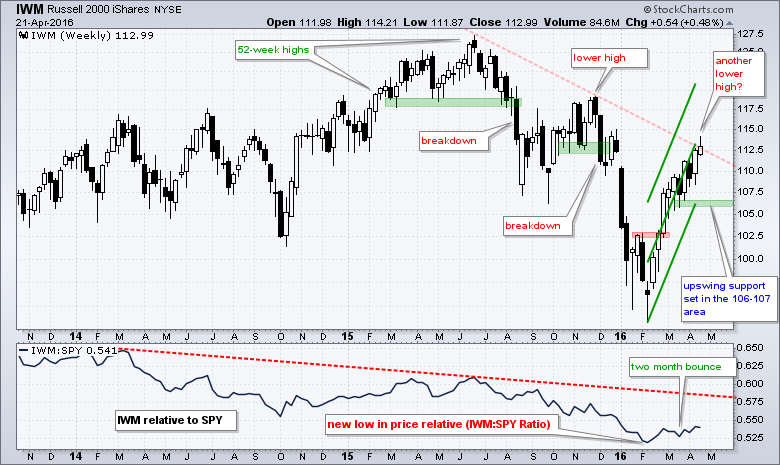
IWM still has the most negative long-term chart with a lower high November and a possible lower high here in April. The dashed red line marks these lower highs. For now, IWM remains in a strong upswing and I am marking support in the 106-107 area. The indicator window shows the price relative, which is the IWM:SPY ratio. IWM has outperformed SPY for around two months, but underperformed for over two years. In other words, the short-term relative performance trend is up, but the long-term trend is down.
Breadth Remains Strong Enough
I am in bull market mode because of the late February breakouts, the early March breadth thrust and the expansion of new highs. I do not now know long this bullish stance will last, but I do know what it would take to turn bearish. First, I would need to see support breaks in SPY, QQQ and IWM. Second, I would need to see a bearish breadth thrust. These two developments alone would be enough to turn bearish on the broader market. The third trigger would be a surge in new lows. Let's look at the breadth thrust first.
A bullish breadth thrust occurs when the 10-day EMA for S&P 1500 AD Percent ($SUPADP) moves above +30% and this signal remains valid until a move below -30%, which is a bearish breadth thrust. The signals are marked with the green and red dashed lines. These thrusts signal broad buying or selling pressure that is considered strong enough to start a trend. A bullish breadth thrust occurred on March 3rd and this signals remains in force.
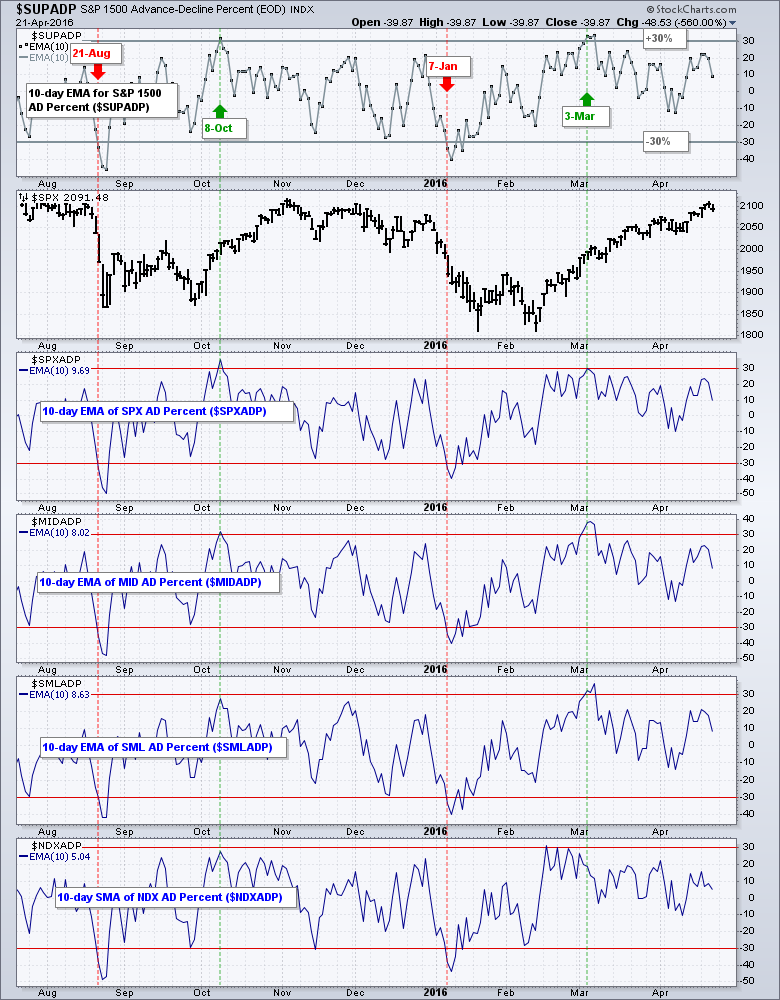
The other windows break down the S&P 1500 by showing breadth thrust indicators for the S&P 500, S&P MidCap 400, S&P Small-Cap 600 and Nasdaq 100. Sometimes one or two of these indicators will lead with a signal. None have yet to trigger a bearish signal, but the 10-day EMA for Nasdaq 100 AD Percent ($NDXADP) is clearly the least strong at +5.04%.
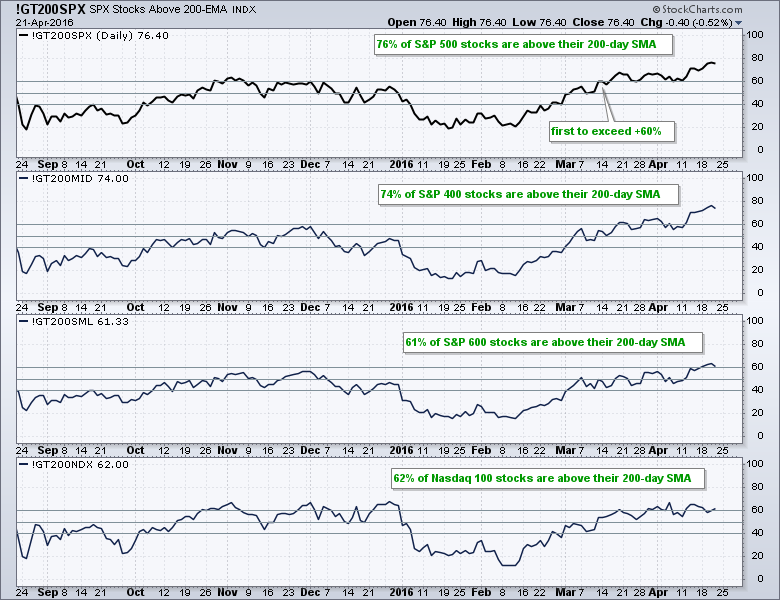
In other breadth news, here are the percentage of stocks above the 200-day moving average remains net bullish: $SPX (76%), $MID (74%), $SML (61%) and $NDX (62%). It is hard to have a bear market when the vast majority of stocks are above their 200-day moving averages. Small-cap breadth may be lagging, but it is not outright bearish. It is just less strong.
High-Low Percent Wanes in April
The High-Low Percent indicators remain net bullish, but I am seeing fewer new highs in April and this small divergence could foreshadow a correction. The top window shows the S&P 1500 and the second window shows S&P 1500 High-Low Percent ($SUPHLP). A move above +10% is bullish and remains so until a counter signal with a move below -10%. Again, these signals are built on the premise (assumption) that moves above +10% or below -10% show broad strength that signals the start of a sustained trend.
The indicator is not perfect, but it can help keep us on the right side of the market, which is more than half the battle. Notice that S&P 1500 High-Low Percent turned bearish on 21-Aug and did not trigger a bullish signal in October or November. A second bearish signal triggered on 7-Jan. This signal was countered with a bullish signal on 30-Mar. The bullish signal remains, but notice that High-Low Percent did not exceed +10% this week, even as the S&P 1500 hit a new high for he move. This is a small bearish divergence that shows less upside participation and this could foreshadow a correction in the stock market.
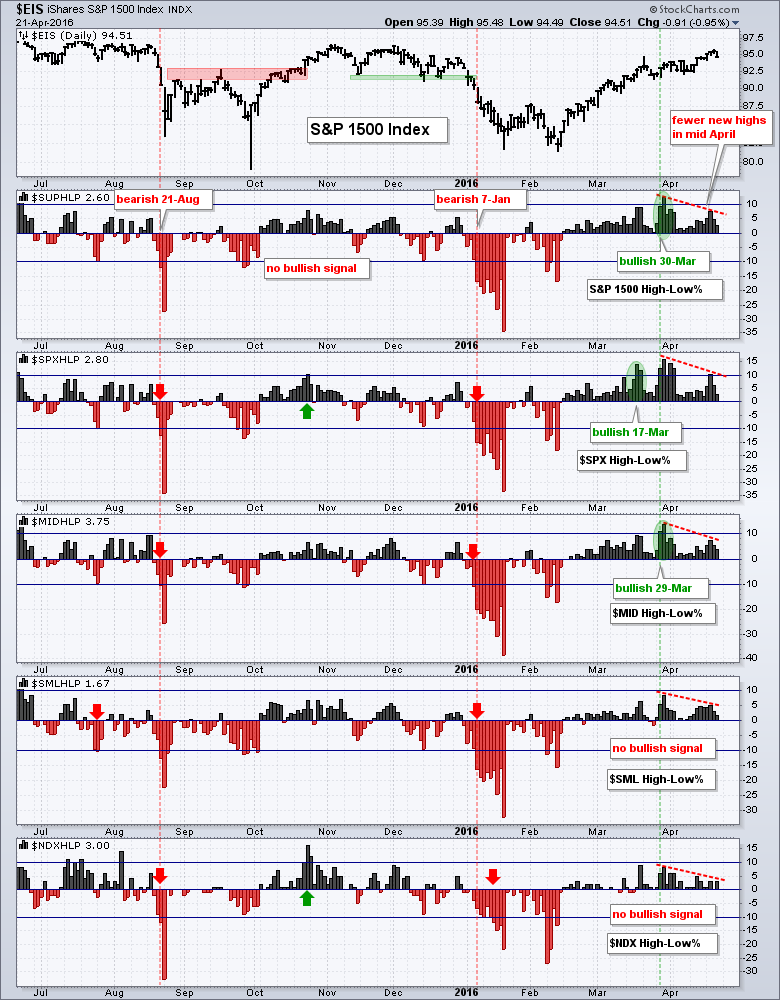
The other windows show High-Low Percent for the S&P 500, S&P MidCap 400, S&P Small-Cap 600 and Nasdaq 100. The late March signal was due to strength in S&P 500 HiLo% ($SPXHLP) and S&P 400 HiLo% ($MIDHLP). Notice that S&P 600 HiLo% ($SMLHLP) and Nasdaq 100 HiLo% ($NDXHLP) did not exceed +10% in late March and remain bearish. I do not consider this enough to turn bearish on the broader stock market though. The S&P 500 and S&P MidCap 400 represent 900 stocks and the S&P Small-Cap 600 represents 600 stocks. 900 is still greater than 600 and this means the weight of the evidence is bullish. Note that all stocks in the Nasdaq 100 are part of the S&P 500 so there is some double counting there.
Treasury Yields Could be Bottoming
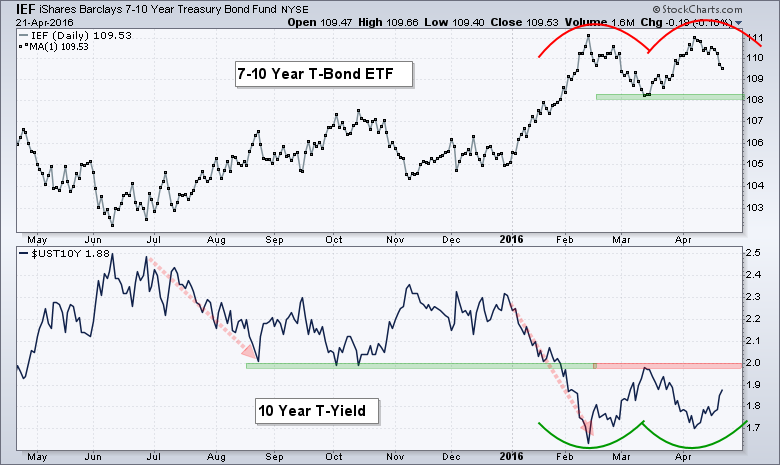
As far as the broader market is concerned, there have been two big developments over the last two weeks. First, the finance sector came to life and outperformed. Second, Treasury bonds came under intense selling pressure and Treasury yields surged. The 7-10 YR T-Bond ETF (IEF) is forming a potential double top with support in the 108 area, and the 10-YR Treasury Yield ($UST10Y) is forming a potential double bottom with resistance in the 2% area. The red lines with arrows show two big declines in the 10-yr Yield: late June to mid August and late December to mid February. These two declines corresponded with sharp declines in the stock market. It is, therefore, reasonable to assume that higher yields would be bullish for stocks overall.
Assets Affected by Rising Rates
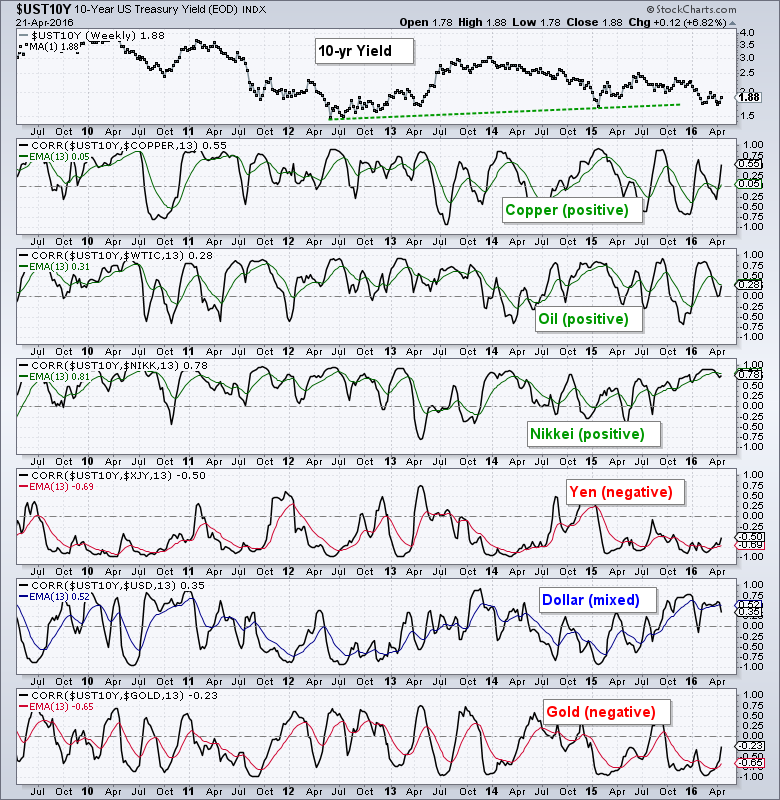
The next two charts measure the correlation between the 10-yr yield and various assets or ETFs. They are weekly charts with the 13-week Correlation Coefficient and a 13-week EMA of the Correlation Coefficient (red or green). Correlations are not always stable and they are subject to change. I am just showing these charts to give chartists an idea of how rising yields may affect other assets. As with any indicator, correlations are secondary to the price chart of the underlying asset.
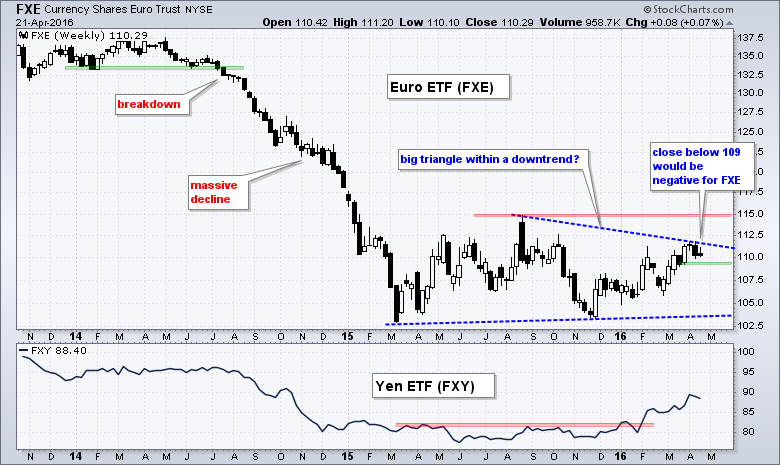
The first chart shows positive correlations between the 10-yr yield and copper, oil and the Nikkei 225. These three tend to rise when the 10-yr yield rises so we should expect these to outperform if the 10-yr yield rises. The Yen and Gold are negatively correlated for the most part. This means they tend to fall when the 10-yr Yield rises. Expect these to underperform if Treasury yields rise. The Dollar is mixed, but correlation has been positive over the last six months.
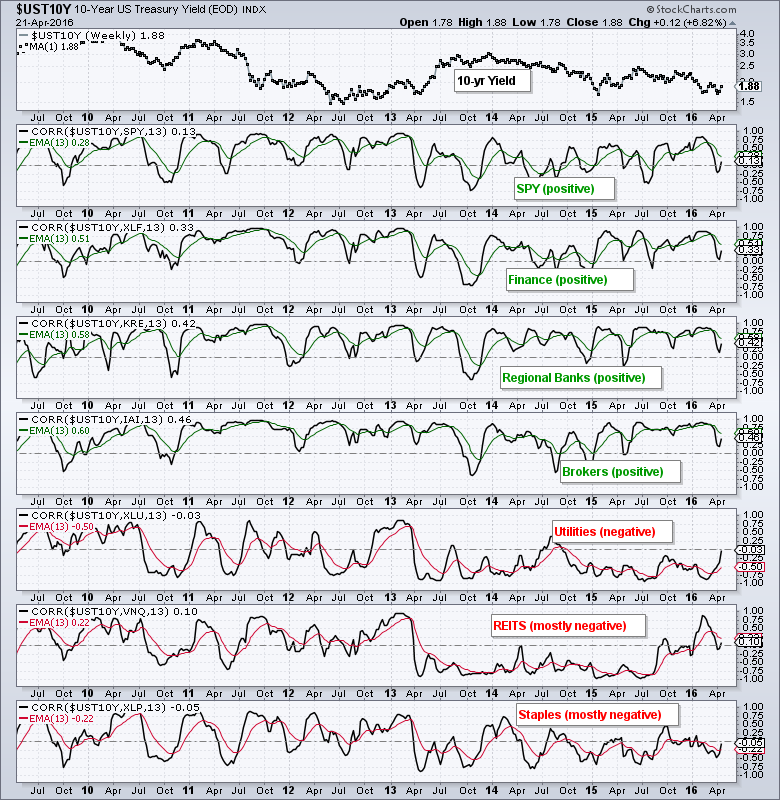
The next chart shows correlations for sector/industry group ETFs and there are some strong relationships. First and foremost, there is a strong positive correlation between the 10-yr yield and SPY. This positive correlation extends to the Finance SPDR, Regional Bank SPDR and Broker-Dealer iShares. Expect these to outperform if Treasury yields rise. The negative correlations are not as strong, but I would suggest a mostly negative correlation between the 10-yr yield and utilities, REITs and consumer staples. Expect these three to underperform if Treasury yields rise.
Breakouts for the Finance, Bank and Broker ETFs
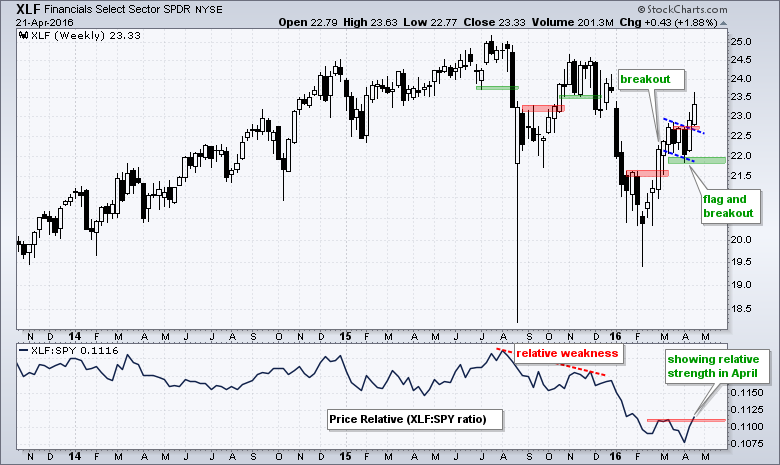
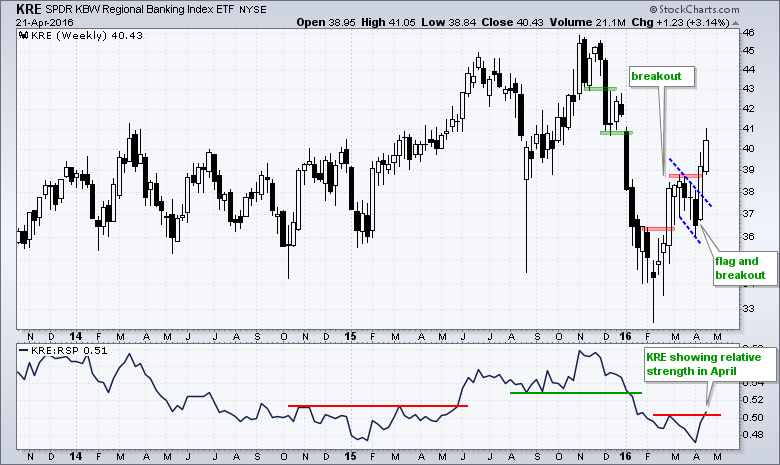
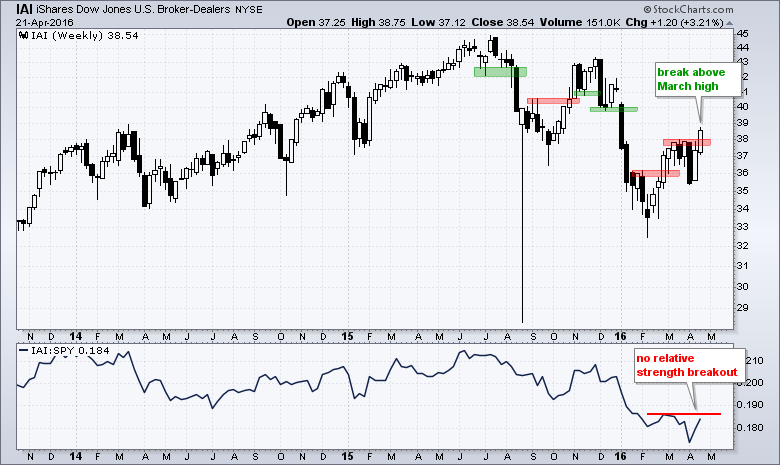
The Finance SPDR (XLF) got its second breakout with a move above flag resistance last week. The ETF followed through with further gains this week and the price relative broke above the March high. The first signs of relative strength are appearing in the finance sector and this is positive for the overall market. Note that the finance sector accounts for around 25% of the Russell 2000.
Oil Hits Prior Support Break
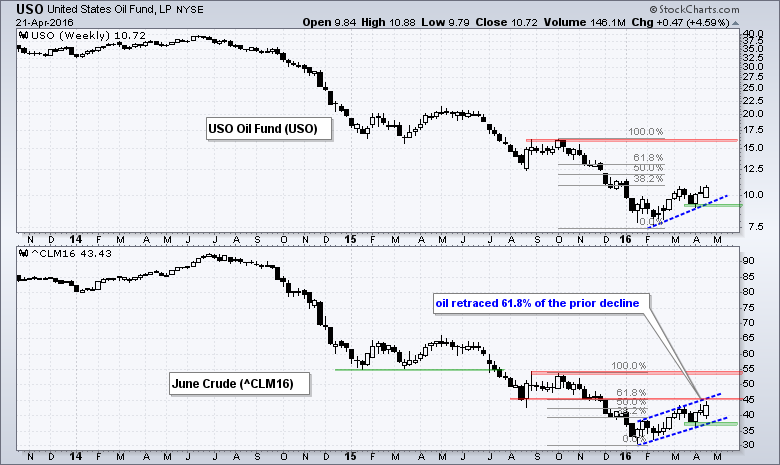
Oil is positively correlated with the 10-yr yield and in an uptrend over the last three months. Oil had a big week with a 4+ percent advance, but my overall assessment remains unchanged: this still looks like a bear market rally. Even though oil is up over 40% from its lows, the bottom window shows June crude retracing 61.8% of its prior decline with the move to the mid 40s. In other words, it is not even close to the October high/peak. Notice that broken support and the November consolidation combine to mark potential resistance in the 45 area. This is a make-or-break area for crude. For now, I will respect the three month uptrend and use the early April low to mark support. A close below this level would reverse the counter-trend rally and be bearish for crude.
Gold Battles Flag Breakout
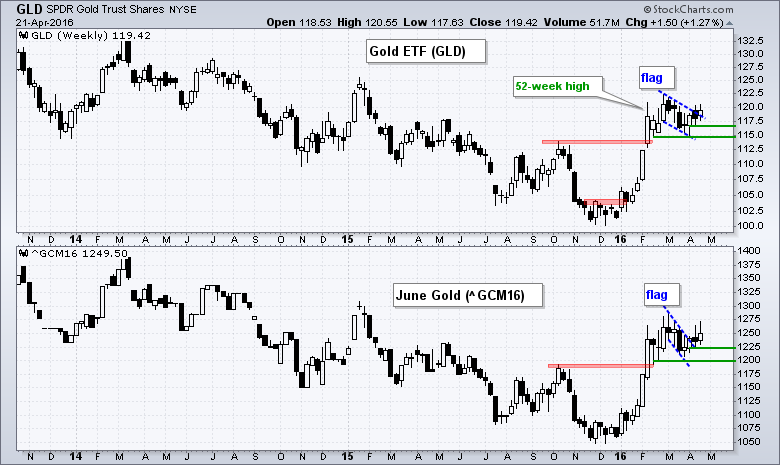
Things could get interesting for gold because it is negatively correlated with the 10-yr yield. This makes sense because rising Treasury yields are generally positive for the Dollar and a rising Dollar is negative for gold. On the price chart, gold has a flag breakout working and this breakout is holding. The Gold SPDR (GLD) surged above 120 each of the last two weeks, but fell back below 120 twice. A weekly close below last week's low (116.95) would negate the flag breakout. The flag low marks key support and a close below this level would be quite negative, especially if the 10-yr yield continues higher.
Dollar Turns Quiet Near 2015 Lows
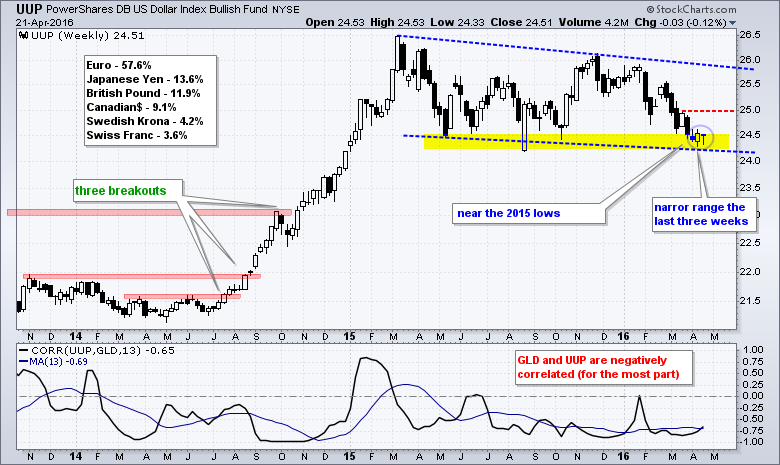
The Dollar continues to firm near the 2015 lows. The overall trend is down, but I am watching to see if the greenback can surge off this area. Notice that volatility has contracted with a rather tight range the last three weeks. A surge above 25 would forge a reversal/breakout and suggest that the 2015 lows will hold. We have to wait for a breakout at 26 for a longer-term trend reversal.
Friday Food for Thought
Economic check-in: Time to pay attention to inflation (Fidelity Viewpoints)
The U.S. economy has shrugged off fears of recession and looks healthy, while rising wages are pushing inflation higher. These dynamics suggest rising odds that we have begun a transition to the late phase of the business cycle, says Lisa Emsbo-Mattingly, Fidelity’s director of asset allocation research.
Are you ready for the Hot Potato? (MondaySense.ca)
If you’re more adventuresome and want a more active and somewhat unconventional approach, then the unabashedly momentum-based Hot Potato is worth exploring. Like the classic Couch Potato, it comes in several varieties and uses the same low-fee index funds (and exchange-traded funds) as building blocks. But the Hot Potato diverges significantly from the classic version because it employs shorter holding periods and focuses on a single asset class at a time. It adds a lot more zip to money management.
Mark Dow’s Emerging Market Play (ETF.com)
Emerging markets have been bouncing from multiyear lows in recent weeks. But there’s a lot to consider before buying into the notion that we have seen a bona fide bottom, according to Mark Dow. Dow is the founder of Dow Global Advisors, based in Laguna Beach, California. He is also the author of the Behavioral Macro blog and a frequent commentator in the financial media.
********************************************
Measuring Risk On-Risk Off - Using charts to quantify stock, economic and credit risk.
PPO Trading Strategy - How to use 3 PPOs to develop a trend-reversion trading strategy.
Long-term Trend Indicators - Using the PPO, EMA Slope and CCI to determine the trend.
ETF Master ChartPack - 300+ ETFs organized in a Master ChartList and in individual groups.
Follow me on Twitter @arthurhill - Keep up with my 140 character commentaries.
****************************************
Thanks for tuning in and have a good day!
--Arthur Hill CMT
Plan your Trade and Trade your Plan
*****************************************


