Small-caps, Junk Bonds and Risk Appetite // QQQ Forms Island Reversal // IWM Continues to Outperform // SPY Holds Breakout // HACK Consolidates after Big Surge // Seven Cyber Security Stocks to Watch ////
Small-caps, Junk Bonds and Risk Appetite
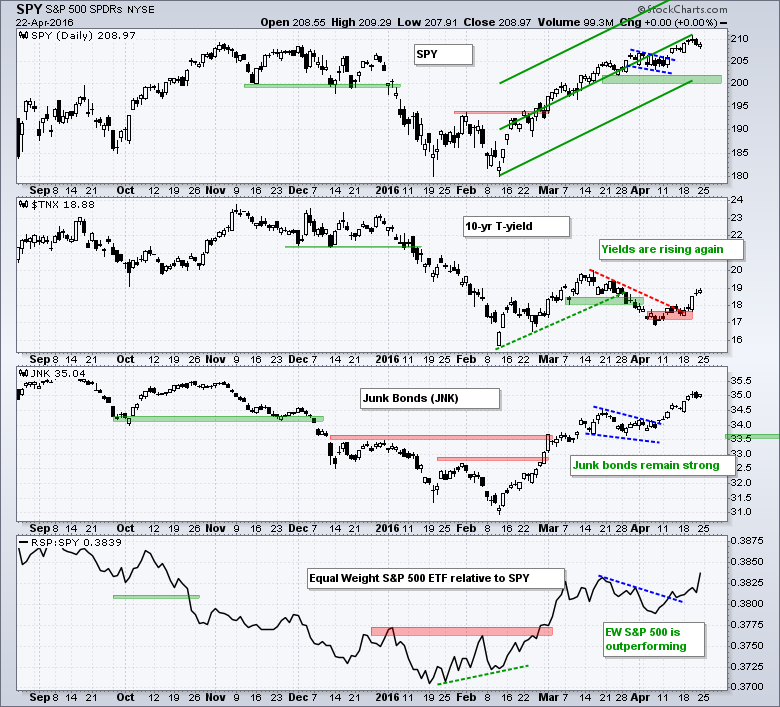
Even though the stock market may be ripe for a correction of some sort in the short-term, the overall environment remains bullish and the risk appetite is healthy. Even though QQQ was hit with a gap down and large-cap techs show relative weakness recently, the broad market remains in good shape and the appetite for risk remains strong. The 10-YR Treasury Yield ($TNX) turned back up with a breakout on Wednesday. This means money is moving out of safe-haven Treasury bonds and this money could find its way into riskier assets, such as stocks. Also note that the S&P 500 shows a strong positive correlation with the 10-YR Treasury Yield.
Elsewhere, the High Yield Bond SPDR (JNK) broke out of a small falling wedge pattern in early April and remains in a clear uptrend. Junks bonds are also riskier assets and they are positively correlated with stocks. The EW S&P 500 ETF (RSP) is outperforming the S&P 500 SPDR (SPY). This means the smaller stocks in the S&P 500 are outperforming the larger stocks. Smaller stocks have higher betas that reflect more risk. Relative strength in these stocks points to a healthy risk appetite in the stock market.
QQQ Forms Island Reversal
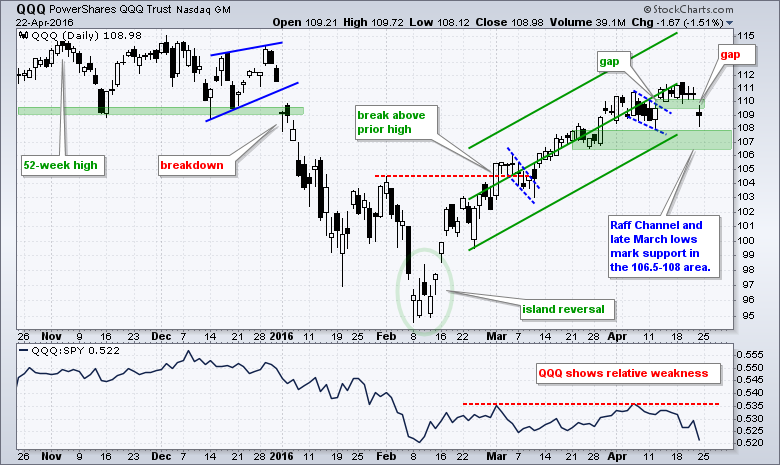
QQQ gapped down, filled the 13-April gap and negated the wedge breakout. Technically, the pattern since 13-April could be considered an island reversal. The gap down is short-term negative, but the overall trend is still up with key support marked in the 106.5-108 area. The indicator window shows the price relative falling the last two weeks and nearing the February low as QQQ underperforms SPY. Large-cap techs are not the place to be right now.
IWM Continues to Outperform
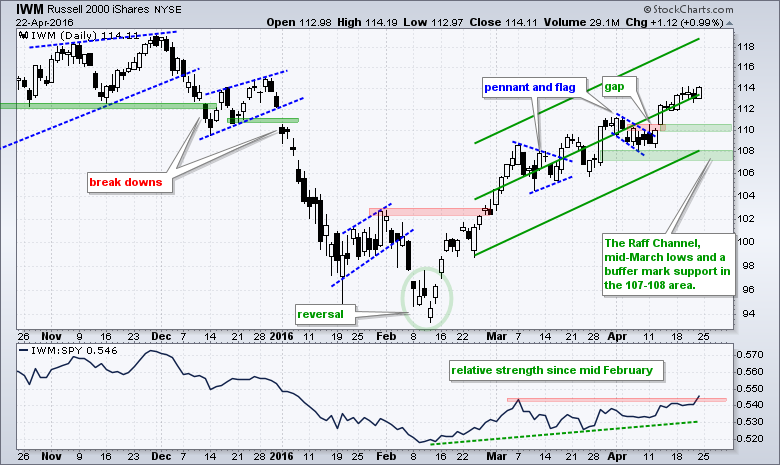
I am not too worried about the gap down in QQQ because the Russell 2000 iShares (IWM) is starting to outperform. Notice that IWM finished near its high for the week and the price relative exceeded its March high. In contrast to QQQ, IWM is holding its 13-April gap and outperforming. Small-caps represent the riskier end of the market and relative strength is bullish overall.
SPY Holds Breakout
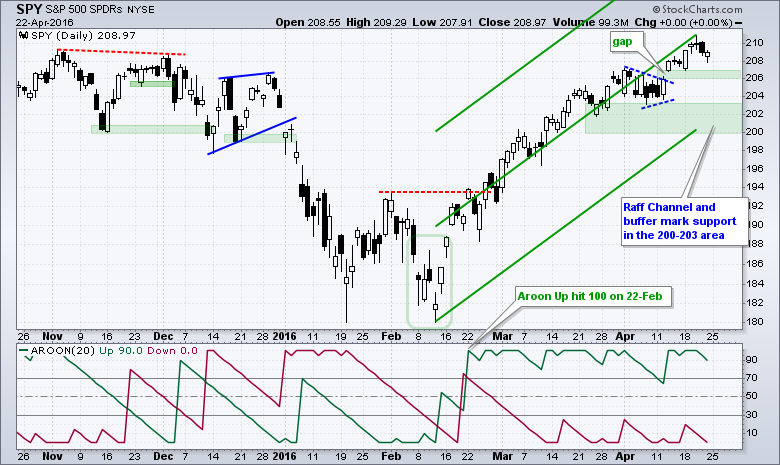
The S&P 500 SPDR gapped up on 13-April and broke pennant-wedge resistance. This gap is holding and first support is marked in the 206-207 area. Even though a break below 206 would be negative, I would still view any weakness as a correction within a bigger uptrend. The Raff Regression Channel and April lows mark key support in the 200-203 area.
HACK Consolidates after Big Surge
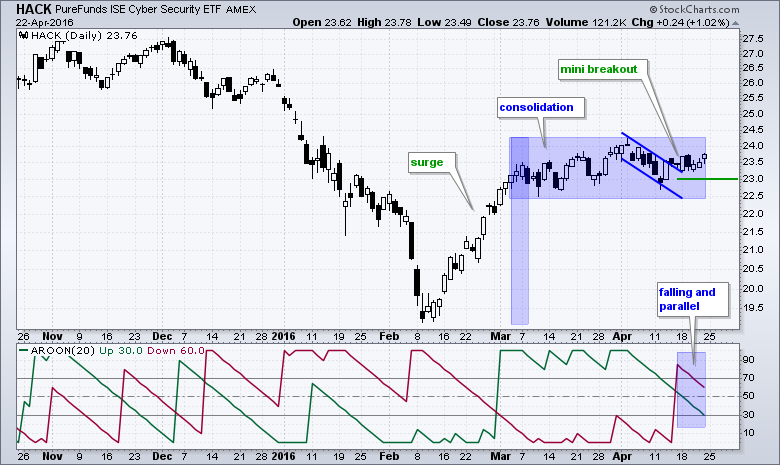
Even though technology is lagging overall, I am seeing some interesting price action in the Cyber Security ETF (HACK) and a few of its components. Basically, I see a surge from mid February to early March and then a consolidation (blue shading). Within this consolidation, there is a peak around 24 and then a pullback marked by the blue lines. HACK broke out with a move above 23.5 and this could be the first sign of a continuation higher. First support is set at 23 and a close below this level would call for a re-evaluation. The indicator window shows the Aroons falling in parallel fashion, which happens during a consolidation. The first to break back above 70 will trigger the next directional signal.
Seven Cyber Security Stocks to Watch
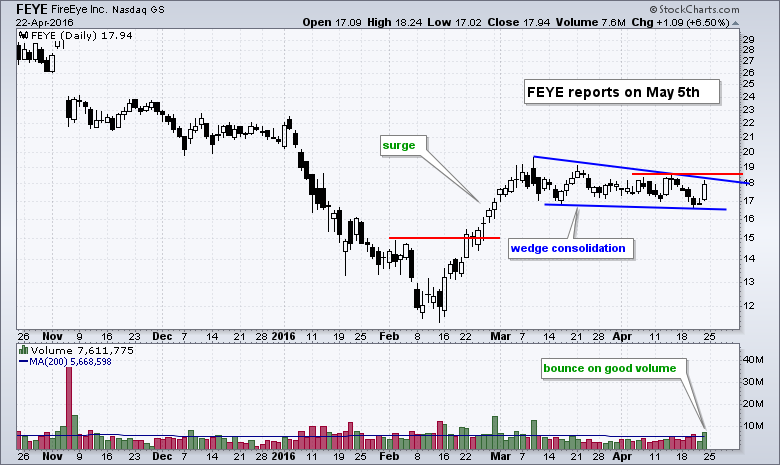
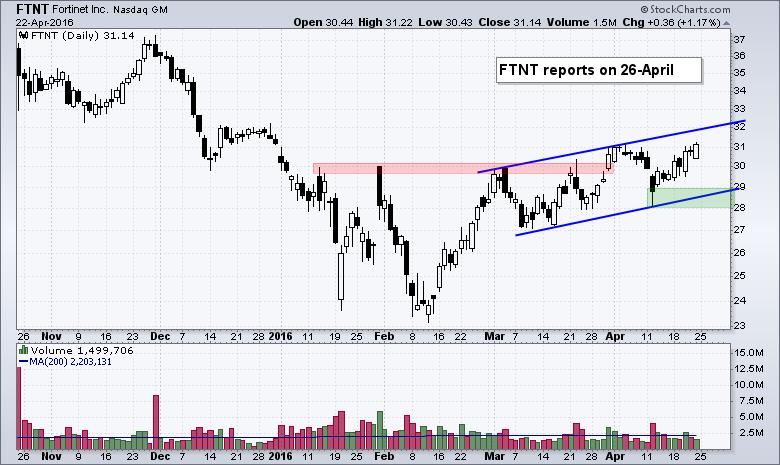
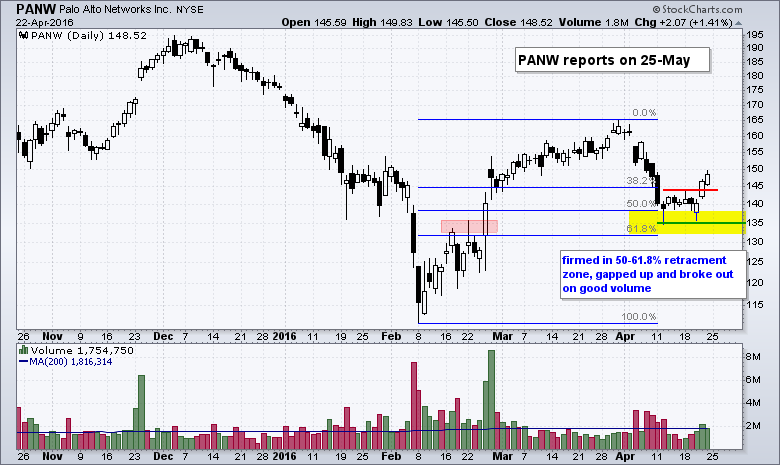
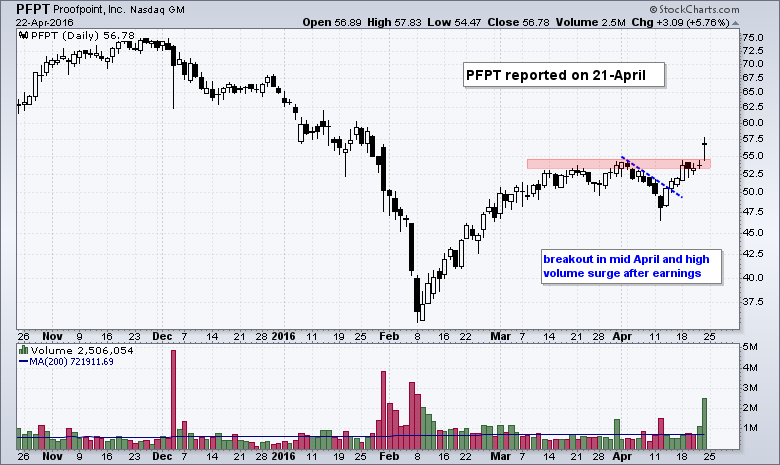
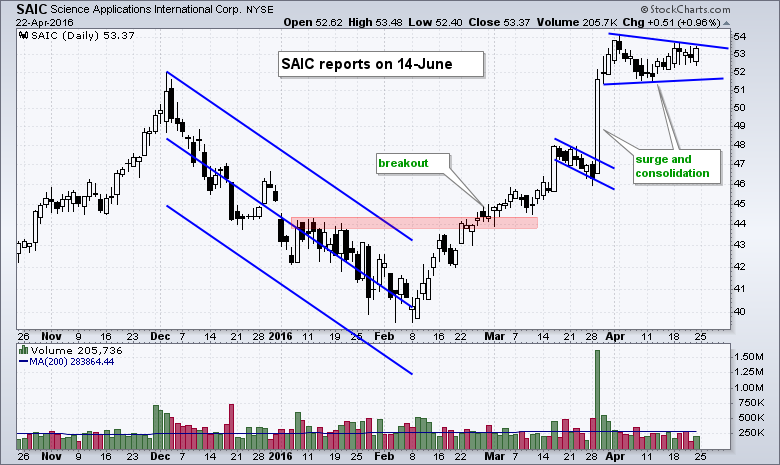
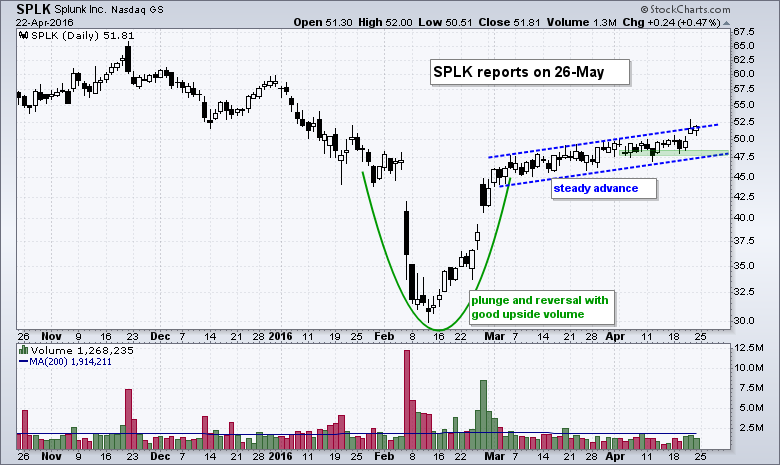
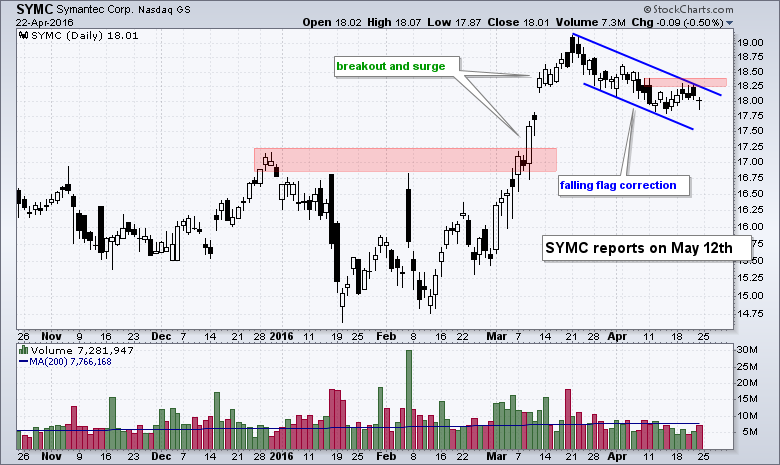
The next seven charts focus on stocks within the cyber security group. Keep in mind that we are in the middle of earnings season. Some report soon and others a little later so I added the reporting date to each chart. Overall, I see several surge-consolidation patterns working and upside breakouts would be bullish. Stocks that continued higher after the February surge show relative strength, such as FTNT and SPLK. SAIC is clearly the strongest of the group because it is close to a 52-week high.
****************************************************
Measuring Risk On-Risk Off - Using charts to quantify stock, economic and credit risk.
PPO Trading Strategy - How to use 3 PPOs to develop a trend-reversion trading strategy.
Long-term Trend Indicators - Using the PPO, EMA Slope and CCI to determine the trend.
ETF Master ChartPack - 300+ ETFs organized in a Master ChartList and in individual groups.
Follow me on Twitter @arthurhill - Keep up with my 140 character commentaries.
****************************************
Thanks for tuning in and have a good day!
--Arthur Hill CMT
Plan your Trade and Trade your Plan
*****************************************

