Oil Hits Resistance in Retracement Zone // Energy and Finance Lagging Overall // XLE Forms Yet Another Wedge // Short-term Breakout Holding for XLE // Oil & Gas Equip & Services SPDR Lags XLE ////
Oil Enters Potential Reversal Zone
In Friday's commentary, I noted that oil was in a long-term downtrend and the current bounce looked like a bear market rally. To recap, June Crude (^CLM16) hit new lows in January and then retraced around 50% of the October-January decline with a bounce the last few months. It is normal for a counter-trend bounce to retrace 38.2-61.8 percent of the prior decline. This is why chartists should become wary when the big trend is down and a bounce enters the 50-61.8 percent retracement zone. This zone represents a potential reversal area that could signal the end to the counter-trend bounce and a continuation of the prior decline.
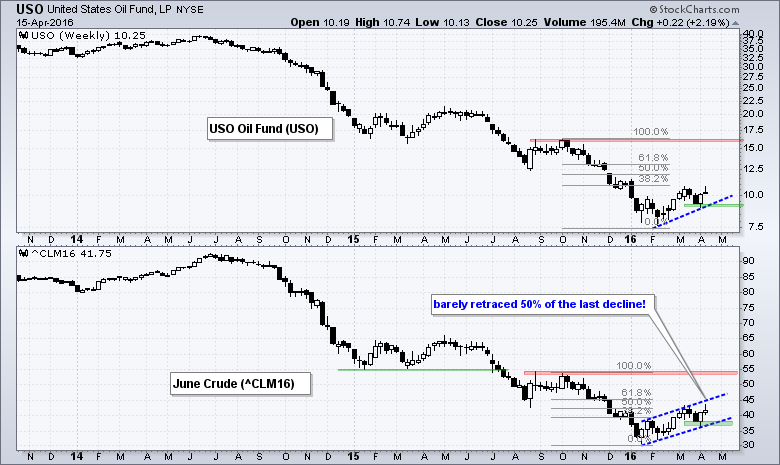
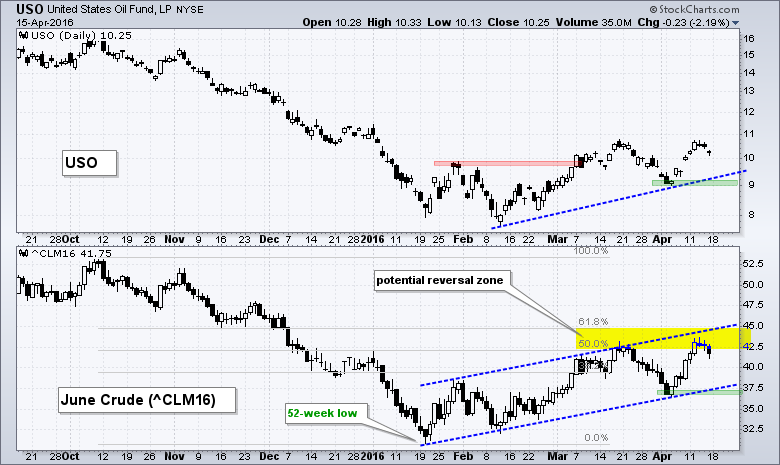
The chart above shows the USO Oil Fund (USO) in the top window for reference and June Crude in the bottom window for analysis. A channel formed the last few months and this channel defines the current advance. Notice that crude is not even close to its October peak and this bounce is just a blip compared to the overall downtrend. The next chart shows candlesticks over the last seven months for a little more granularity. June Crude hit some resistance (selling pressure) in the 43 area in mid March and again here in mid April. Top pickers are looking for a reversal now. Trend traders would watch for a break below the early April low (36.5) to reverse the three month uptrend.
Energy and Finance Lagging Overall
As noted on Friday, if crude is looking vulnerable then I would be wary of energy stocks. The image below shows scan results for the nine sector SPDRs and SPY. I am ranking these results by the value of the 125 period Fast Stochastic Oscillator to measure chart strength (Rank by Fast Stoch %K(125,1). The Stochastic Oscillator tells us the level of the close relative to the high-low range. A reading of 100 means the current price is at a 6-month high, a reading of 0 means the current price is at a 6-month low and a reading above 50 means the current price is in the middle of its six month range.
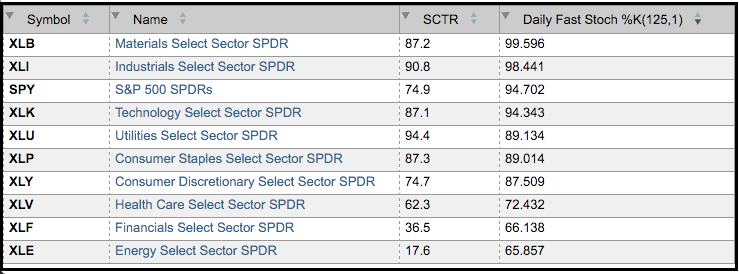
The Materials SPDR (XLB) and Industrials SPDR (XLI) have values above 98 and this means they are near six month highs. The Finance SPDR (XLF) and Energy SPDR (XLE) have values near 66. This means they are just above the mid point of their six month range. I am ranking my scan results by the Fast Stochastic Oscillator and you can see that XLF and XLE are at the bottom. The tells me that they have had the weakest bounces over the last six months. Also notice that their SCTRs are by far the lowest and XLE has an SCTR below 20.
XLE Forms Yet Another Wedge
On the price chart, XLE is challenging the 52-week EMA with a rising wedge for the fourth time since October 2014. The overall trend is clearly down and this wedge represents a counter-trend rally. One of these counter-trend bounces will eventually result in a bigger trend change, but this one has yet to do the trick. XLE forged a 52-week low in January and remains well below the early November peak around 70. The March-April lows mark wedge support and a break below this support zone would reverse the three month uptrend. The indicator window shows RSI in the 50-60 zone, which marks momentum resistance during a downtrend.
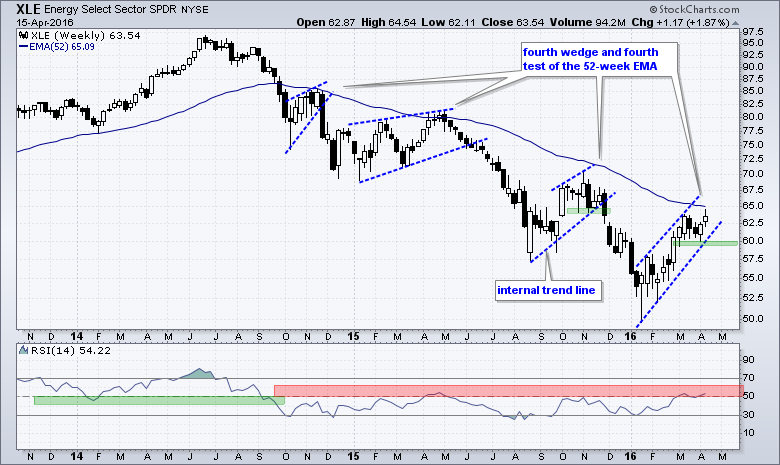
Caveat emptor! I will be the first to admit that this bearish setup looks too good and too obvious. The last three wedge breakdowns worked to perfection and patterns often stop working just when you identify them. It is the nature of markets.
Short-term Breakout Holding for XLE
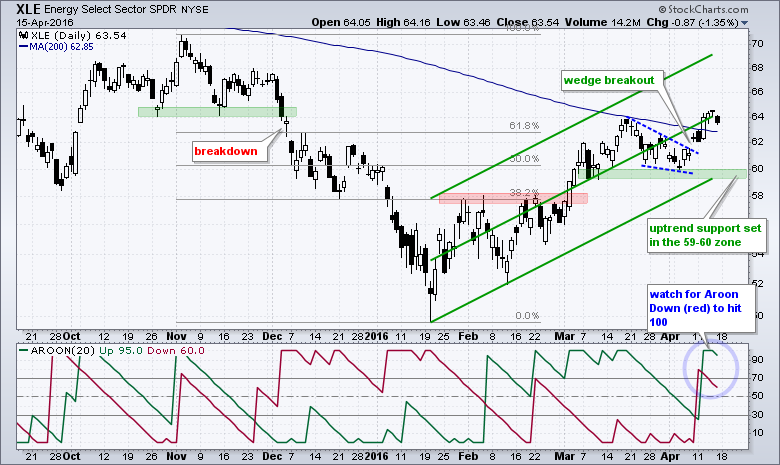
Looking at the daily chart, XLE broke wedge resistance with a gap above 62 on April 8th and this gap is holding. The ETF is also just above the falling 200-day moving average. This chart is bullish right now. Here are three things to watch for a breakdown. The first sign of weakness would be a move below 61 and filling of the gap. This would negate the wedge breakout. The Raff Regression Channel and March-April troughs mark support in the 59-60 area. A close below this zone would reverse the three month uptrend. The Aroon indicators remain bullish because Aroon Up was the last one to hit 100. Look for Aroon Down to surge to 100 to signal a trend reversal.
Oil & Gas Equip & Services SPDR Lags XLE
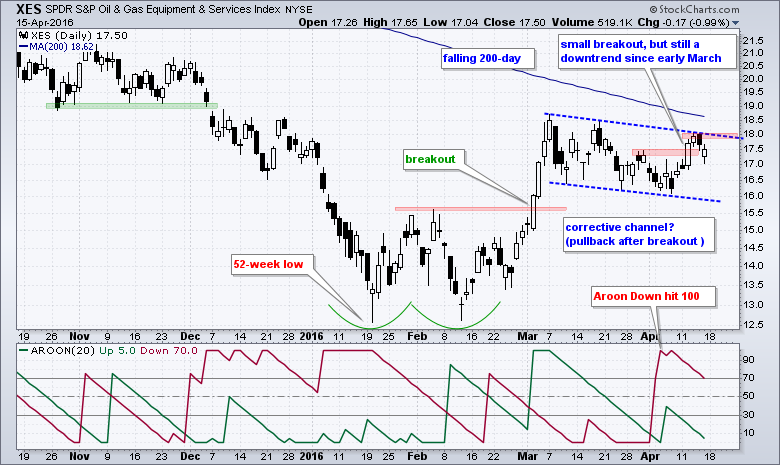
The Oil & Gas Equip & Services SPDR (XES) is lagging XLE and crude oil. Note that I do not need an indicator to make this assessment. XLE and June Crude exceeded their March highs in April, but XES did not and this shows relative "chart" weakness. Also note that XES remains below its 200-day moving average. One the price chart, XES got a small breakout last Tuesday, but remains within a falling channel since early March. A little follow through is needed to complete this breakout. Barring a break above 18.1, XES has a bearish tilt right now because of the falling channel. Also notice that the last Aroon signal was bearish because Aroon Down hit 100 in early April. Thus, XES needs to break 18.1 and Aroon Up needs to hit 100 to put the bulls back on track. You can read more about the Aroon indicators in our ChartSchool.
Measuring Risk On-Risk Off - Using charts to quantify stock, economic and credit risk.
PPO Trading Strategy - How to use 3 PPOs to develop a trend-reversion trading strategy.
Long-term Trend Indicators - Using the PPO, EMA Slope and CCI to determine the trend.
ETF Master ChartPack - 300+ ETFs organized in a Master ChartList and in individual groups.
Follow me on Twitter @arthurhill - Keep up with my 140 character commentaries.
****************************************
Thanks for tuning in and have a good day!
--Arthur Hill CMT
Plan your Trade and Trade your Plan
*****************************************


