Dow Breaks out of Massive Triangle // Sectors Close to 52-week Highs // Sector High-Low Leaders // XLK is the Clear Leader // Finance Perks Up with Flag Breakout // Healthcare Challenges Channel // Silver Hits Resistance // Dollar Firms at Support // Oil: A Bounce within a Downtrend ////
Dow Breaks out of Massive Triangle
The chart below shows the dividend adjusted Dow Diamonds (DIA) in the top window and the Dow Industrials ($INDU) in the bottom window. By default, StockCharts adjusts stock and ETF data for dividends by adding them back into the price. A stock declines by the dividend amount when it goes ex-dividend. This dividend was paid to the shareholder and does not represent an actual loss. It is, therefore, added back to the price data.
The chart below shows DIA equaling its May 2015 high at 179.37 this week. The Dow Industrials, which does not include dividends, remains short of this high and is currently trading near the early November high. The chart patterns are pretty much the same as both formed huge triangle consolidations and broke above the upper trend line over the last few weeks. As the risk of sounding bullish, note that both hit all time highs in May and these triangles represent big consolidations within an uptrend. The breakouts signal a continuation higher.
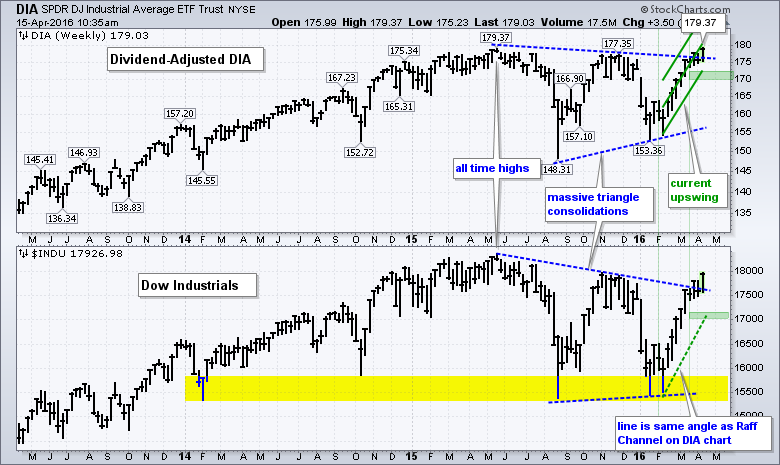
At what point would I become concerned that the breakout is failing and a bigger top is forming? The Dow has come quite far over the last nine weeks with a 10+ percent advance. This is a strong move and we could see a pullback or consolidation at some point. I drew a Raff Regression Channel on the DIA chart to help define this advance. The lower line, the March low and a buffer mark support in the 170-173 area. A weekly close below 170 would reverse this upswing and suggest that the breakout has failed. This is equivalent to 17000 for the Dow Industrials. Even though 170 and 17000 may seem far away, they are just 5% below current levels.
Sectors Close to 52-week Highs
Note that five of the nine sector SPDRs are within 3% of a 52-week high (XLI, XLK, XLP, XLY and XLU). It is hard for the S&P 500 to be in a downtrend when the majority of its sectors are so close to a 52-week high. Together, these five uptrends represent around 57% of SPY and this is enough strength to power the market higher.
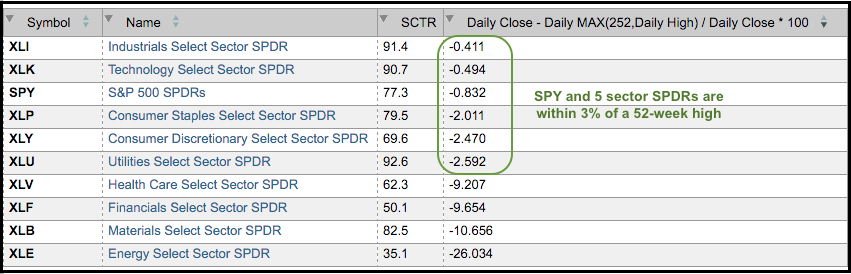
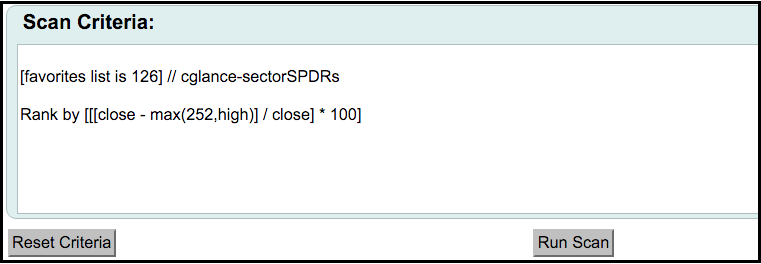
You can run this scan on any ChartList using the following Scan Criteria: Rank by [[[close - max(252,high)] / close] * 100]. In a separated, but related note, 244 (~16%) of the 1500 stocks in the S&P 1500 are within 3% of a 52 week high. Anything near a 52-week high is leading the market right now.
Sector High-Low Leaders
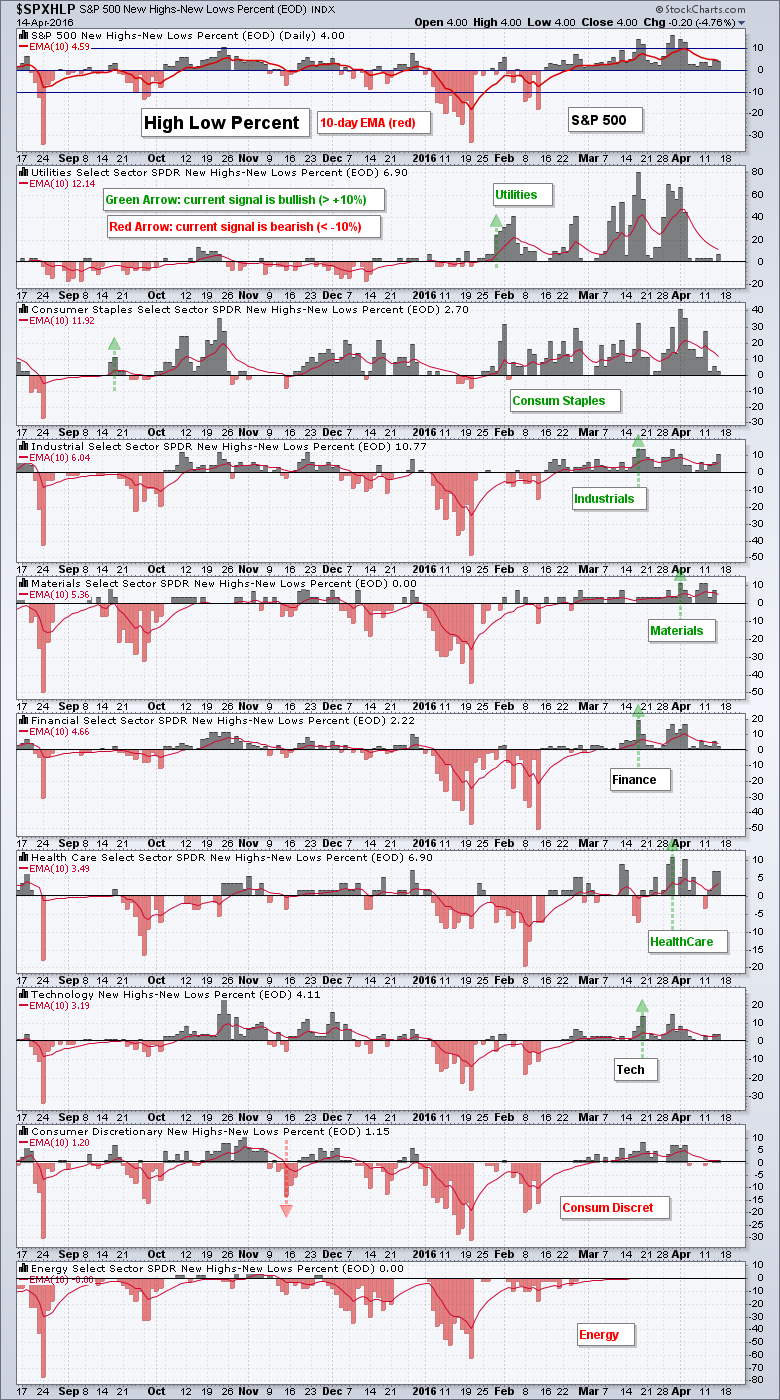
Chartists can gauge sector participation by comparing the High-Low Percent indicators. High-Low Percent is positive when new highs outnumber new lows and negative otherwise. Sectors with the highest High-Low Percent have the most new highs (as a percentage of the sector). I also use +10% as a bullish threshold and -10% as a bearish threshold. Currently, seven of the nine sectors are net bullish because last High-Low Percent signal was a cross above +10% (green arrows). Energy and consumer discretionary are still net bearish because the last signal was a move below -10%. The chart below shows these indicators with a 10-day EMA (red line). The sectors are sorted by the value of the 10-day EMA and this gives us a ranking of sorts. Even though finance and healthcare are lagging, their High-Low Percent indicators are in bull mode. The Healthcare High-Low% ($XLVHLP), in particular, exceeded +10% in late March and late April. Thus, there are some leaders in this sector. The new highs in the finance sector come from REITs. The energy sector has yet to produce any new highs and the consumer discretionary is also relatively lame in the new high category.
XLK is the Clear Leader
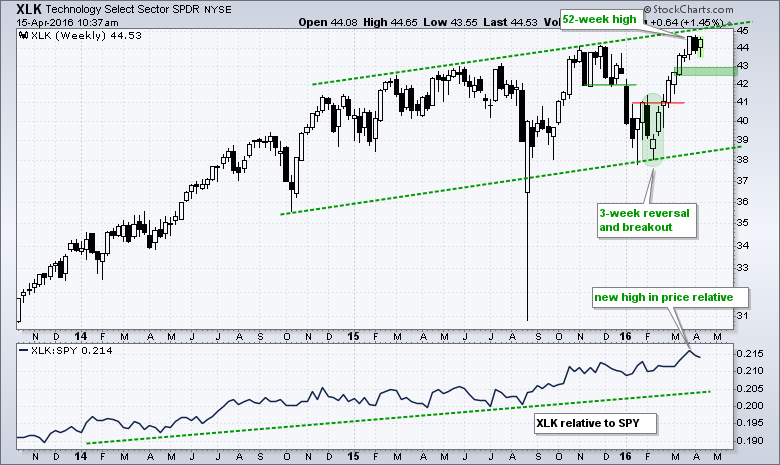
The Technology SPDR (XLK) remains one of the strongest sectors right now with a 52-week high last week. There is a clear rising channel present since October 2014 and the 10-week swing within this channel is up. I am marking upswing support at 42.5-43. I think 43 is too tight and prefer to add a little buffer. XLK is showing relative strength because the price relative hit a new high in late March.
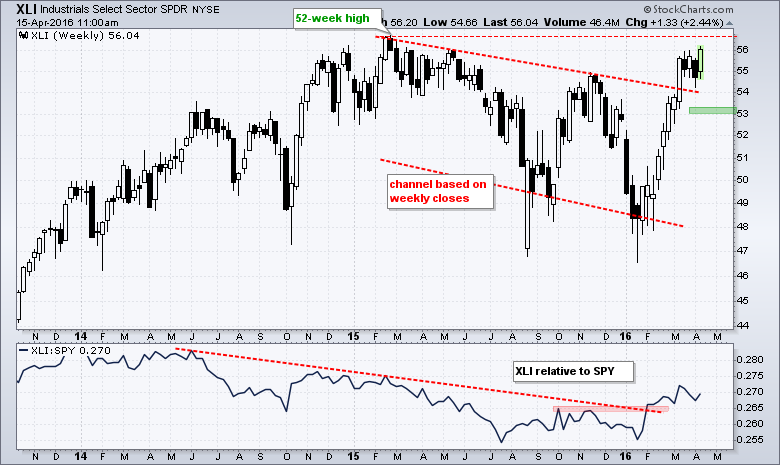
The Industrials SPDR (XLI) is also leading with a channel breakout and a breakout in the price relative (XLI:SPY ratio). XLI did not hit a 52-week high, but is just a few cents short and should hit a new high in the coming weeks. I am marking support at 53. A weekly close below this level would negate the channel breakout and call for a reassessment.
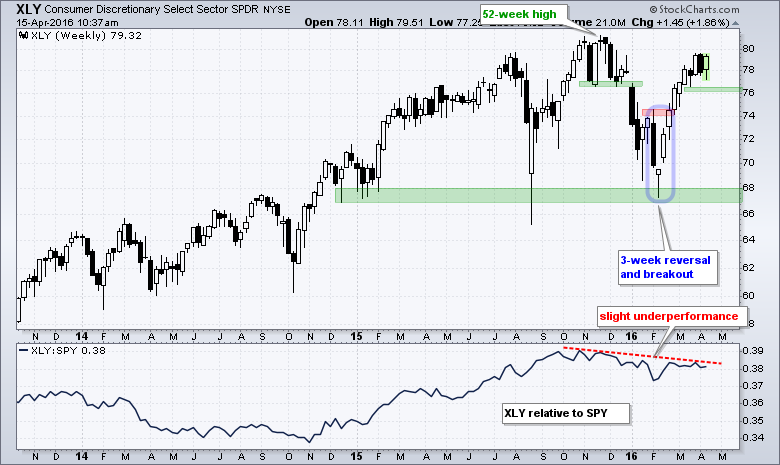
The Consumer Discretionary SPDR (XLY) may be lagging, but the ETF is close to a 52-week high (~2.5%). As with XLI and XLY, the active pattern is the three week reversal and breakout in February. This pattern is currently bullish and it has yet to be proven otherwise with some sort of bearish pattern. XLY continued higher in March and remained strong in April. Thus, XLY remains bullish and I am marking support at 76. XLY is not as strong as XLI and XLK because the price relative remains in a slight downtrend and it is slightly underperforming SPY.
Finance Perks Up with Flag Breakout
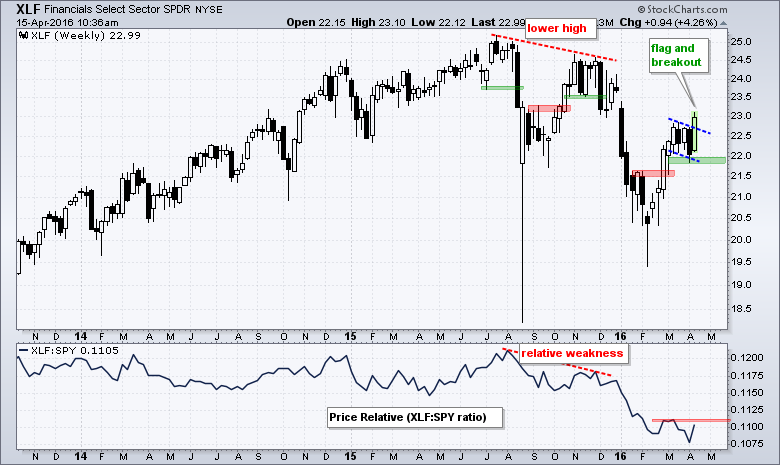
The Finance SPDR (XLF) surged this week and broke above consolidation resistance. Overall, the ETF surged above resistance in February and then consolidated for three weeks. The blue lines mark a falling flag of sorts. The ETF broke out with a 4% surge so far and I will raise support to the 21.8-22 area. Despite this breakout, XLF is still lagging overall and the price relative has yet to break above its early March high.
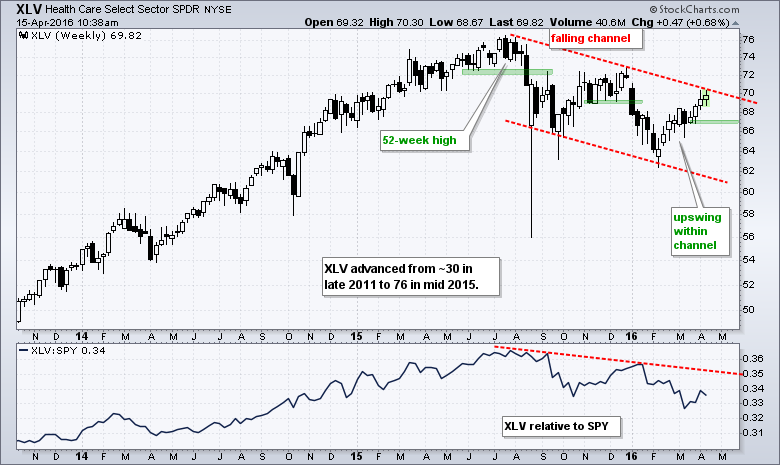
Healthcare Challenges Channel
The HealthCare SPDR (XLV) may be lagging, but note that the ETF is up eight of the last nine weeks and challenging the channel trend line. Keep in mind that XLV was around 30 in late 2011 and surged around 150% the next three and a half years. The falling channel represents a downtrend and the swing within this downtrend is up. I am marking upswing support at 66.70.
Silver Hits Resistance
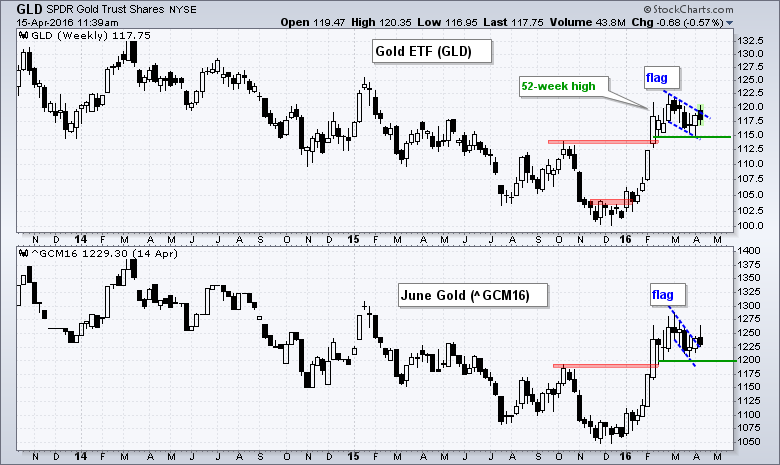
Gold got cold feet this week as the flag breakout failed to hold. The chart below shows the Gold SPDR (GLD) in the main window and June Gold (^GCM16) for comparison. GLD hit a 52-week high in February, fell back in March and tried to breakout in April. The breakout is not holding, but the overall trend remains up and there is still a lot of support in the 115-117 area. A close below 115 in GLD and 1200 in June Gold would call for a reassessment.
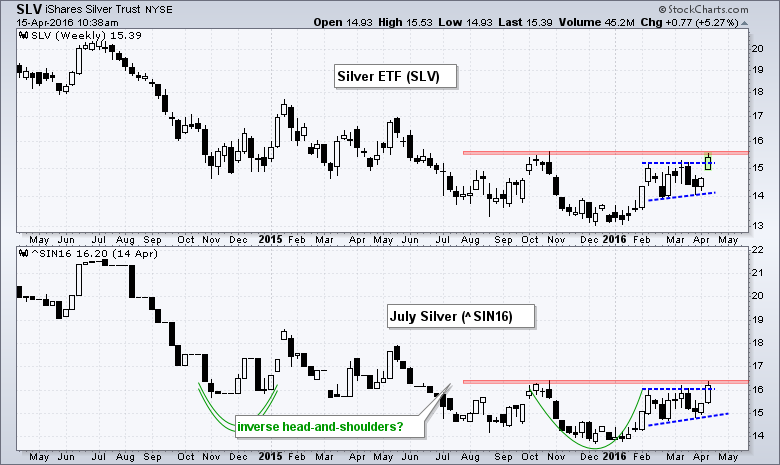
 The Silver ETF (SLV) and July Silver (^SIN16) could be tracing out an inverse head-and-shoulders pattern. It is not a picture-perfect pattern, but the essence of the formation is clear. Both are challenging resistance from the October high and a breakout would be quite bullish for this hybrid metal (industrial/precious). The Feb-Mar pattern looks like an ascending triangle and both are breaking above resistance.
Dollar Firms at Support
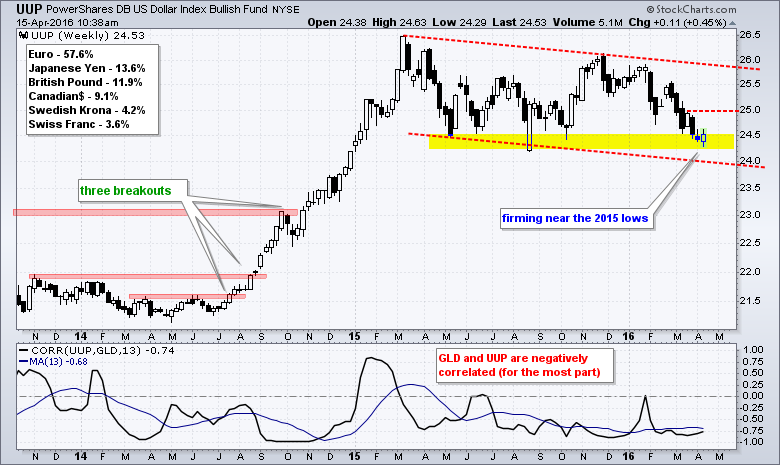
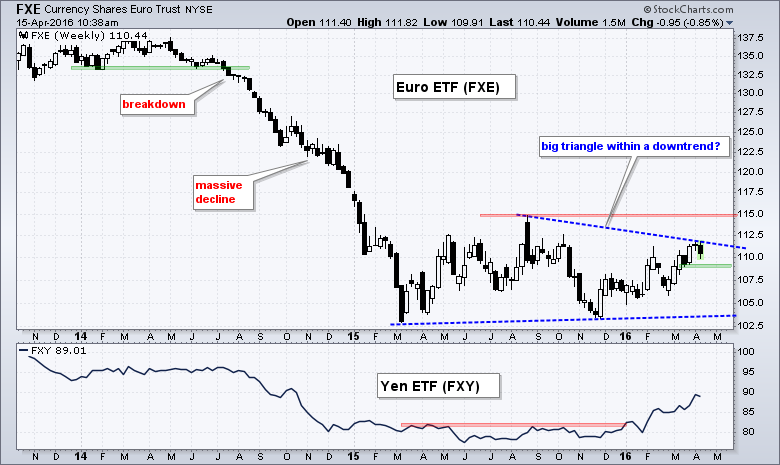
The US Dollar ETF (UUP) could have some effect on gold because there is a strong negative correlation between the two. The chart shows UUP within a falling channel and this downtrend supports an uptrend in bullion. Notice, however, that UUP firmed at the 2015 lows last week and bounced this week. It is not enough to turn bullish just yet. Look for a surge above 25 to show follow through and provide the first bullish sign.
Oil: A Bounce within a Downtrend
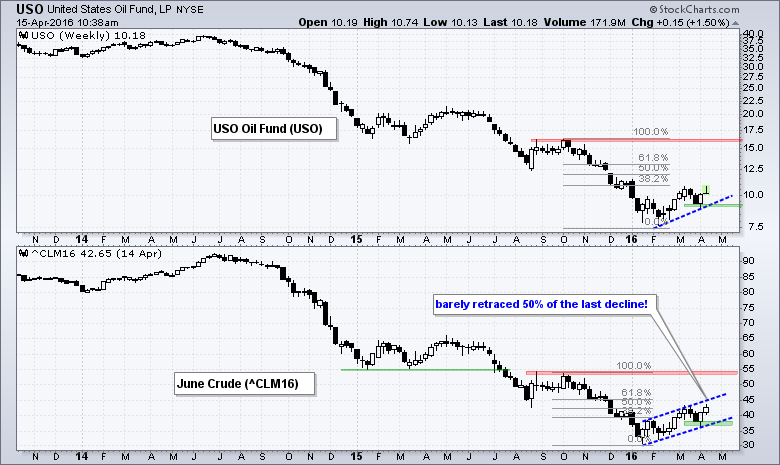
The 2016 trend for oil is up, but the long-term trend remains down. The top window shows the USO Oil Fund (USO) and the bottom window shows June Crude (^CLM16) for the hard numbers. I would not use USO or $WTIC for analysis because they have tracking and adjustment issues. Even though June Crude is up over 30% from mid January to mid April, the current rally has retraced barely 50% of the prior decline (Oct-Jan) and oil remains well below the October high. The last low was a 52-week low and we are not even close to a 52-week high. I am using a channel to define the three month uptrend and mark support in the 36.5-37 area. A close below 36.5 would reverse this advance and signal a continuation of the long-term downtrend. This chart tells me to still be wary of energy-related stocks.
Friday Food for Thought
Barry Ritholtz interviews Tom Dorsey, who has been influential in P&F charting and systematic relative strength.
This Simple Indicator Makes Money Again and Again - System Trader Success
Here we are four months into 2016 and I’ve not updated some of the more interesting articles. One of those is Connors’ 2-period RSI strategy. This is a very popular trading method by Larry Connors and Cesar Alvarez. We all know there are no magic indicators but there is an indicator that certainly acted like magic over several decades. What indicator is it? Our reliable RSI indicator.
The Double Edged Sword of Trend Following ETFs - FMD Capital
... this trend following system also becomes a hindrance during periods of sharp corrections and subsequent rapid recoveries like we have experienced over the last year. The constant gyration from bullish to bearish momentum and back again creates a counter-productive effect on the strategy.
Measuring Risk On-Risk Off - Using charts to quantify stock, economic and credit risk.
PPO Trading Strategy - How to use 3 PPOs to develop a trend-reversion trading strategy.
Long-term Trend Indicators - Using the PPO, EMA Slope and CCI to determine the trend.
ETF Master ChartPack - 300+ ETFs organized in a Master ChartList and in individual groups.
Follow me on Twitter @arthurhill - Keep up with my 140 character commentaries.
****************************************
Thanks for tuning in and have a good day!
--Arthur Hill CMT
Plan your Trade and Trade your Plan
*****************************************


