Semis Lead Tech Breakdown // Retail Leads EW Consumer Discretionary Lower // Adding MACD to the Best Seven Months Strategy // Adding Bonds for a Rotational Seven Month Strategy // Friday Food for Thought //// .......
Semis Lead Tech Breakdown
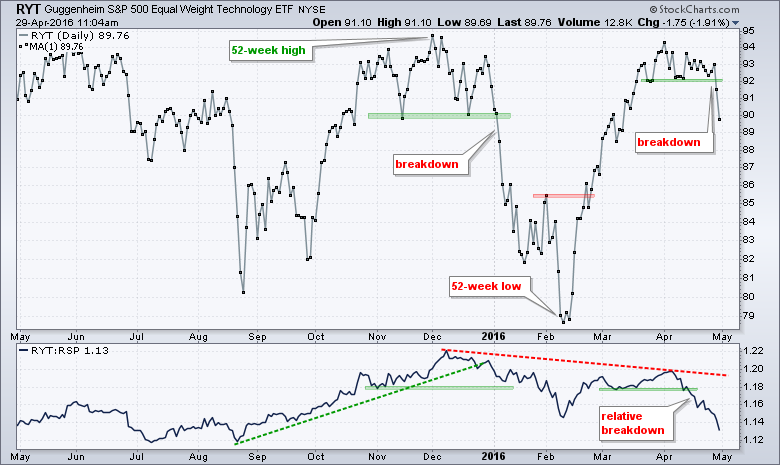
Semiconductors and the average tech stock were holding up better than large-cap techs, but that changed that last two days as both broke down. The EW Technology ETF (RYT) broke support from the lows extending back to late March. In contrast to QQQ and XLK, this ETF represents the average technology stock because its components are equally weighted. RYT fell over 4% this month and weighed on the broader market. This break reverses the upswing that began with the February breakout. The indicator window shows the price relative moving sharply lower as RYT underperforms the EW S&P 500 ETF (RSP).
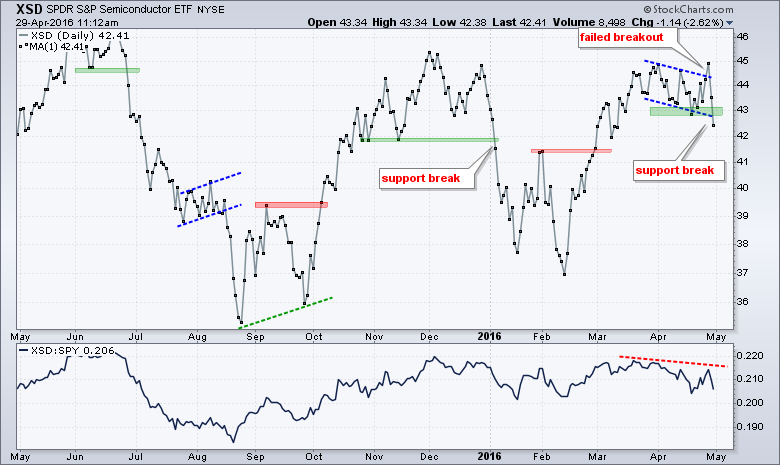
The Semiconductor SPDR (XSD) failed to hold its breakout and broke support with a sharp decline.
Retail Leads EW Consumer Discretionary Lower
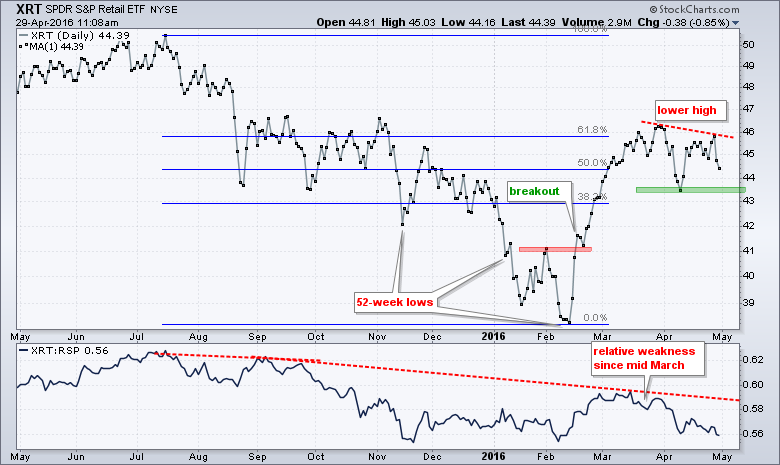
The Retail SPDR (XRT) led the market in February, but stalled out in March and returned to its lagging ways in April. On the price chart, the ETF fell sharply the last two days and formed a lower high in April. Notice that the ETF is hitting resistance near the 62% retracement. A break below the April low would reverse the upswing that began with the February breakout. The indicator window shows the price relative moving lower the last seven weeks as XRT underperforms.
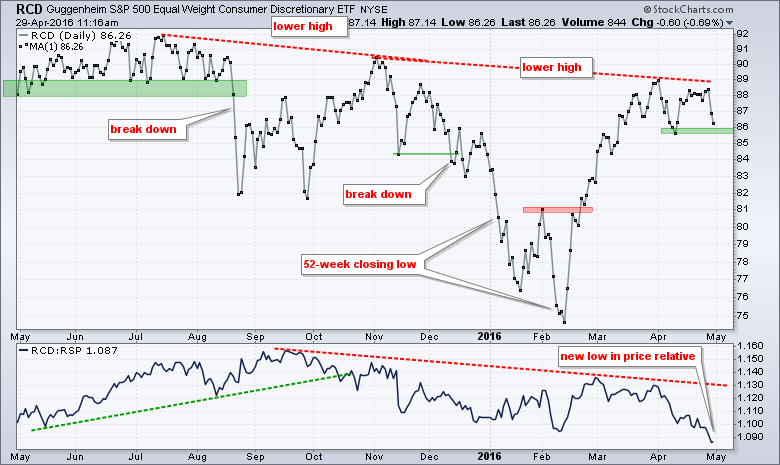
Weakness in retail is weighing on the EW Consumer Discretionary ETF (RCD), which counts Amazon at just 1.25% (a mere mortal). RCD could be forming another lower high after the sharp decline the last two days. A break below the April low would reverse the uptrend that began with the February breakout. The price relative (RCD:RSP) ratio moved to a new low as RCD seriously underperformed the last two months.
Overall, the breakdowns in the EW Technology ETF and Semiconductor SPDR are quite negative because the technology sector accounts for around 20% of the stock market. Further weakness in the Retail SPDR and EW Consumer Discretionary ETF would further the deterioration in the stock market. Note that retail and semiconductors are cyclical groups and breakdowns would bode ill for the economic outlook.
Adding MACD to the Best Seven Months Strategy
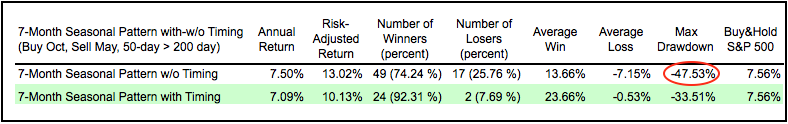
I featured some backtest results for the best six months strategy on Wednesday and would like to expand on that today. We have some knowledgeable members who put forth some suggestions to tweak the strategy. To recap, I found that the best six month strategy improves when we extend it and use the best SEVEN months. Instead of November to April, the best seven month period for the stock market is from October to April. Conversely, the worst five month period extends from May to November. Adding a 50/200 moving average filter for timing did not improve the returns, but it did reduce the drawdowns by getting investors out during the bear markets in 2002-2003 and 2008-2009. The table below sums up the results of the basic seven month strategy with and without timing. Note that I am using Amibroker to run these tests.
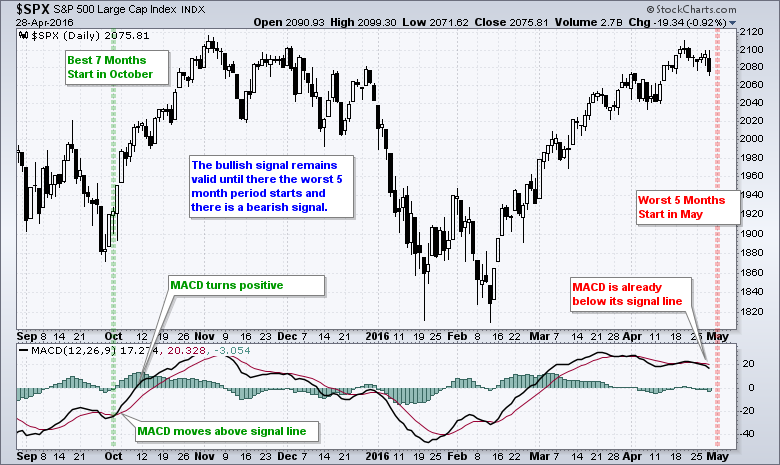
As noted on Wednesday, Sy Harding added a MACD signal to help with timing and Jeffrey Hirsch of the Stock Trader's Almanac tracks this strategy. I am going to test this using the S&P 500 and MACD with two buy triggers. First, I am filtering for the best seven months (October to April). Once this criterion is met, the system goes long the S&P 500 when MACD crosses above its signal line. The second test goes long when MACD moves above the zero line, which means the 12-day EMA has moved above the 26-day EMA. The system remains long until the worst five month period starts (November) and MACD triggers a bearish signal. Again, I am testing for a bearish signal line cross and MACD turning negative. The chart below shows the S&P 500 triggering a bullish signal the day after the best seven months started in October 2015. The worst five months start after the close today and MACD is already below its signal line, which means a bear signal will likely be in effect after the close today.
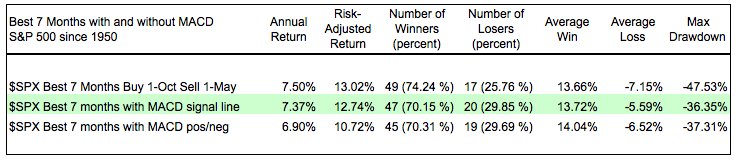
Adding MACD to the best seven months strategy did not improve the returns, but it did reduce the drawdowns. The combination returned 7.37% annually with a 70% winning percentage and a 36.35% drawdown. Overall, there were four drawdowns greater than 25% (1974, 1987, 2001 and 2008). The returns were less when using the zero line for MACD signals. Regardless of the returns, the drawdowns are simply too high to make this a viable system.
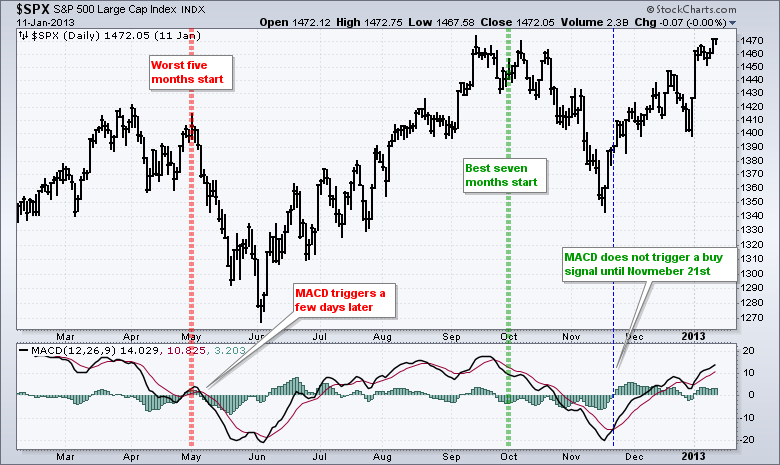
The chart below shows this strategy in action in 2012. Notice that the worst five month period started in May and MACD triggered a signal a few days later. The best seven month period started in October, but MACD did not trigger a signal until November 21st.
Adding Bonds for Rotational Seven Month Strategy
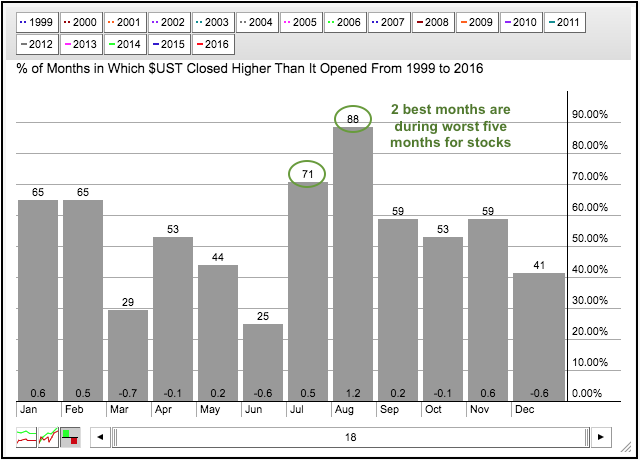
The next test will add a Treasury bond fund to the mix. Instead of just exiting stocks in May, this strategy will switch to Treasury bonds. The chart below shows the seasonal patterns for the US Treasury Note. Notice that the two best performing months are July and August, which is right in the middle of the five worst months for the S&P 500. It is not a perfect negative correlation, but let's see how the backtest works.
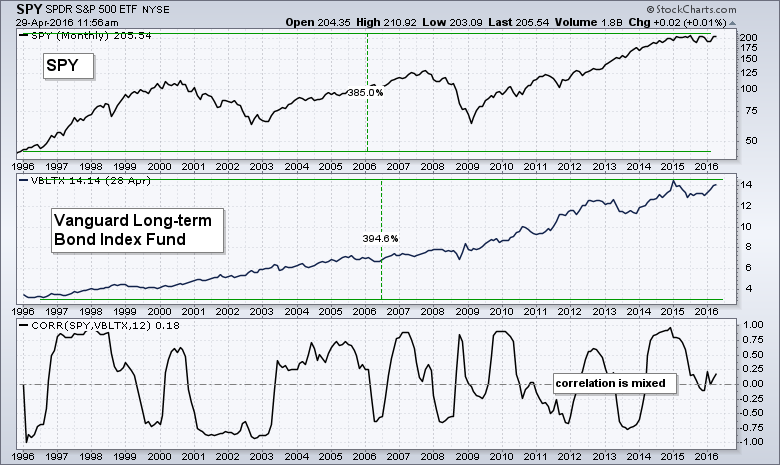
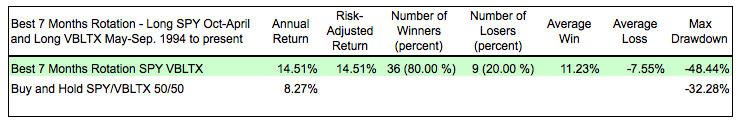
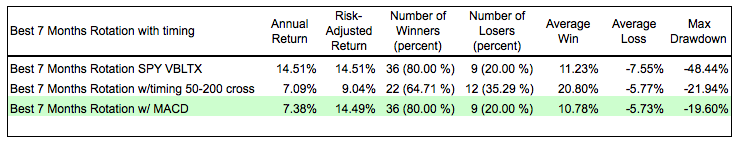
I am using the Vanguard Long-term Bond Index Fund (VBLTX) because it has historical data to 1994 and tracks US Treasury bonds quite well. The strategy is simple: buy SPY on October 1st, sell SPY on May 1st, buy VBTLX on May 1st and sell VBTLX on October 1st. Depending on the period, the strategy is 100% long SPY or VBTLX. By the way, the buy and hold annual return for a 50/50 portfolio (SPY, VBTLX) was around 8.3%!
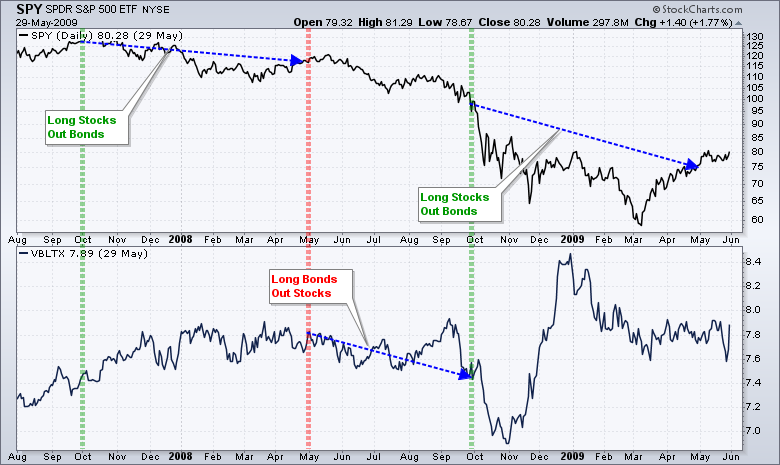
As the table above shows, the results are astounding. The annual return was 14.51% with 80% winners. However, big returns often come with big drawdowns and this one is no exception. The max drawdown is -48.5% because of three consecutive losses from October 2007 to May 2009 (eighteen months). These are shown on with the blue arrows on the chart below.
 Outside of 2008, the largest drawdown was 23% in 2001. Other than these two, the drawdowns were in the 10-15% range, which is tolerable. Thus, baring some sort of financial crisis (2008) or terrorist attack (2001), this strategy looks pretty good.
Reducing Drawdowns with Timing and Rotation
We can attempt to reduce the drawdowns by adding a timing mechanism, such as a moving average crossover or MACD. As the table below shows, the best seven months rotation strategy with MACD timing produced some pretty good results. The annual return was 7.38%, the risk-adjusted return was 14.5% and the max drawdown was around 20%. These results were better than timing with the 50-day and 200-day moving averages.
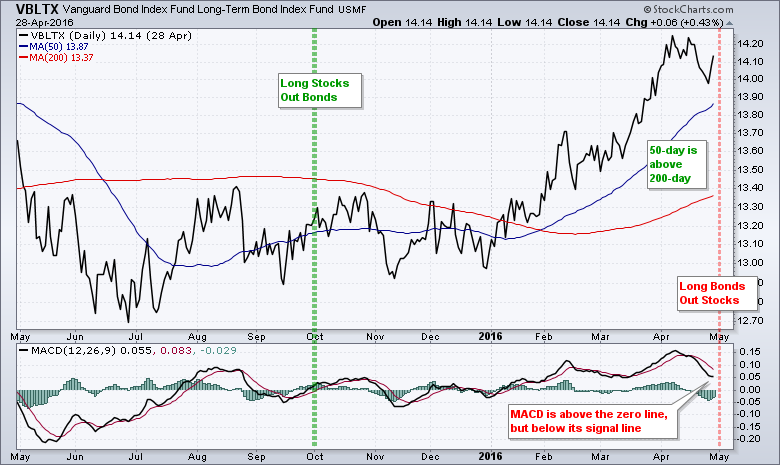
Investors using this strategy would be preparing to switch from stocks to bonds. The best seven months for stocks ends today and MACD is below its signal line for SPY. The timing signal for bonds is mixed though. The trend is up because MACD is positive and the 50-day moving average is above the 200-day moving average. A pullback is underway because MACD remains below its signal line. This suggests that VBLTX corrected in April and chartists should wait for an end to this correction. A bullish MACD signal line cross would signal an upturn in momentum.
Friday Food for Thought
For Robo-Advisers, the Next Bear Market Is Make or Break (Bloomberg)
Robo-advisers might have more reasons to be worried about the next bear market than investors do. A bear market would represent a challenge that the ranks of robo-advisers haven't encountered yet, and it would be the ultimate test of just how crucial, or irrelevant, working with actual humans is too good, long-term investing.
The future of TV is arriving faster than anyone predicted (Larry Downes, Washington Post)
With more streaming TV options like the Apple TV arriving, it may be time to cancel your cable service. But which streaming services offer which channels, and how do you know if you'll save money in the long run?
Smart-Beta War Rages On as Cliff Asness Slams Arnott's Paper (Tom Redmond, Bloomberg)
"Trying to time the market is a dumb idea". That in a nutshell is Cliff Asness’s opening salvo into an escalating war of words over smart-beta exchange-traded funds, triggered in February when one of the inventors of the approach said many had become too expensive. Asness, co-founder of AQR Capital Management, joins other theoreticians jumping in the fray, which goes to the heart of a strategy that bridges active and passive management.
IS TACTICAL BROKEN? (Corey Hoffstein, Newfound Research)
Many tactically risk-managed strategies use trend following to manage the risk of severe drawdowns, but in sideways markets, like those experienced in 2011 and 2015, trend following ends up lagging the market by buying high and selling low. As with insurance policies or static allocations to bonds, this underperformance is an implicit cost of managing risk.
******************************************************
Measuring Risk On-Risk Off - Using charts to quantify stock, economic and credit risk.
PPO Trading Strategy - How to use 3 PPOs to develop a trend-reversion trading strategy.
Long-term Trend Indicators - Using the PPO, EMA Slope and CCI to determine the trend.
ETF Master ChartPack - 300+ ETFs organized in a Master ChartList and in individual groups.
Follow me on Twitter @arthurhill - Keep up with my 140 character commentaries.
****************************************
Thanks for tuning in and have a good day!
--Arthur Hill CMT
Plan your Trade and Trade your Plan
*****************************************


