Generals Not Following the Troops // Unfilled Gaps Haunt QQQ // SPY Set to Test Gap Zone // IWM is the Current Leader // XLI Leads with New High // Three Strong Groups within Technology // Yen Broke out Before BoJ Surprise // Gold Battles Flag Breakout // Oil Reaches Fibonacci Retracement // Stocks to Watch ADI, INTC, QCOM, ORCL, FINL, CHS //// .......
Generals Diverge from the Troops
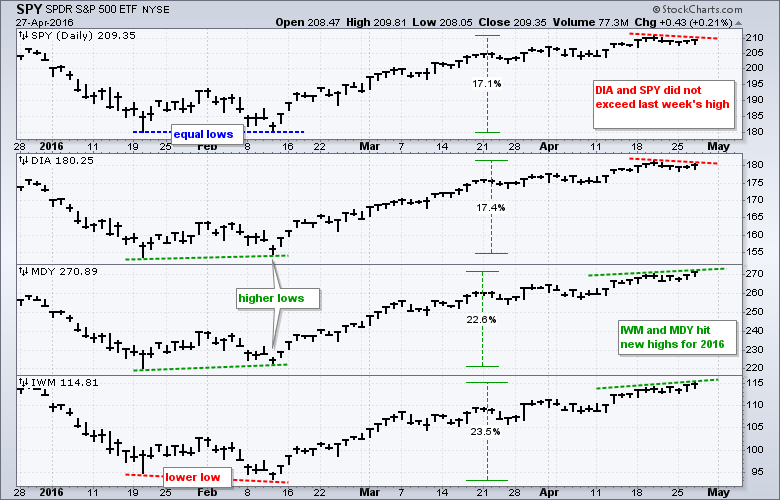
Large caps have diverged from small and mid caps over the last two weeks. The S&P MidCap SPDR (MDY) and Russell 2000 iShares (IWM) moved to new highs for the year, but the S&P 500 SPDR (SPY) and Dow Diamonds (DIA) did not record new highs. Granted, SPY and DIA did record all time highs last week and they are less than 1% from these highs. Even though these are small price divergences, they do show a short-term anomaly that could lead to a corrective period. Keep in mind that this anomaly is not a long-term or even a medium-term issue. The bigger trends are up and pullbacks within this trend are considered corrections. Also keep in mind that corrections can involve price, time or both. A pullback represents a price correction and a consolidation is a time correction.
Treasury Yields Fall
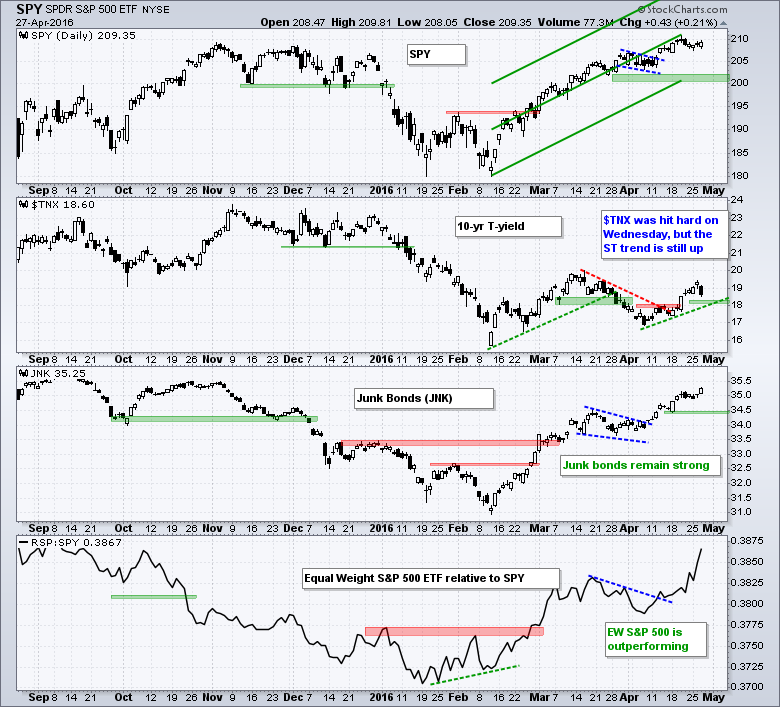
The risk indicators remain net bullish, but the 10-YR Treasury Yield ($TNX) was hit hard as money moved out of Treasury bonds on Wednesday. The chart below shows $TNX falling back below 19 (1.9%). The swing remains up and I am marking support at 18. A close below 18 (1.8%) would reverse this upswing and this could be negative for stocks, especially financials. Elsewhere, the High Yield Bond SPDR (JNK) remains in a strong uptrend and the EW S&P 500 ETF (RSP) is outperforming SPY.
Unfilled Gaps Haunt QQQ
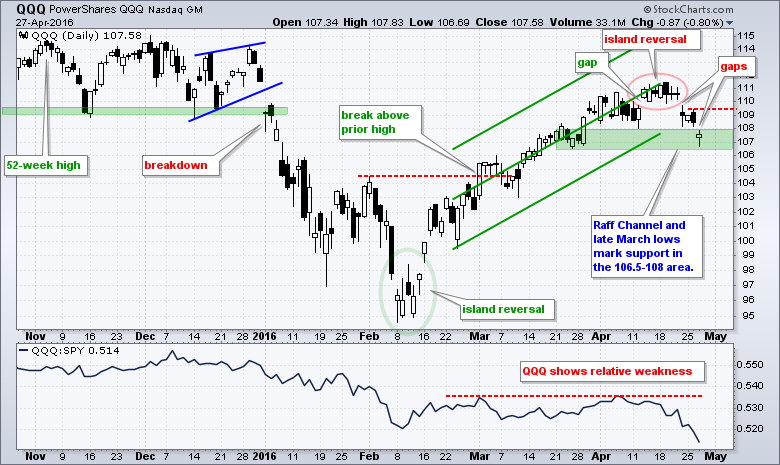
QQQ shows two unfilled gaps and some serious relative weakness. As noted in Wednesday's Don't Ignore This Chart post, weakness in QQQ can be attributed to Apple, Microsoft, Google, Amazon and Intel. These five stocks account for around 38% of the ETF and they are down 6-10% year-to-date. QQQ is down around 3.5% year-to-date, while SPY is up around 3% and IWM is up around 2%. Clearly, there is a problem with large-cap techs right now (sans Facebook). QQQ is testing support in the 107 area and this area defines the medium-term uptrend. Short-term, the island reversal and gaps are bearish until proven otherwise. A close above 109.5 would fill the last gap and reverse the short-term downtrend.
SPY Set to Test Gap Zone
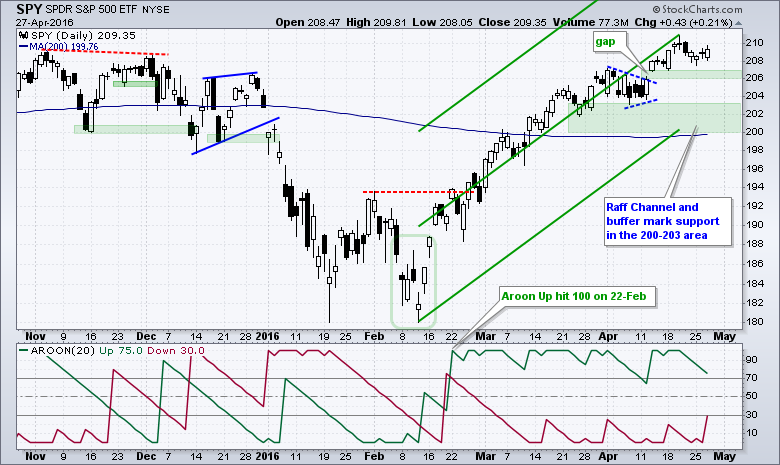
SPY is still holding the 13-April gap, but this level could be tested today as the futures point to a lower open. While a break below 206 would be short-term bearish, I would still view this as a correction within a bigger uptrend and look for support in the 200-204 area. Note that the 200-day is around 200 and a close below this level would reverse the uptrend that began in February.
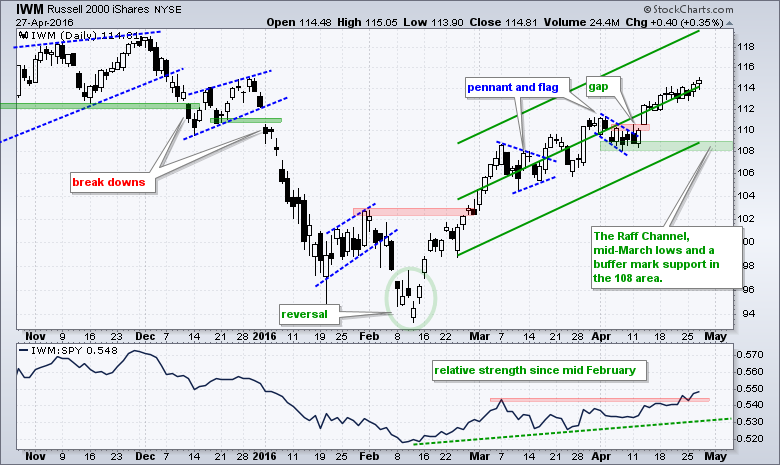
IWM is the Current Leader
IWM is the strongest of the big three right now. The ETF hit a new high for 2016 on Wednesday, the 13-April gap held and the price relative broke out last week. I extended the Raff Regression Channel to account for Wednesday's closing high and raised key support to 108.
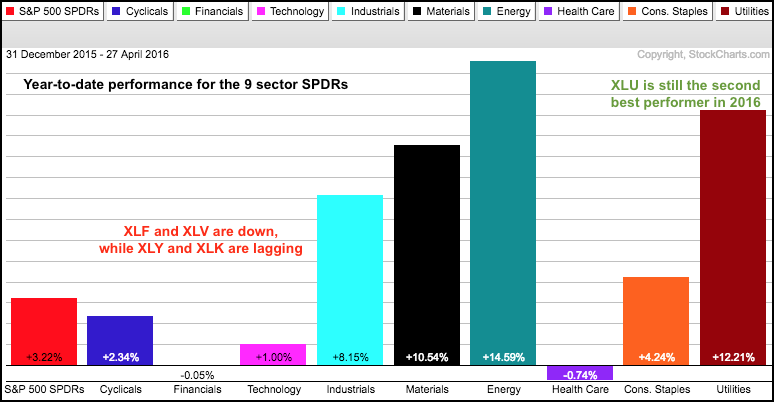
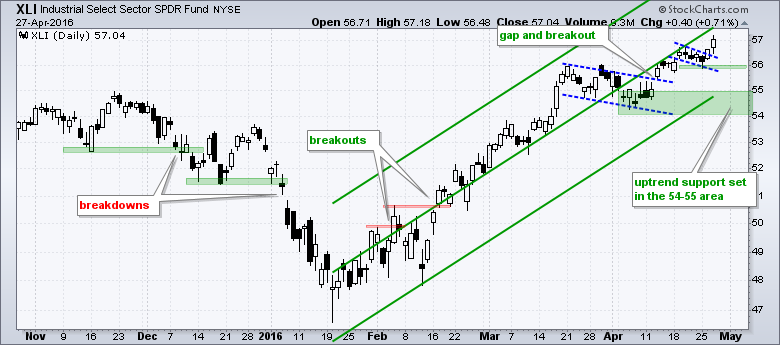
XLI Leads with New High
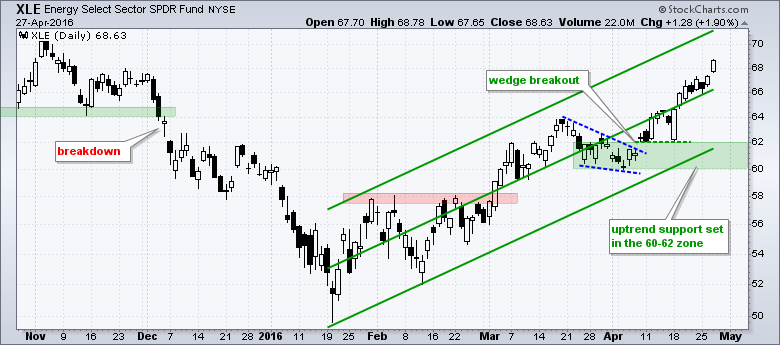
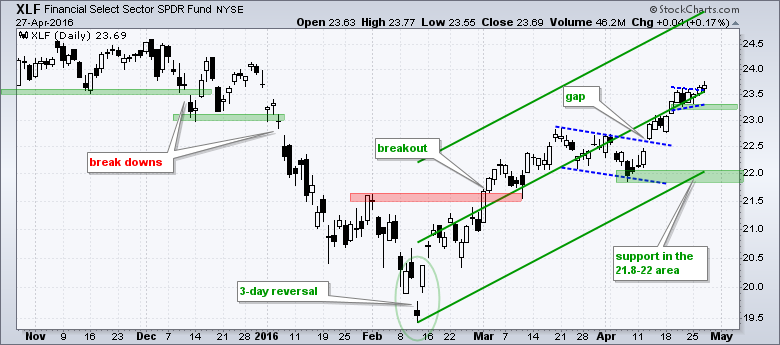
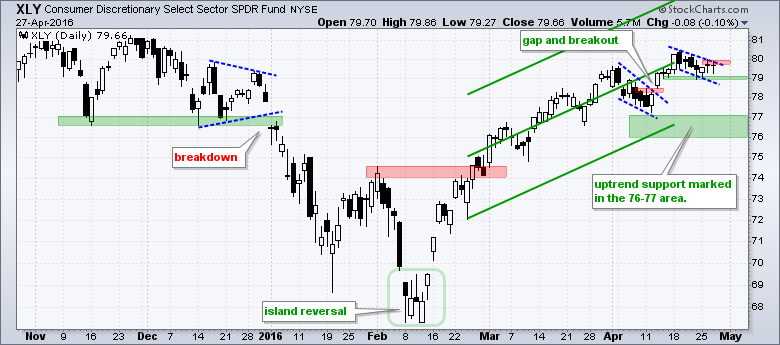
The Industrials SPDR (XLI) hit a new 52-week high on Wednesday and is the strongest of the nine sector SPDRs. The Energy SPDR (XLE) reached its highest level of the year (2016) and the Materials SPDR (XLB) reached its highest level since June 2015. These three are the leaders right now. Of note, the Finance SPDR (XLF) and the HealthCare SPDR (XLV) are the only two sectors still down year-to-date. The Technology SPDR (XLK) is up just 1% and the Consumer Discretionary SPDR (XLY) is up less than SPY. Both are lagging. Despite its big loss in April, the Utilities SPDR (XLU) is still the second best performing sector in 2016.
XLI got a little flag breakout on Tuesday and extended on Wednesday. This flag breakout comes when the trend is quite extended and XLI looks ripe for a corrective period. Overall, the trend is up with support marked in the 54-55 area.
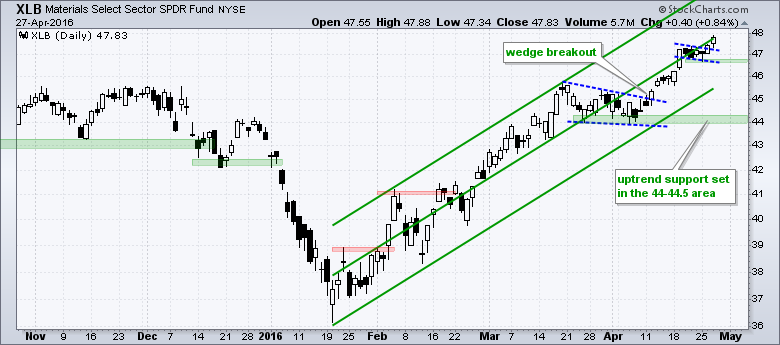
XLB also got a little flag breakout and the flag low marks first support. I extended the Raff Regression Channel because of the new closing high, but will leave key support at 44 for now.
XLE is up around 10% since its opening lower near 62 on Monday, April 18th. This one is also getting extended short-term and medium-term. The Raff Regression Channel and wedge lows mark support in the 60-62 area.
XLF has a small pennant breakout working, but it too is quite extended with an 8% advance the last three weeks. The Raff Regression Channel and April lows mark support in the 22 area.
XLY has a bull flag working the last seven days, but AMZN reports today and this stock accounts for around 10% of the ETF. A breakout at 80 would be bullish for XLY and extend the overall uptrend. The Raff Regression Channel and April low mark uptrend support in the 76-77 area.
Three Groups Perking Up within Technology
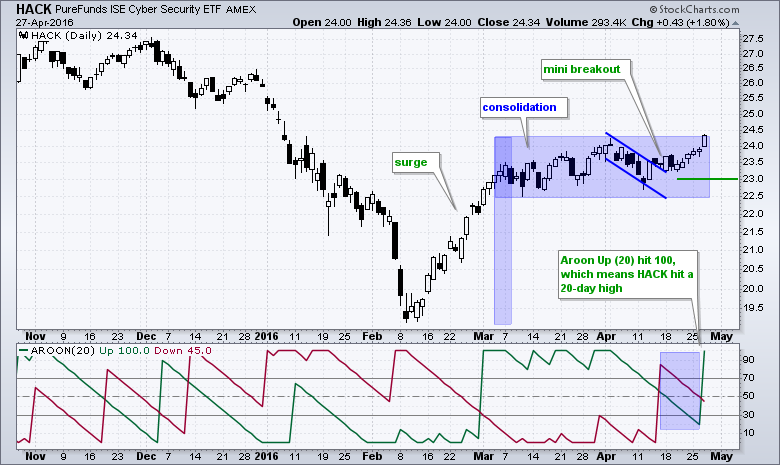
Even though QQQ and XLK are trending lower in April, there are some pockets of strength in the technology sector over the last few weeks. The Cyber Security ETF (HACK) surged 1.8% on Wednesday and closed at its high of the month. The pattern since February looks like a sharp advance, consolidation and breakout.
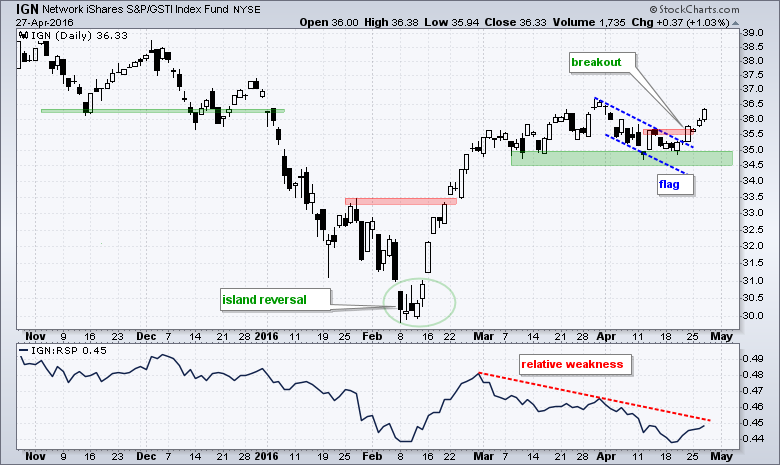
The Networking iShares (IGN) got a bounce off support and flag breakout last week. Even though IGN shows relative weakness since March, the trend is up with key support is set in the 34.5-35 area.
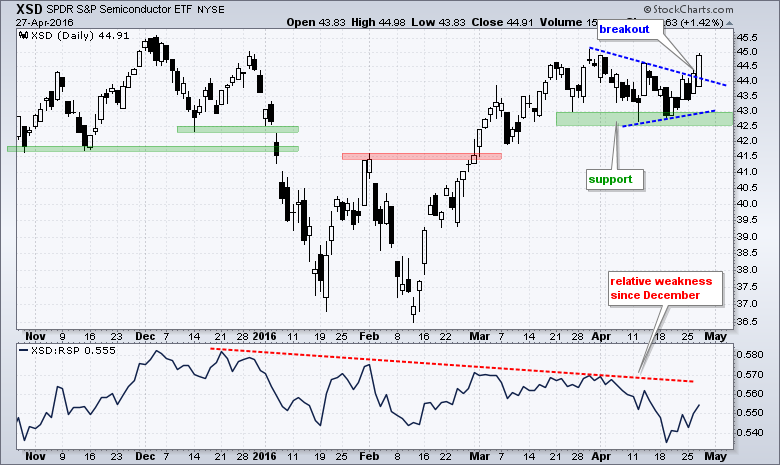
The Semiconductor SPDR (XSD) broke triangle resistance with a surge on Tuesday and followed through on Wednesday with a big gain. This breakout signals a continuation of the February-March surge. Key support is set in the 42.5-43 area.
Yen Broke out Before BoJ Surprise
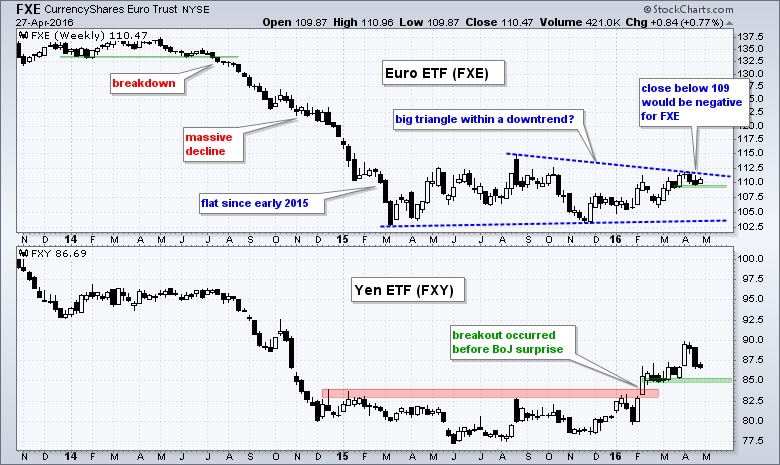
Since Japan, the Yen and the Dollar are all over the news this morning, I will cover the charts for gold, the Dollar and oil. The US Dollar ETF (UUP) is based on a basket of currency crosses against the Dollar. The Yen is surging against the Dollar and this is putting downward pressure on UUP because the Yen accounts for around 14% of this ETF. The indicator window on the chart below shows the Yen ETF (FXY) breaking out in January and today's surge is just a continuation of this breakout. The Euro ETF (FXE) is up slightly today and the Euro accounts for around 58% of UUP. Clearly, the Euro is the one to watch when it comes to UUP. FXE is basically flat since early 2015 with a triangle possibly taking shape. The swing within the triangle is up with support marked at 109.
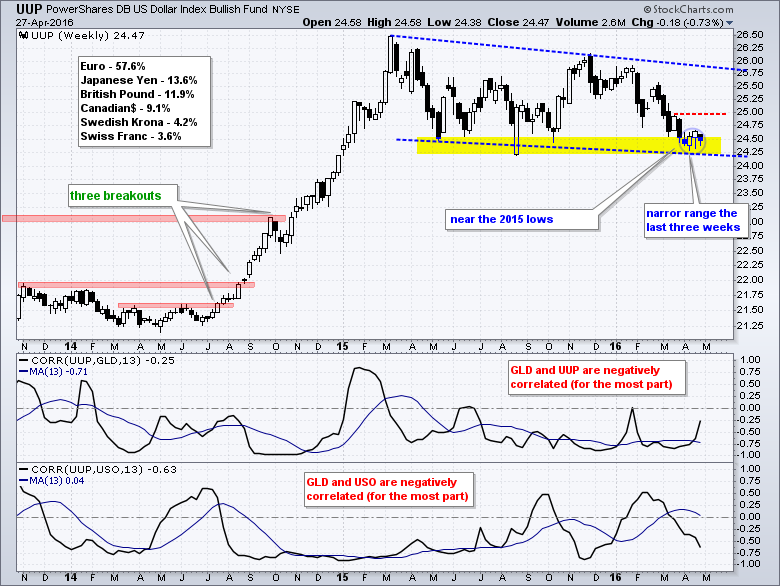
The US Dollar ETF (UUP) is in a clear downtrend since February 2015 and the ETF is trading near its 2015 lows. Trading turned quite dull the last four weeks as the ETF stalled in the 24.5 area. This four week stall could be a consolidation within a downtrend and a break below the April lows would signal a continuation lower. Such a move would be positive for oil and gold because both are negatively correlated with bullion. I am marking first resistance at 25 and will require a weekly close above this level before considering a bullish stance.
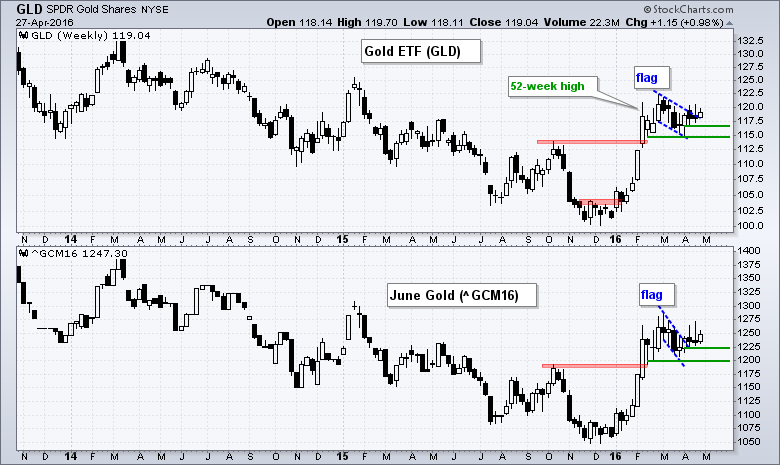
Gold Battles Flag Breakout
There is no real change for the Gold SPDR (GLD) or June Gold (^GCM16). Both have flag breakouts working and these breakouts are holding for the most part. GLD surged above 120 each of the last two weeks, but fell back by the end of the week. We may see another attempt to follow through on the flag breakout today. There are two levels to watch for a failure. A close below the mid April low at 116.95 would negate the flag breakout. A close below support at 114.9 would reverse the 2016 uptrend.
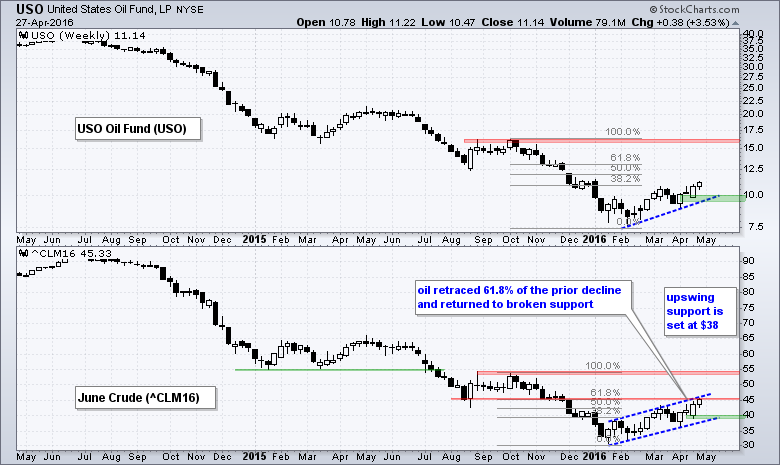
Oil Reaches Fibonacci Retracement
Oil Continued higher this week and is up around 3.5% the last three days. Even so, my overall assessment does not change. This looks like a counter-trend rally within a bigger downtrend. A 50% advance in three and a half months is nothing to sneeze at, but it still pales relative to the bigger downtrend and the prior decline (October to January). Notice that June Crude (^CLM16) is near the 61.8% retracement and broken support, and this area could mark a resistance or reversal zone. The blue channel lines define the 2016 uptrend with support marked $38.
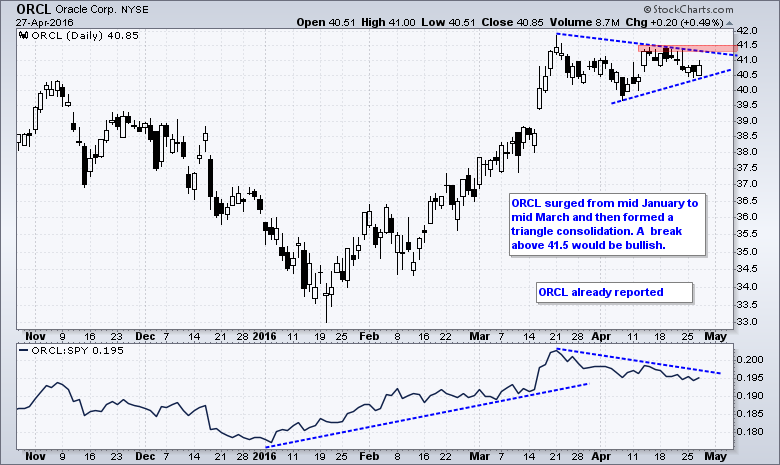
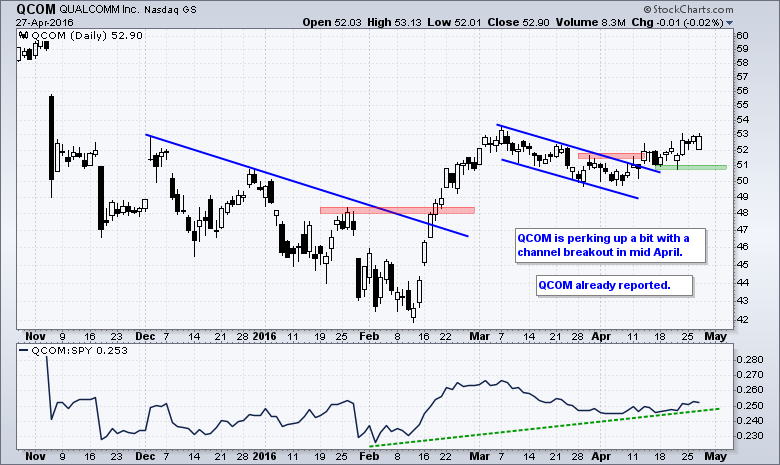
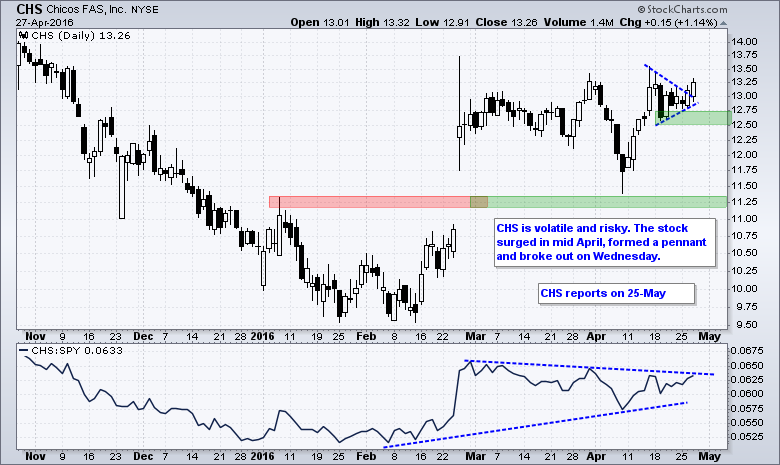
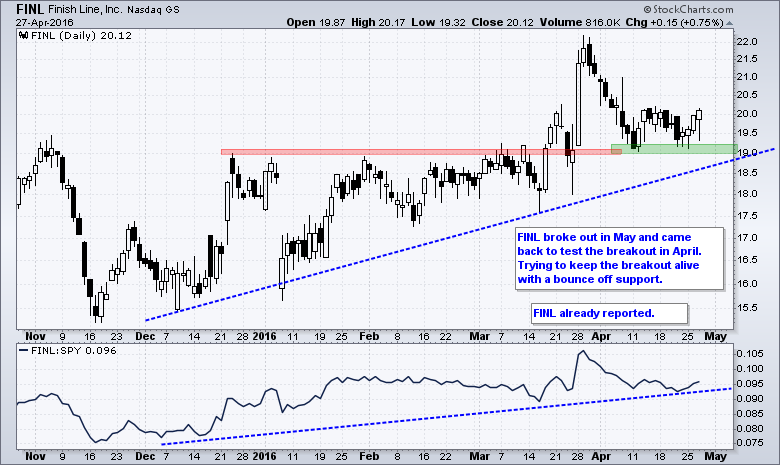
Stocks to Watch
******************************************************
Measuring Risk On-Risk Off - Using charts to quantify stock, economic and credit risk.
PPO Trading Strategy - How to use 3 PPOs to develop a trend-reversion trading strategy.
Long-term Trend Indicators - Using the PPO, EMA Slope and CCI to determine the trend.
ETF Master ChartPack - 300+ ETFs organized in a Master ChartList and in individual groups.
Follow me on Twitter @arthurhill - Keep up with my 140 character commentaries.
****************************************
Thanks for tuning in and have a good day!
--Arthur Hill CMT
Plan your Trade and Trade your Plan
*****************************************


